



Mapping a 12,000-row customer list is mostly a data-repair job. Every street address has to become a pair of coordinates before anything can be drawn, and the rows that fail that conversion end up on a list most teams never open. Address mapping software runs the conversion at volume and renders whatever survives it. How many rows survive depends on confirming the column match before geocoding starts and then working the reject list afterward. Both get skipped as a matter of routine.
What Address Mapping Software Does With a 10,000-Row File
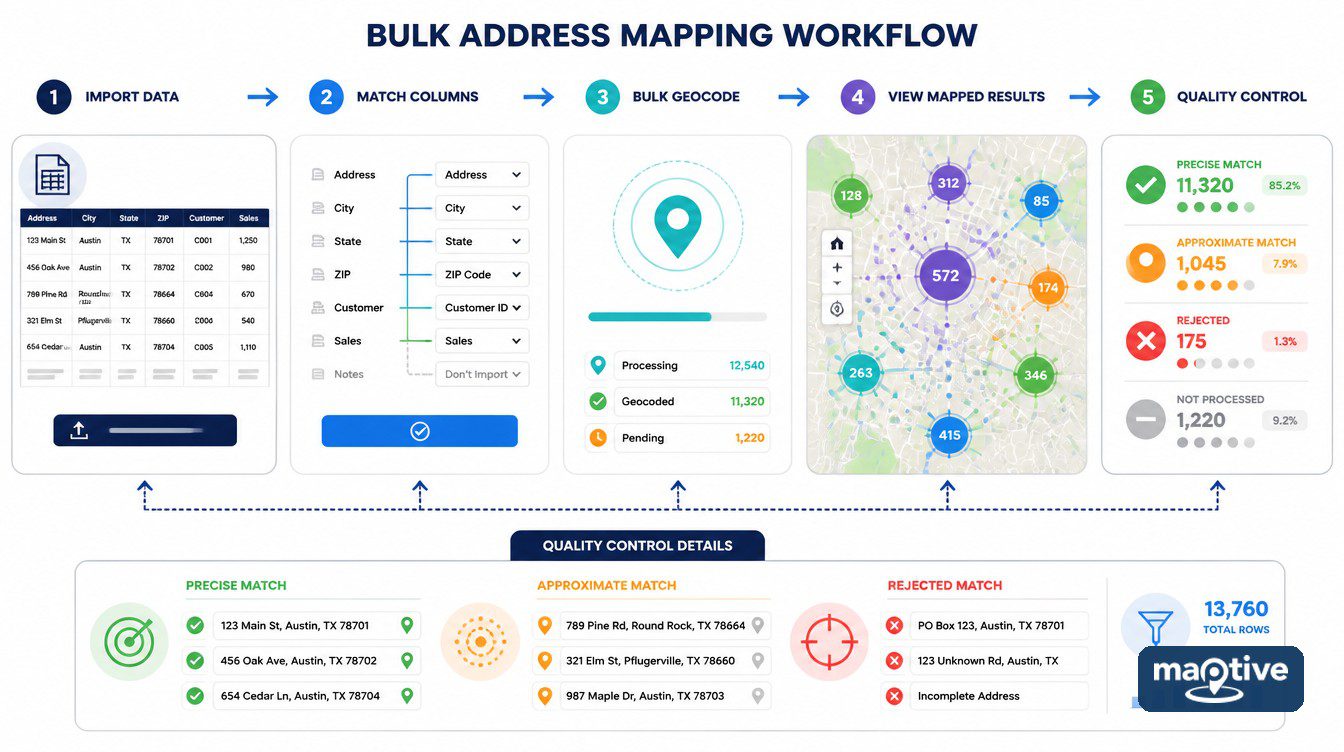
Because every address-only row has to be converted into geographic coordinates before anything can be drawn, a list of 40,000 records with coordinates already attached is a lighter job than 8,000 address-only rows spread across a national footprint. 1600 Amphitheatre Parkway, Mountain View, CA becomes latitude 37.423021 and longitude -122.083739, once per row. Drawing the points afterward costs almost nothing.
The volume ceiling almost never binds on a platform built to map customer locations at scale. A single map takes up to 100,000 locations on the annual Plus subscription, with performance visibly declining past 75,000 depending on how much accompanying data each row contains. What does bind is the free consumer map builder most teams try first. It allows 2,000 features per layer and 10,000 per map and instructs users not to import files over 2,000 rows. That is the ceiling a 12,000-row list meets. The import stops at 2,000 and the map still renders, so the shortfall turns up when someone counts markers against the source file.
How to Map a List of Addresses From Excel
What Your Spreadsheet Needs Before Upload
The file needs a header row and one location column, nothing beyond that. The data has to be tabulated in an Excel or Google spreadsheet with the column names in the first row. A street address will map. So will a postal code on its own, and so will city plus state. Location data can be split across separate columns or written as a single comma-delimited line.
There is little reason to scrub the file before it goes up. Anything the engine cannot resolve comes back on a reject list, covered below, and on a national file that list usually runs to a few hundred rows out of 10,000.
Create the Map and Upload the File
Sign in and click Create New Map on the upper right. The button is available from any tab. Starting a new map leaves the existing ones untouched. Name the map in the dialog that appears, add a short description if it helps whoever inherits it, and click Continue.
Four routes get the data in. Map Excel data by dragging the file onto the page, or click Add File to browse for it, with Excel, CSV and TSV all accepted. Copy the data with its column headers and paste it in directly. Build the map from a Google Sheet, or create a blank map and add locations by hand. Then click Map Now. Load time depends on the size of the data set.
Geocoding has not started at this point. All the choice decides is what the next screen has to match against, and a paste made without its column headers leaves that screen with nothing to work from.
Why the Column Match Step Decides the Map
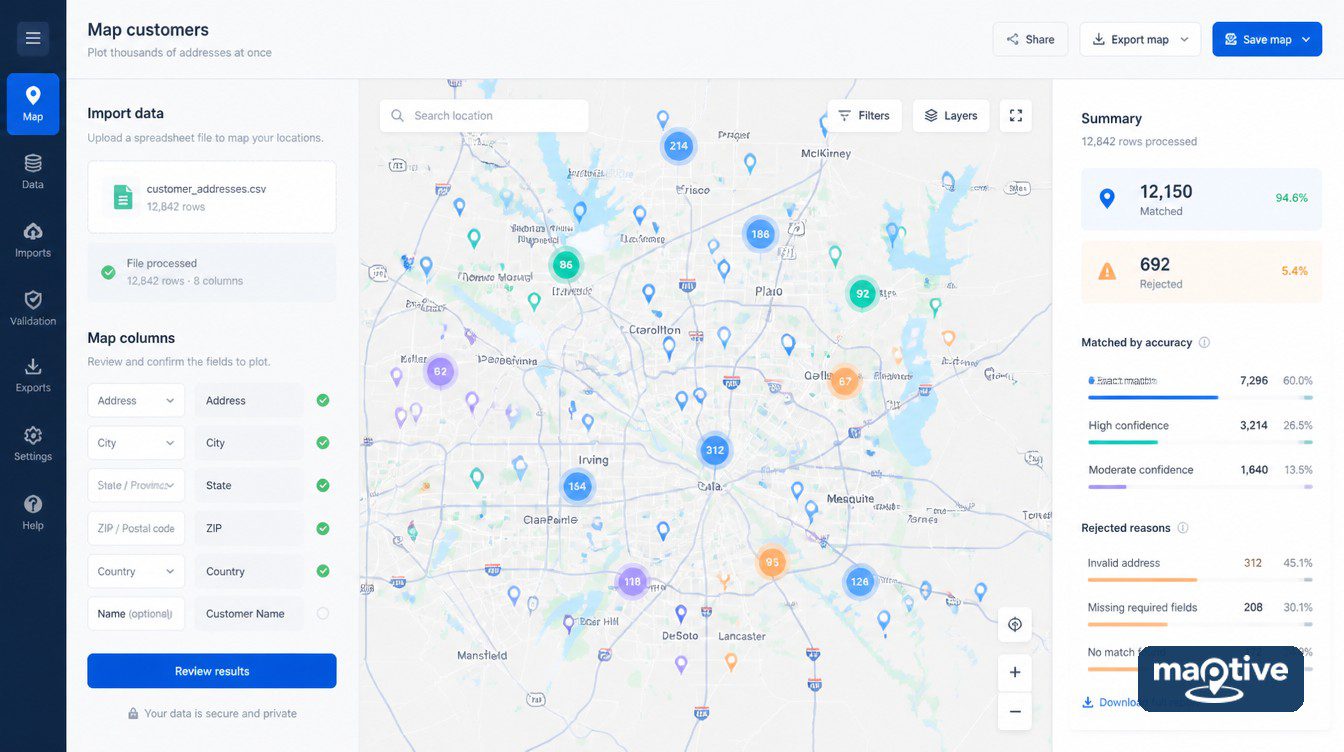
A dialog appears next so the address columns can be verified, and the software matches them automatically wherever it recognizes the header. Nothing is converted while the file uploads. The geocoding process begins when Done is clicked on that screen.
Auto-detection handles headers named Address, City, State and Zip Code without help. The columns it cannot place are the ones a CRM named for its own reporting, a billing street field or a shipping region, and those need setting by hand. The first section takes address information only. A location name or a phone number matched into that section corrupts every coordinate it produces. The mistake surfaces the first time somebody opens a marker next to the row it came from, which on a 12,000-row file can be a fortnight later.
Display fields belong in the second section, where the location title governs what appears on marker hover and at the top of the marker popout, alongside website URL, image URL, email address and phone number. Any mismatch is corrected with the drop-down arrow, which lists every column in the data set. The step can be revisited later from a marker’s gear icon or from the Data tab under Categorize Data, and a change made on one marker updates all of them.
Bulk Geocoding With Coordinates Instead of Addresses
Before uploading address text, check the CRM export for latitude and longitude columns. Pasting them as two separate columns and matching them with the drop-down selector plots the data roughly 10 times faster than address data that has to be geocoded first, since the coordinate upload skips the conversion step entirely. On a 25,000-row list the same multiple applies, and the address version is the one that has to be started and left running.
Raw GPS values are not interchangeable with latitude and longitude and have to be converted before they will map. Coordinates cannot be taken back out either. Google’s licensing prohibits viewing or exporting geocodes to external applications. Anyone intending to bulk geocode addresses once and reuse the coordinates in a warehouse or a second system has to bring their own.
Why Some Addresses Do Not Show Up on the Map
Ambiguous City Names Without a State Column
A city name with several national matches is the most common cause of silent row loss on a national file. Geocoding engines resolve the ambiguity by reading the columns around the city for state, country or province. Where those columns are absent the row is skipped and nothing replaces it. Several cities named Springfield, each in a different state, is the standard illustration. Ambiguity of that kind is still an open problem in modern geocoding systems.
Adding a ZIP code column, or a country and region column, gives the engine more to resolve against. The same correction applies wherever the file ends up. A national customer list without a state column produces a map with the correct outline and a row count that no longer matches the source file. When 9,780 markers come back against 10,000 source rows, the missing 220 have usually failed on the same handful of ambiguous city names, so the repair is one column wide.
Incomplete Addresses and the Reject List
A typo, a missing street number, or an address that changed after the reference data was built comes back as a no-match, and those rows are the visible failures. They do not disappear. Maptive pulls them out for export back to a spreadsheet, so the reject list is the first file to open after a large upload. Correcting the rows there and re-uploading them is a short job on a few hundred records.
How Accurate Is a Geocoded Pin
Rooftop, Interpolated, and Approximate Matches
Every mapped location is assigned one of four grades describing how precisely the coordinate was resolved.
ROOFTOP. The point is precise to the street address.
RANGE_INTERPOLATED. The point was estimated along a road between two known points such as intersections. It is returned when no rooftop geocode exists for that address.
GEOMETRIC_CENTER. The point is the center of a street polyline or a region polygon.
APPROXIMATE. The point is placed somewhere inside the area the address resolves to, with no building-level precision.
On a 10,000-row national file the interpolated and approximate results collect in predictable places. Rural routes, new construction, and any address created after the reference data was built resolve to something less precise than a building. Precision at this level depends on the underlying geo addressing data and not on the map drawn over it. Every grade renders in the same size and the same color. A rural address resolved to the middle of a road segment is indistinguishable on screen from a rooftop match on a city block. The grade is recoverable only from the record, never from the pin.
PO Boxes and Missing Suite Numbers
Address data fails in ways that are not equally visible.
A missing apartment or suite number produces a street-only match. The record passes validation under the Coding Accuracy Support System and fails delivery-point validation, so the point comes back on the block instead of at the unit.
A PO Box resolves to the post office that serves it. On a customer list heavy with them, a whole region appears to be located at one downtown intersection.
A no-match comes from a typo or a missing component, and this category at least declares itself on the reject list.
The category with no entry on the reject list is the false positive. It comes back marked as found, at a plausible street number in the correct city, and the usual way it surfaces is a rep arriving at the address.
How to Spot-Check a Large Map
Match rates on large national files are in the 90% to 95% band in most states, higher on the West Coast and lower where the underlying road and address reference data struggles in rural areas, so a few hundred rejects in a 10,000-row file is the expected result and not a sign of a bad upload. The match rate says nothing about how many of the matched rows are on the wrong building.
20 markers chosen at random and checked by hand against their source rows will surface a systematic error faster than any summary figure will. Scattered errors on a customer map are tolerable. An entire state collapsing onto its geometric center is not, and that is what a state column matched into the address section by itself produces.
Filtering and Grouping a Map With Thousands of Markers
At 10,000 rows the map is a solid mass of overlapping markers, legible as one block of color and not as data. Filtering is how it gets checked. An error buried in the full set is obvious the moment everything else leaves the screen. Nothing is deleted in the process, so the same file can be interrogated a dozen ways in a few minutes.
The Filter Tool opens from Map Tools and lists every column header in the file. A Group filter on state or region isolates one geography at a time. Searching within one column with a Text filter finds a single store number or account in a national set. Number filters give a slider from the column’s lowest value to its highest, which surfaces rows where a numeric field arrived empty or wrong. Attribute and Date filters do more for analysis than for checking.
Where filtering takes everything else out of view, the Group By selector keeps the full set and assigns a distinct marker color to every value in a chosen column. That is enough to read a distribution off a map that was one block of color a moment earlier. A blank value gets its own color band, which is how a column that failed to populate declares itself. Past a certain density a heat map is more legible than individual markers.
What to Do With the Map After It Loads
The same upload answers the next set of questions. Distances between two sets of points, a territory drawn around a subset, and driving routes to clusters of accounts all run off it without a second import. A cluster of markers can be enclosed with the Lasso Tool and handed straight to optimized routes and directions. Nothing gets a raw customer file to a drivable route in fewer steps.
That reuse is what turns an unresolved reject list from an import problem into a standing one. New records append through the Add to Existing Data button, so teams that map Excel data on a monthly cycle are not rebuilding the map each time. The rows that failed to geocode on the first pass persist across every later cycle, and every territory, route and polygon drawn afterward is drawn on the rows that resolved.
Maps are private by default and visible only when the owner shares the link. Before a link goes to anyone outside the team, either work the reject list down to zero or state its length in the message that carries the link.
Frequently Asked Questions
Ask the question of the tool rather than of the data. A free consumer map builder allows 2,000 features per layer and 10,000 per map, and tells users not to import files over 2,000 rows at all. The annual Plus subscription takes 100,000 locations on a single map, with visible slowdown past 75,000 and sooner than that on files carrying many attribute columns per row.
Bulk geocoding is converting a whole list of street addresses into latitude and longitude coordinates in one operation so they can be plotted. A single address such as 1600 Amphitheatre Parkway, Mountain View, CA becomes latitude 37.423021 and longitude -122.083739. Doing that for thousands of rows in one pass is the difference between address mapping software and a manual lookup.
One location-specific field per row and a header row above it. A street address will map, and so will a city plus a state, and so will a postal code by itself. Everything else in the file becomes attribute data hanging off that point. That is the part worth being generous with, since grouping, filtering and heat maps all run on the columns nobody thought to include.
Keep it in a tabulated Excel or Google spreadsheet with the column names in the first row, and make sure enough correct location data is present. City plus state or a ZIP code is the minimum. After uploading, check that the match and display selectors point at the right columns before starting the geocoding.
Yes. Excel, CSV and TSV files are all accepted. Data can also be copied and pasted in with its header row, imported from a Google Sheet, or entered manually onto a blank map.
Because a pin is a graded result rather than a yes-or-no one. ROOFTOP puts the point at the street address. RANGE_INTERPOLATED estimates a position along a road between two known points, and GEOMETRIC_CENTER and APPROXIMATE fall back to the middle of a street or a region. Rural routes and new construction collect in the lower three grades, and most complaints about pin placement trace back to them.
Check the CRM export for coordinate columns before uploading address text, because the coordinate route skips the conversion step entirely and plots roughly 10 times faster. Paste latitude and longitude as two separate columns and match them with the drop-down selector. Raw GPS values are a different format and have to be converted before they will map.
Load time scales with the size of the data set, and the geocoding is the slow part. Building the map is a handful of clicks. The wait is the address-to-coordinate conversion, which is why plotting existing coordinates is around 10 times faster than plotting addresses.
Through a mapping platform, geocoding is bundled into the subscription. Building it against a raw geocoding API costs roughly $5.00 per 1,000 requests in the entry paid tier in 2026, with volume discounts above 100,000 requests. There is no batch endpoint, so 50,000 records means 50,000 individual calls plus the engineering time around them.
Count the markers against the source file first, since the answer differs by how many are missing. A shortfall of thousands points at a row ceiling in the tool itself. A shortfall of a few hundred points at individual rows that could not be resolved, usually an incomplete address or a city name with several national matches. Those rows are pulled out for export back to a spreadsheet, corrected there and re-uploaded.
Not from Maptive. Google’s licensing prohibits viewing or exporting geocodes to external applications, so coordinates generated inside the platform stay there. The map data itself can be exported to a separate file with the Export Data tool.
Yes. The built-in spreadsheet editor supports editing, adding, deleting and appending through the Add to Existing Data button, and single rows can be added from the Data tab. A CRM database can also be connected through Maptive’s API so the map refreshes without a manual import.








