
This lawn care example turns a customer map into 9 optimized routes, accounting for weekly and biweekly visits and the estimated cut time for each job.
After you load a spreadsheet into Maptive, each customer appears on the map as a pin. This map shows all the customers assigned to one lawn care crew. You can map multiple crews together, but this example focuses on one crew. The same approach also applies to a sole proprietor.
Color Markers by Customer Type
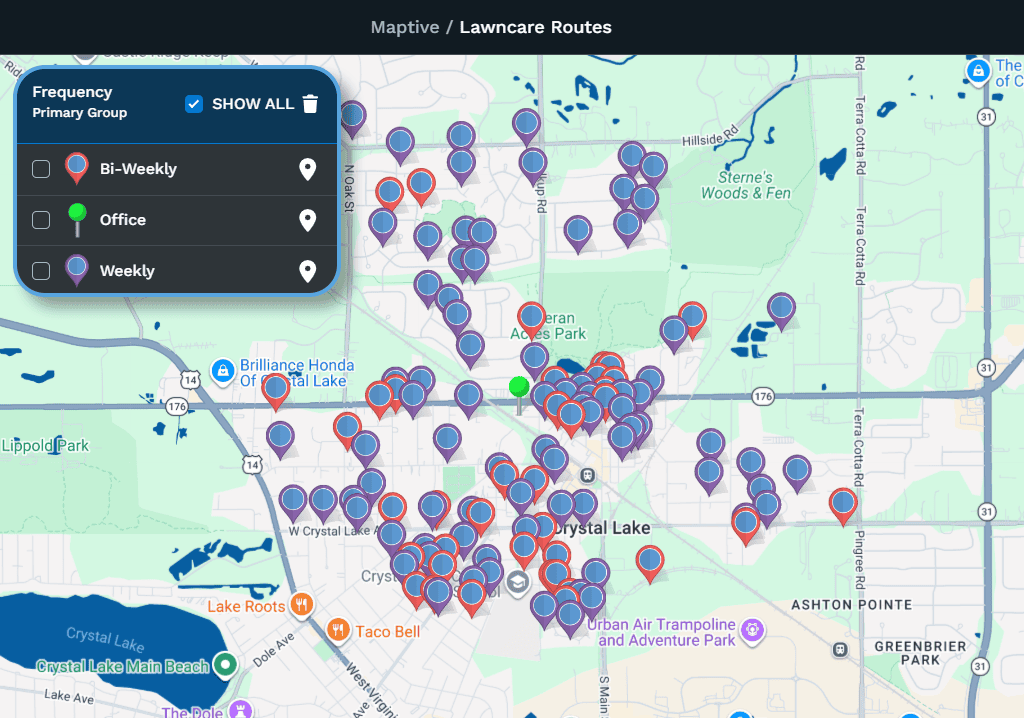
First, I color the pins based on how often the company is contracted to mow each customer’s lawn. I do this by selecting the Frequency column in the grouping tool.
This company has weekly and biweekly customers, but you can use any categories in your data. You could group customers by their level of service or by the crew assigned to them. You can also color markers by a numeric range, such as lawn size in square feet.
For this map, I select the Frequency column. The colors show which customers receive weekly or biweekly service and where the office is. Clicking an entry in the legend also filters the data.
Display Estimated Cut Times Inside Markers
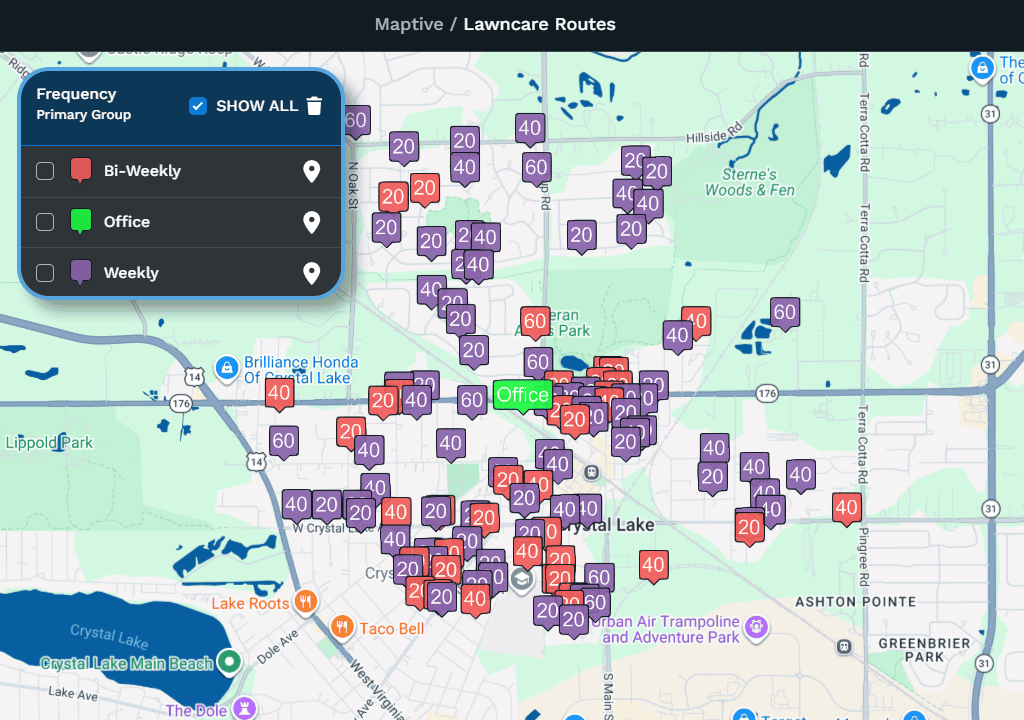
Next, I display the estimated cut time inside each marker to help create routes with 500 to 550 minutes of mowing. Adding travel time helps estimate how much of a 9- to 10-hour workday each route will require.
To do this, I open Map Settings, select “Map Markers / Graphics,” and turn on “Labels inside markers.” I then choose the Cut Time column. The estimated cut time from the spreadsheet now appears inside each marker.
Draw a Territory & Summarize the Data
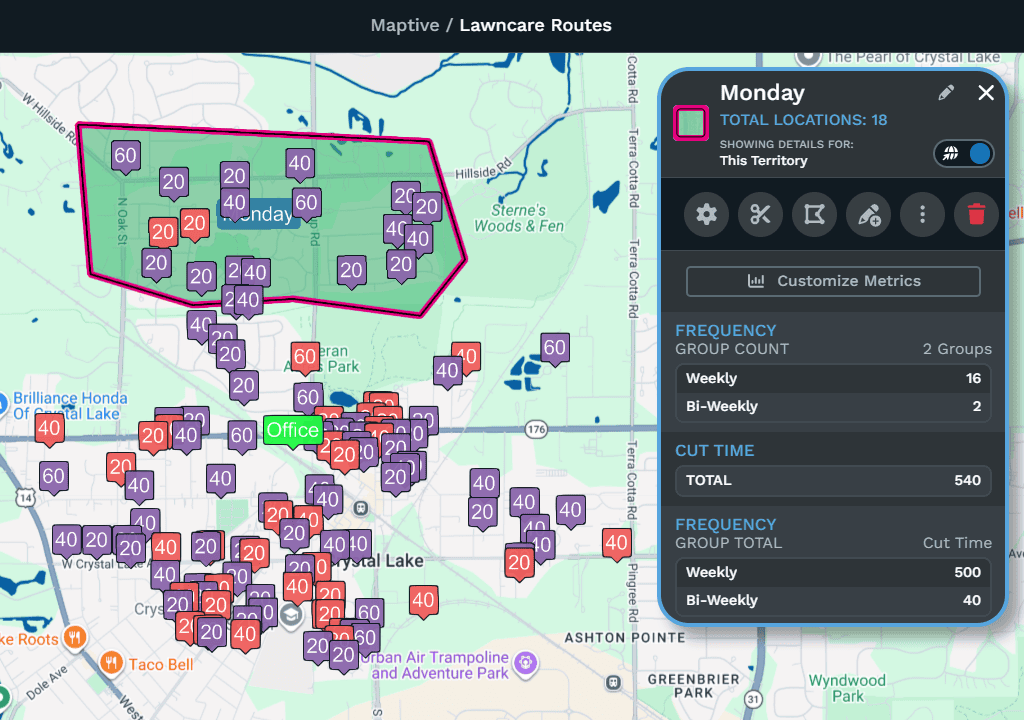
Using the territory tool, I draw an area around a group of markers that could make a suitable route. The territory metrics show 16 weekly customers with a total cut time of 500 minutes. The 2 biweekly customers add another 40 minutes.
From this territory, I create Monday A and Monday B routes. Both include the weekly customers, while each includes one of the biweekly customers. Each version of the Monday route therefore has 520 minutes of estimated cut time.
Edit Data Within the Territory
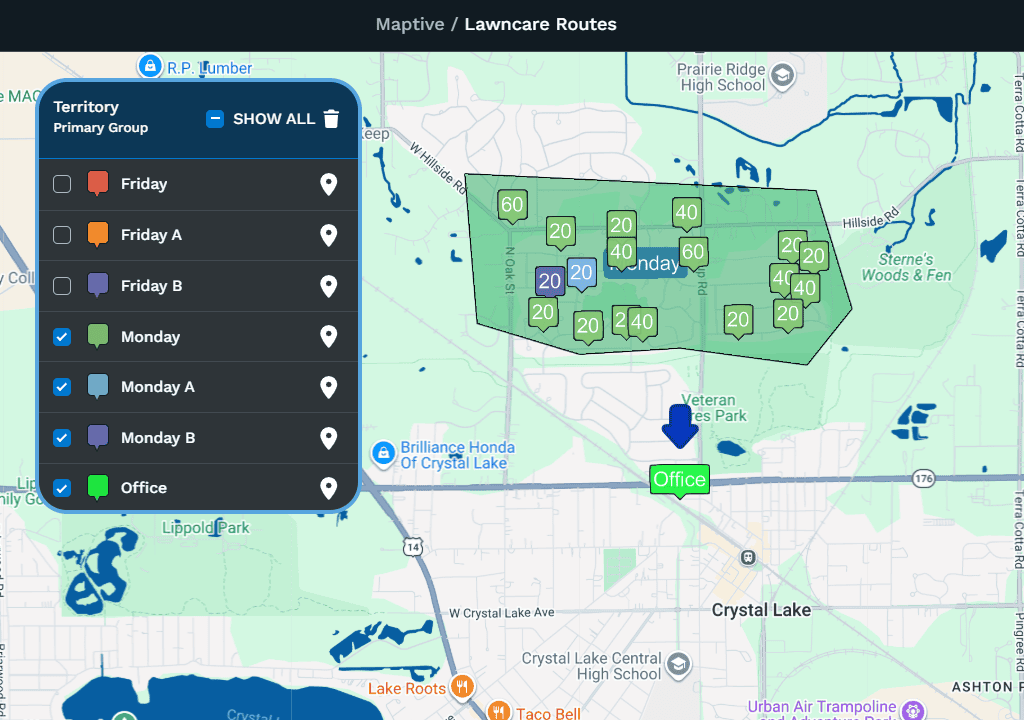
In the spreadsheet, I have left an empty column called Territory. In the Monday territory, I open the three-dot menu and choose “Batch Edit Locations.” In the pop-up window, I find the Territory column and enter “Monday.” This updates the Territory value for all rows currently displayed within the territory.
I then edit the 2 biweekly customers individually. I click each marker and change its Territory value to “Monday A” for one and “Monday B” for the other.
Create & Optimize the Route
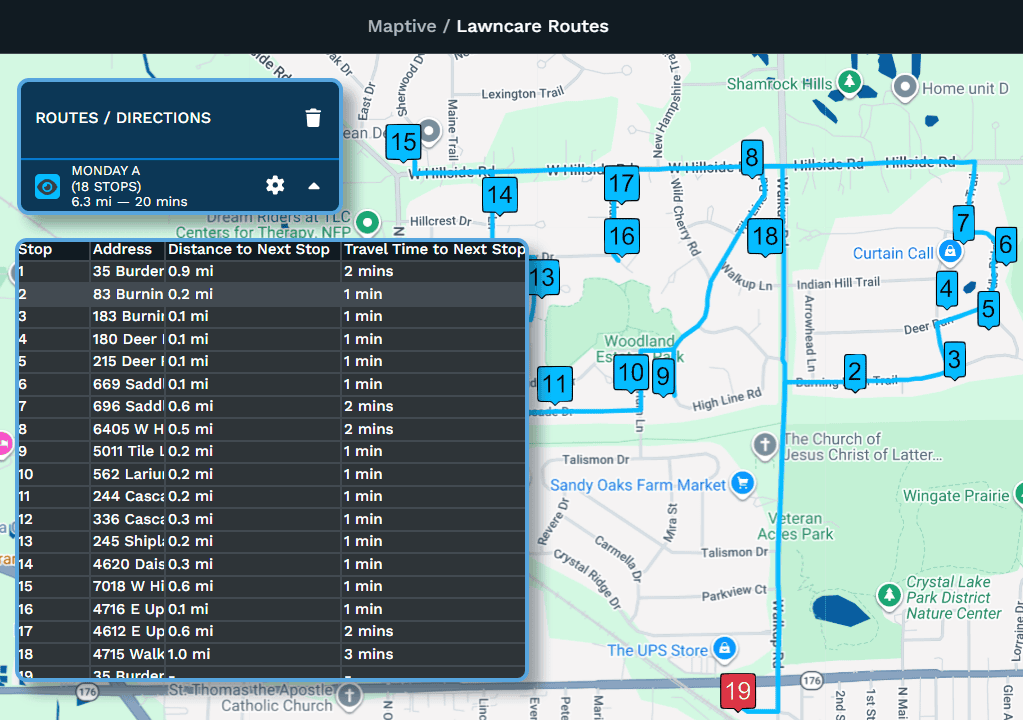
To plan the order of visits, I use the Routing and Directions Tool. I start by clicking the Office marker and using the tools menu on the right to add it to the route.
In the grouping tool, I select the Monday and Monday A entries. I then click the territory and select “Optimize Driving Route” from the menu on the right. This adds the visible markers to the routing tool.
I add the office again as the final stop because the crew starts and finishes there. During optimization, the starting and ending locations stay fixed. Clicking “Optimize Route” reorders the stops to reduce driving time and distance.
After optimizing, I can export the route’s locations with their stop order, distance to the next stop, and travel time to the next stop.
Filter Customers Before Creating a Route
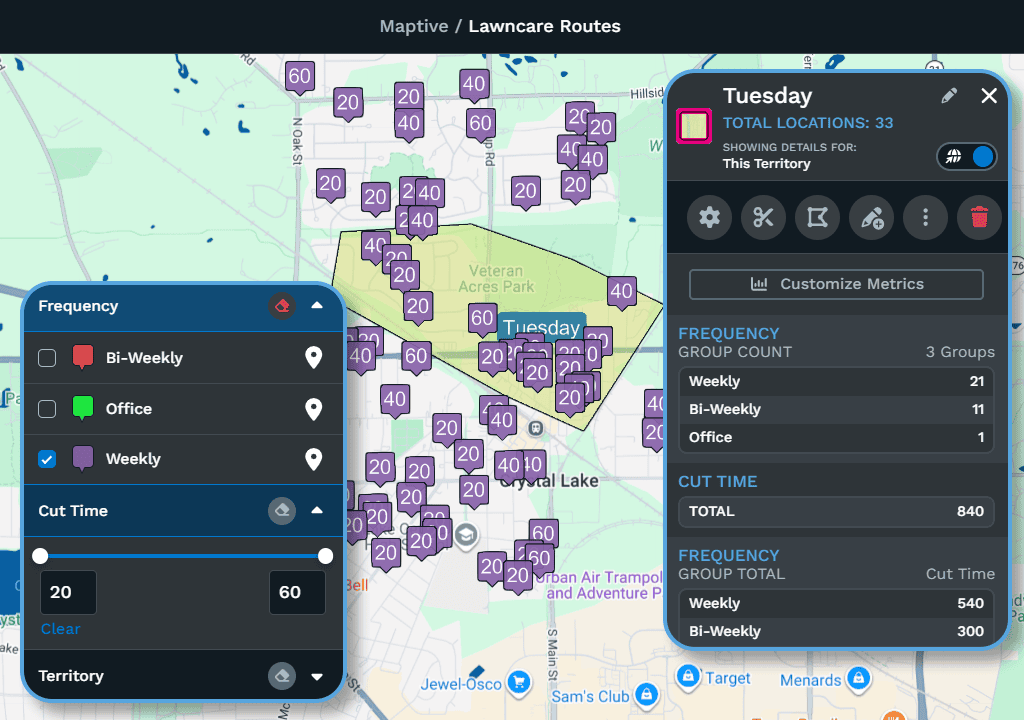
The Monday A route includes both weekly and biweekly customers. The Tuesday territory has 21 weekly customers with 540 minutes of cut time, leaving insufficient time to include all its biweekly customers on the same route.
Using the Filter Tool, I select “Weekly” to hide the other customers. I then follow the same batch-editing steps to assign the weekly customers to the Tuesday route.
After creating routes for all weekly customers, I find the markers without an assigned territory and create additional routes for the remaining biweekly customers. I could also filter by other columns, such as territory or estimated cut time.
Review the Final Data & Routes
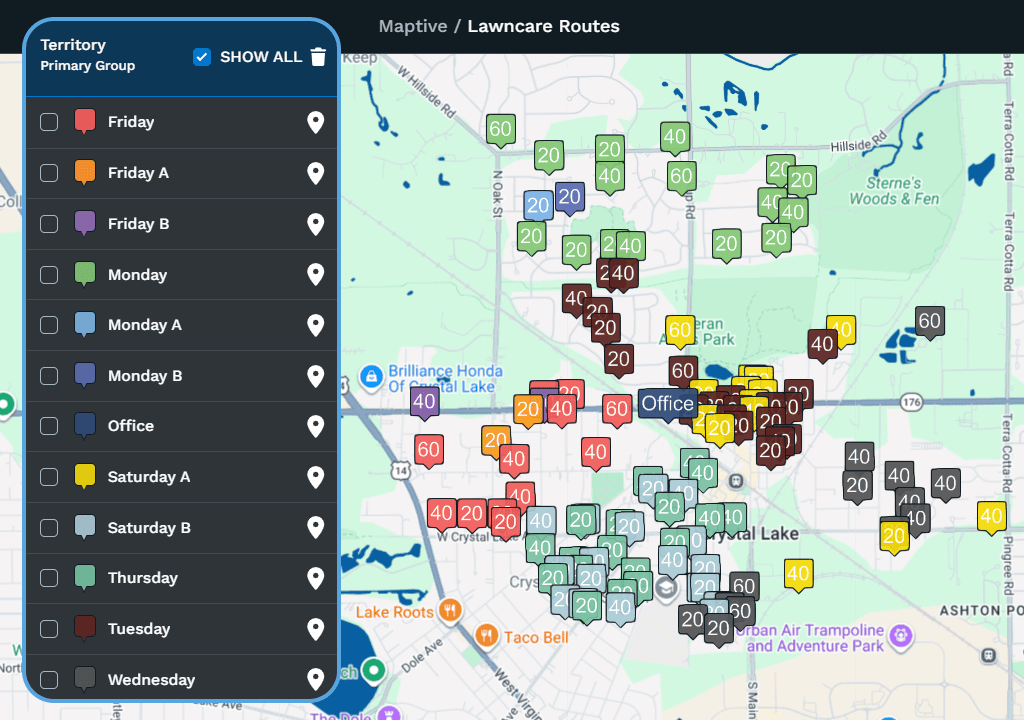
Once all markers are assigned, the spreadsheet contains a territory or route for every customer. The grouping tool colors the markers by route, making it easier to review the assignments.
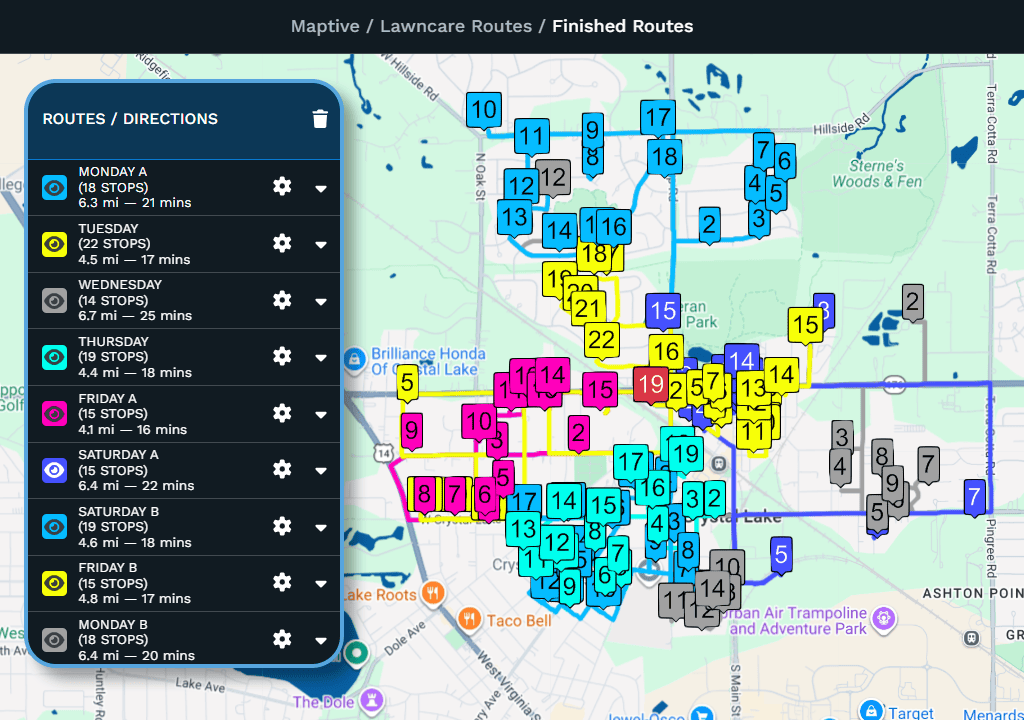
The completed routes show the order in which to visit each customer. Clicking “Export to File” provides a list of locations with the route name and stop order. You can give this list to your crew so they can follow the planned route.
Estimate Yard Size
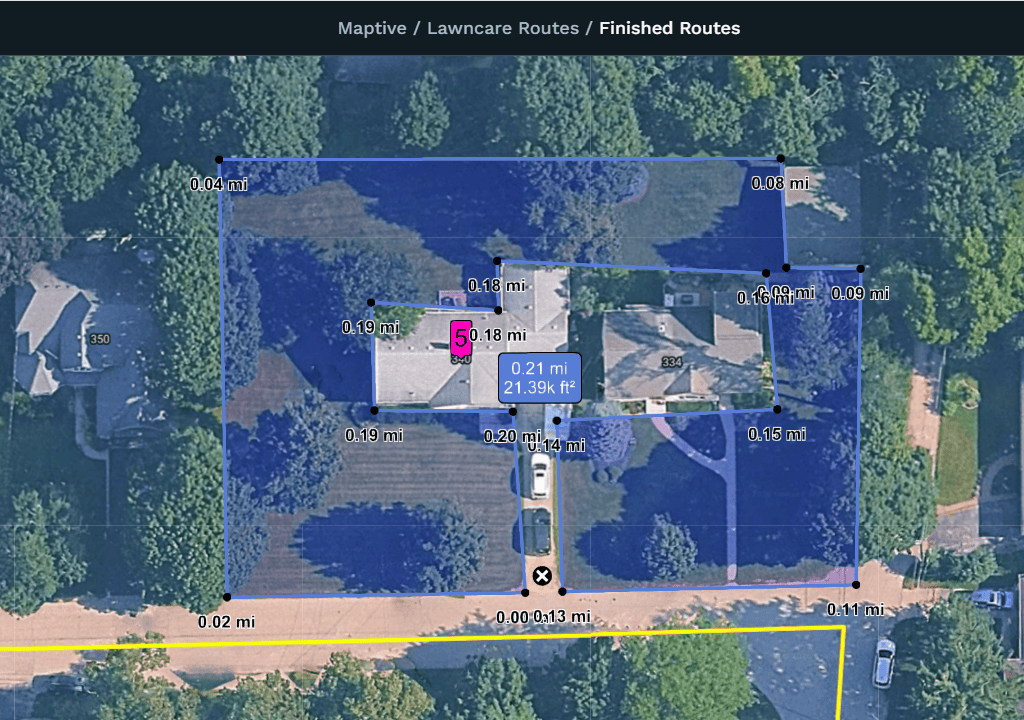
Using the distance calculator, you can draw around a lawn to estimate its area in square feet. This can help you prepare a bid for a new property and estimate how long the job will take.