

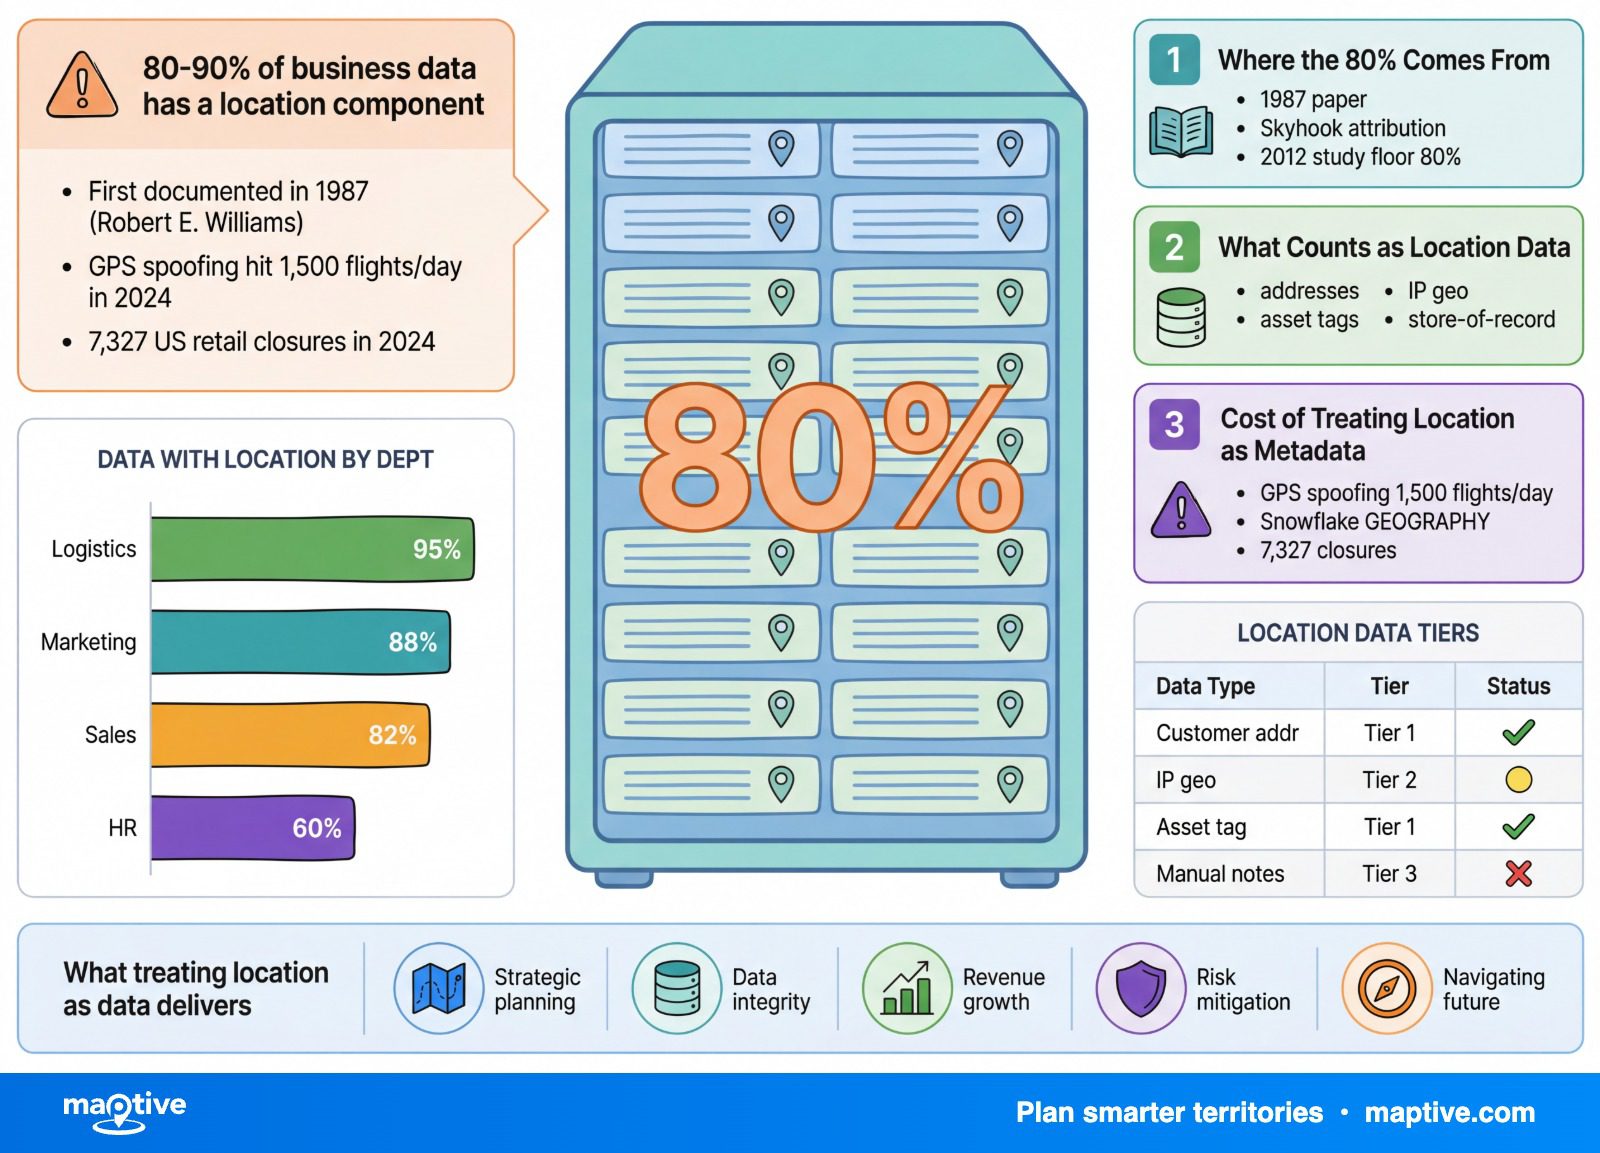
The widely repeated claim that 80% or 90% of business data contains a location component has a real lineage, though the precise number is debated. The earliest documented version comes from a 1987 article by Robert E. Williams, who directed the Alachua County Regional Information Center and argued that 80% of the informational needs of local government policymakers were tied to geographic location. A 2012 study published in the International Journal of Geographical Information Science tested a version of the claim against German Wikipedia and found that 78% of articles were either tagged with coordinates or linked to an article that was.
The figure is more defensible than the marketing slogan suggests, even if the precise number is debated. The 90% version circulating in trade press is rhetorical inflation. The 80% version has at least three independent supporting threads, including the 2012 empirical test and modern restatements from data vendors.
The same body of industry commentary adds a sharper observation. Roughly 80% of business data has a location component, while only about 10% of it is currently used to inform decisions. That gap is the subject of this piece.
Where the 80% Figure Comes From
Williams was writing for an audience of county and municipal officials being asked to fund early geographic information systems. His 80% estimate was an argument for that investment. He did not present a controlled study, and no one since has produced a precise replacement number that holds across industries.
A later attribution credits Bill Hewitt, the former Skyhook chief executive, with popularizing “80% of business data has a location component” during industry talks in the 2010s. The line has reached folkloric status in the geospatial sector. A primary source for the exact quote is hard to surface. Treat the Skyhook attribution as popularization rather than origin.
The 2012 study took the claim seriously enough to test it. Researchers analyzed the German edition of Wikipedia using a network approach and found 78% of articles were either tagged with geographic coordinates or one link away from an article that was. The result lines up with the verbal estimate to within two points. That is the strongest empirical anchor the 80% number has.
The 90% framing that appears in headlines, including the one above, is best read as a rhetorical ceiling rather than a measurement. The defensible floor is 80%. Even at the lower bound, the implication for business analytics is the same. Most operational records carry a geographic attribute that most companies never analyze spatially.
What Counts as Location Data Inside a Business
The catalog below is not exotic. Each category sits inside systems that most organizations already operate. The open question in every case is the same one. Has the address or coordinate field been geocoded and joined to anything else, or is it sitting in a text column that no one queries.
Customer records
Customer files carry billing addresses, shipping addresses, service addresses, and ZIP codes. In a CRM, those fields are stored as text. With geocoding, they become latitude and longitude pairs that can be clustered, mapped against drive-time isochrones, or joined against demographic layers.
Sales transactions
Every point-of-sale terminal has a physical coordinate. Every online checkout has an IP-derived geography and a fulfillment origin and destination. Returns carry a location of their own. Revenue analyses that ignore this dimension miss the geographic distribution of demand and the trade-area boundaries that determine where margin comes from.
Supply chain
Suppliers, plants, warehouses, distribution centers, ports, and last-mile zones are nodes on a map before they are line items in a procurement system. Connecting them spatially is what makes routing, inventory balancing, and disruption response possible. Only 6% of businesses report full supply-chain visibility, leaving most of the network unmapped.
HR data
Workforce records include home addresses, office locations, and increasingly, remote work designations. Commute analysis, relocation planning, and labor-market analysis all draw on this dataset. So does any honest read on where a company’s people actually live.
Marketing and CRM
Marketing platforms hold campaign geo-targets, geo-fenced ad delivery zones, and store-locator queries. Customer acquisition cost varies by region. So does response rate. CRM accounts have headquarters addresses, branch addresses, and customer site-visit logs. Aggregated, these produce a coverage map of where the business is winning and where it is not.
IoT and sensor telemetry
Connected IoT devices reached 18.5 billion in 2024, a 12% year-over-year rise. Most of them report telemetry tied to a physical sensor or device location. Fleet vehicles, agricultural equipment, manufacturing line sensors, smart-meter readings, and asset trackers all generate location-stamped data continuously.
Service tickets and field operations
Field service systems log addresses for every dispatch. Technician routing depends on those addresses. So does first-time fix-rate analysis, parts-stocking, and crew sizing. The records exist in every service-management platform. The question of joining them to performance metrics is a separate problem, and one that most service operations have not solved at any scale.
Mobile and web analytics
Mobile applications generate GPS coordinates, beacon proximity reads, and session-level geographies. Web analytics platforms attach IP-derived city and country to every visit. Personalization, ad measurement, and compliance enforcement all draw on this layer.
Finance and fraud signals
Transaction-origin coordinates, merchant locations, ATM positions, and card-present geometries are recorded by default on most payment rails. They power impossible-travel checks, billing-and-shipping mismatch flags, and geographic risk scoring. Many businesses lose 4% to 5% of revenue to fraud. Geographic anomaly detection is one of the higher-yield controls available.
Real estate and physical assets
Every parcel, lease, building, and physical asset is bound to a coordinate. Insurance policies attach to property addresses. Property taxes attach to parcels. Asset management systems map fixed equipment to floor plans. The location field is not optional in any of these systems.
The volume of location data inside a typical company is not the question. The real question concerns the state of the address fields themselves. Have they been geocoded, joined, and made available to the analysts who already work with the surrounding data, or do they sit in unconverted text columns that no spatial tool can read directly.
The Cost of Treating Location as Metadata
A 2024 survey put data silos at the top of business data concerns, with 68% of respondents citing the issue, an increase of seven percentage points year over year. Employees spend roughly 30% of their weekly work hours chasing data across disconnected systems. Among US respondents in a separate 2025 analysis, 37% cited low-quality address data as a top inhibitor of location analytics.
The first cost is missed customer clusters. Without geocoded customer data joined to a map, dense pockets of demand stay invisible and territory design stays unbalanced. Sales coverage gets allocated by population estimates or by historical lines rather than by where actual customers are.
The second cost lands in site selection. US retail closures reached 7,327 stores in 2024, a record. Some closures were structural. Many reflected sites that should never have opened. Site planning informed by location intelligence has been measured at 17% improvement in store-level ROI and an 18% average sales increase. The penalty for skipping that work is paid at lease termination, not at lease signing.
The third cost is fraud. Geographic anomaly detection catches a meaningful portion of revenue leakage, including impossible-travel patterns and billing-shipping mismatches. The threat is also evolving. GPS spoofing affected an average of 1,500 flights per day during summer 2024, a 500% jump versus 2023. The same vector reaches commercial telematics and high-value logistics.
The fourth cost is supply chain inefficiency. With 6% of businesses reporting full visibility, the rest operate with blind spots that translate directly into excess inventory, longer delivery times, and reactive disruption response. Operations that have built location-aware visibility report 15% lower logistics costs, 35% lower inventory levels, and 65% improvement in service efficiency.
The technical excuse for skipping this work is gone. Snowflake added native GEOGRAPHY and GEOMETRY data types and 60-plus spatial SQL functions, including 19 native H3 functions added across 2023 and 2024. Databricks added native H3 support beginning with DBR 17. Google BigQuery uses an S2 spatial index with a comprehensive ST_* function library. PostGIS remains the open-source standard and is OGC-compliant. Spatial analysis no longer requires a separate GIS environment. It runs inside the same warehouses and BI tools that analysts already use.
The bottleneck is organizational. Address fields live in CRM, ERP, marketing, and field-service systems that rarely share keys. Analysts trained on time-series and categorical methods have not been trained on spatial joins, distance calculations, or polygon containment. The map is treated as a presentation output rather than as an analytic dimension. None of this requires new infrastructure to fix. It requires deciding that the location field is an attribute worth modeling.
The 80% figure is, in the end, a useful provocation. The exact number is less important than the structural truth behind it. Most business records have a geographic anchor. Most companies analyze around it rather than through it. The companies that close that gap will see operational patterns the rest of the market cannot.
Frequently Asked Questions
What percentage of business data has a location component?
The most widely cited figure is 80%. The estimate traces back to a 1987 paper by Robert E. Williams, and a 2012 study published in the International Journal of Geographical Information Science empirically tested it against German Wikipedia and found 78% of articles either tagged with coordinates or linked to articles that were. Some trade press inflates the figure to 90%. The 80% number is the most defensible.
Where did the “80% of data is geographic” statistic come from?
The earliest documented use is a 1987 article by Robert E. Williams, then Director of the Alachua County Regional Information Center, writing about government information needs. The phrase has reached folkloric status in the geospatial industry. No single modern primary source has replaced it with a precise updated number.
What is location data?
Location data is geographic information about where an object, person, event, or transaction is on Earth. It is usually expressed as an address, ZIP code, latitude and longitude pair, or geofence. Examples include GPS coordinates, geocoded street addresses, IP-derived city locations, point-of-interest data, and real-time mobile-device positions.
What is geospatial data?
Geospatial data is any dataset that includes information tied to a specific location on the Earth’s surface. It combines a location identifier such as latitude and longitude, an address, a parcel ID, or a ZIP code with descriptive attributes. A customer record with a billing address is geospatial. So is a sensor reading paired with a GPS coordinate.
What are examples of location data in business?
Customer billing and shipping addresses, point-of-sale terminal locations, IP geolocation on website visits, branch and store locations, warehouse and supplier coordinates, delivery routes, service-call addresses, IoT sensor positions, employee home addresses, GPS pings from fleet vehicles, mobile-app session locations, and real estate parcels. Virtually every operational dataset has at least one location field.
What is geocoding?
Geocoding is the process of converting a street address into latitude and longitude coordinates that can be plotted on a map and joined with other geographic datasets. It is the bridge between text-based address data stored in CRM, ERP, or billing systems and spatial analysis. Common providers include the US Census TIGER files, the USPS address standardization layer, Google, and various commercial geocoding services that return parcel- or rooftop-level coordinates.
How accurate is geocoding?
Accuracy varies widely. A 2024 peer-reviewed comparison found that one major commercial geocoder matched 97.7% of Wisconsin addresses to a street-level latitude and longitude pair. A separate 2024 analysis found that some leading geocoders match building-level points correctly less than 60% of the time, with five different services producing drastically different results for the same address. Rooftop and parcel-centroid geocoders are the most precise. Census street-range interpolation is the least precise.
What is location intelligence?
Location intelligence is the practice of deriving business insights from geospatial data, usually by mapping data and analyzing spatial relationships such as proximity, clusters, drive times, and catchment areas. It packages spatial analysis for business analysts and executives rather than for technical specialists. The global market was estimated at $21.21 billion in 2024.
What is the difference between location intelligence and GIS?
A GIS, or geographic information system, is the underlying technology used by specialists such as geographers, planners, and technicians to create and manage spatial data. Location intelligence sits on top of GIS data and packages spatial analysis for non-technical business users in marketing, operations, and strategy. The GIS is the raw material. Location intelligence is the finished insight.
Why don’t companies use the location data they have?
A combination of organizational and technical reasons. 68% of businesses cite data silos as their top data concern in 2024, and 37% of US respondents say low-quality address data inhibits location use. Many analysts are trained on time-series and categorical methods rather than spatial ones. Address fields often live in different systems that never share keys, and until recently spatial analysis required specialist GIS tools rather than the SQL and BI stack analysts already know.
What is spatial SQL?
Spatial SQL is SQL extended with geometry and geography data types and spatial functions such as distance, intersection, buffer, contains, and within. PostGIS is the open-source standard. Snowflake, Google BigQuery, and Databricks all support spatial SQL natively as of 2024, letting analysts run geographic queries inside the data warehouse instead of a separate GIS tool.
How does location data help detect fraud?
Location data allows fraud systems to compare a transaction’s claimed location with the cardholder’s recent activity, flag impossible-travel patterns such as a login in New York followed minutes later by a transaction in Singapore, and identify high-risk geographies. Many businesses lose 4% to 5% of revenue to fraud, and geographic anomaly detection is among the higher-ROI controls. GPS spoofing also surged in 2024, with an average of 1,500 flights per day affected during the summer.


