


Color-Coded Franchise Units by Status, Brand & Type
Identical pins hide which units are open, which are only signed, and each unit's brand. Maptive colors every marker by a data column so status reads at a glance.
No credit card required
- Color every marker by a status, brand, or type column
- Plot up to 200,000 units on one colored map
- Upload a brand logo as the custom marker for each banner
- Toggle any legend entry to isolate one status or brand
- Open a marker pop-up to read owner, open date, or lease status
- Share the map as a link with view-only or edit access
Trusted by teams at









The Case for a Color-Coded Network Map
Coloring pins by status lets teams read open, signed, and planned units 42% faster than a plain map.
Driving color from a data column cuts miscounted-unit errors in status reports by 25%.
A single colored map trims the time to prepare a network status update by about 30%.
The Setup Behind a Status Map
Point the Grouping Tool at a column, color one marker per value, and read the network by status, brand, or type.
| 01 |
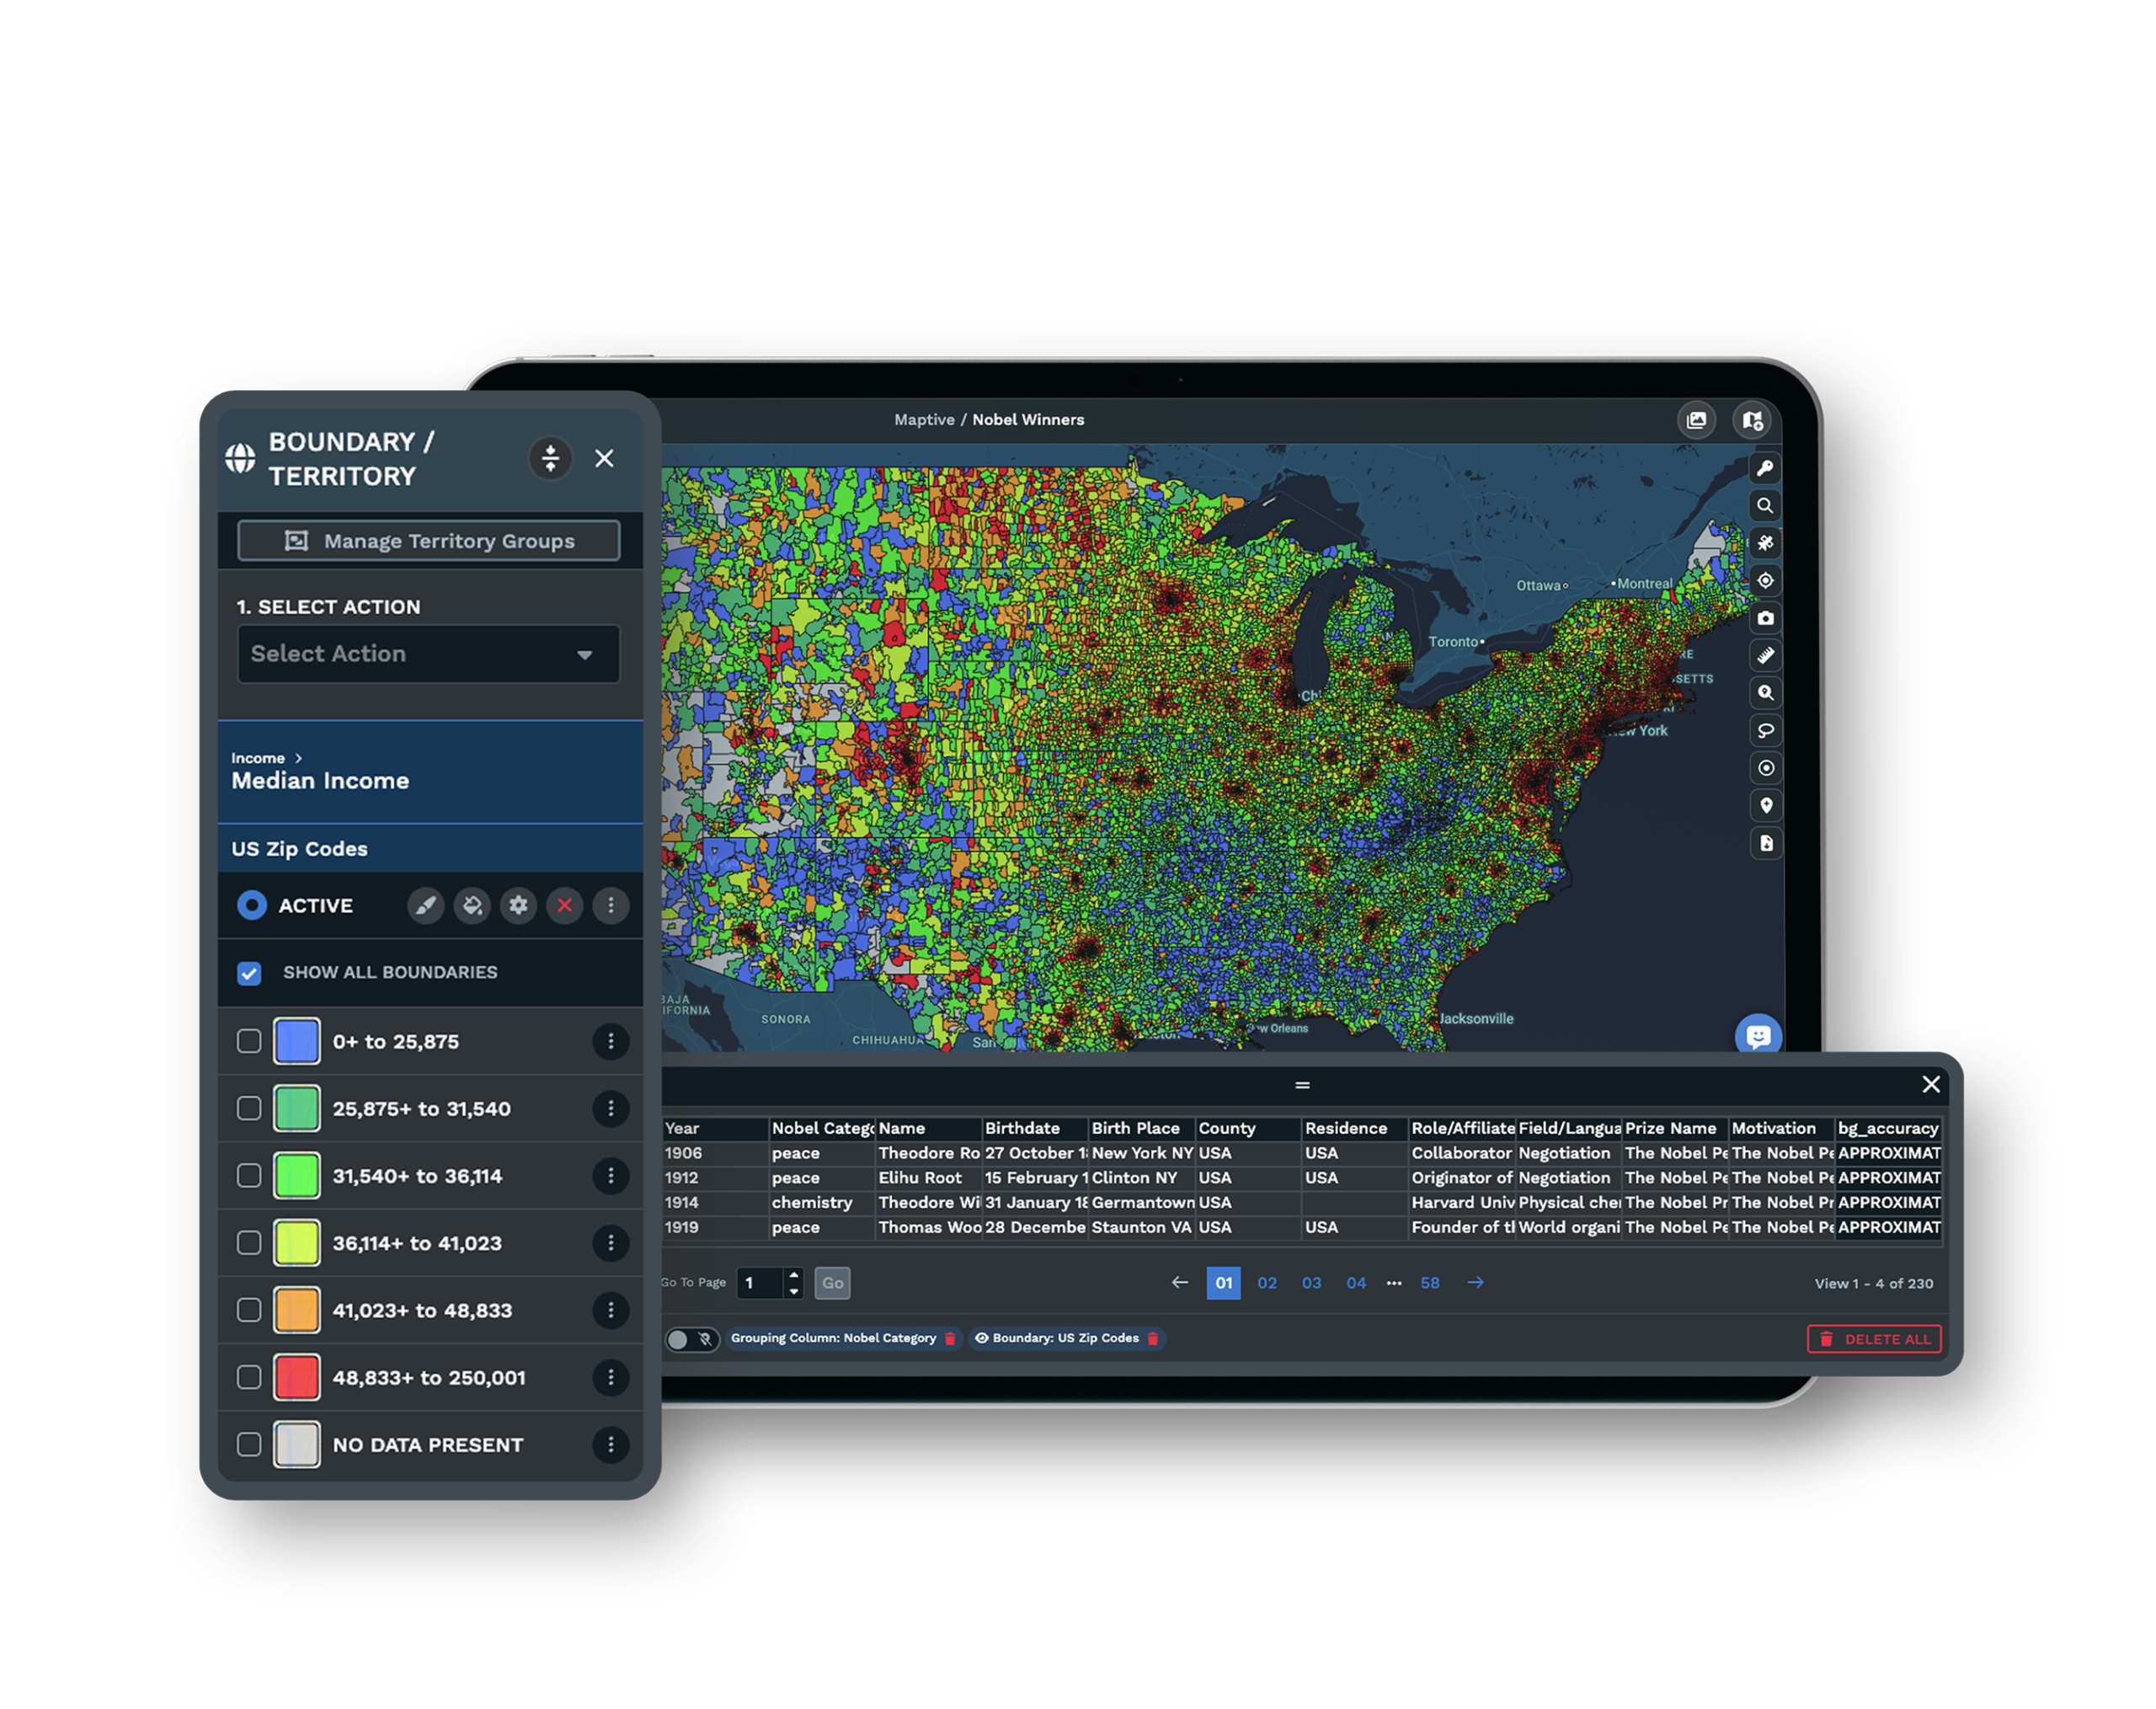
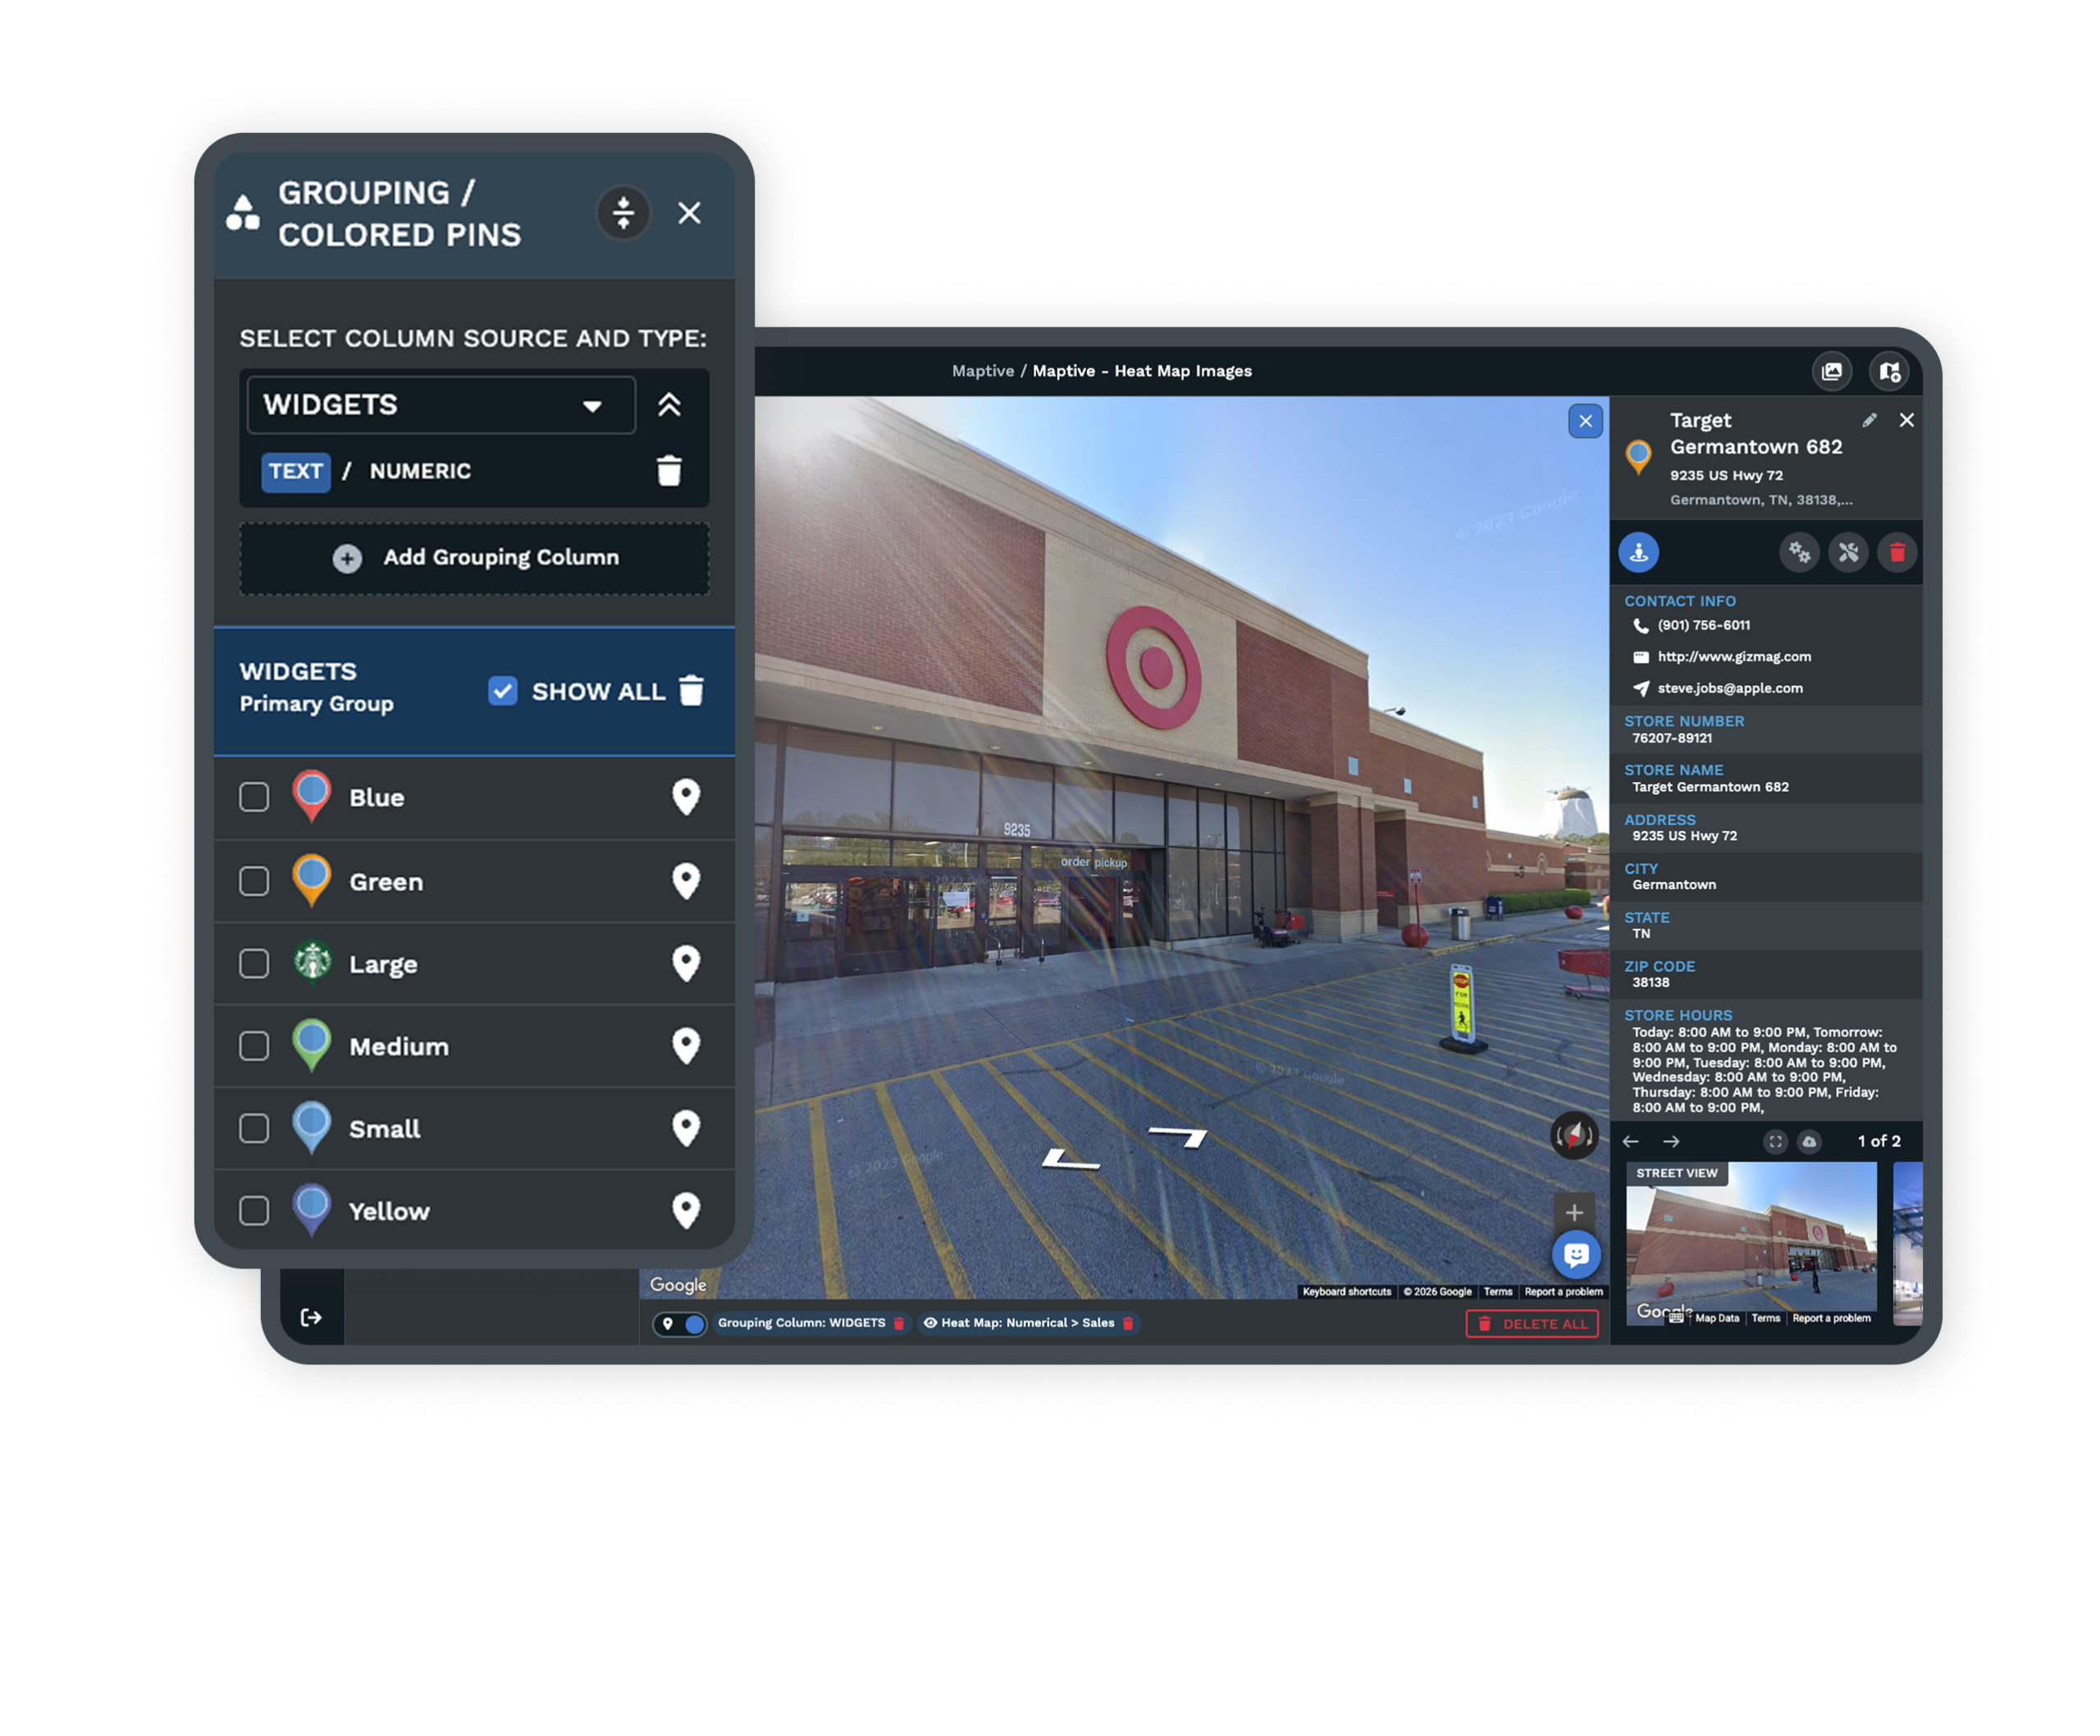
One Color Per Value From a ColumnPoint the Grouping Tool at a column in your uploaded spreadsheet, and it finds each unique value, drops a colored pin for every row, and builds a legend beneath the map. A status column holding signed, open, in-construction, and terminated becomes one color per stage. Explore the grouping tool → |
| 02 |
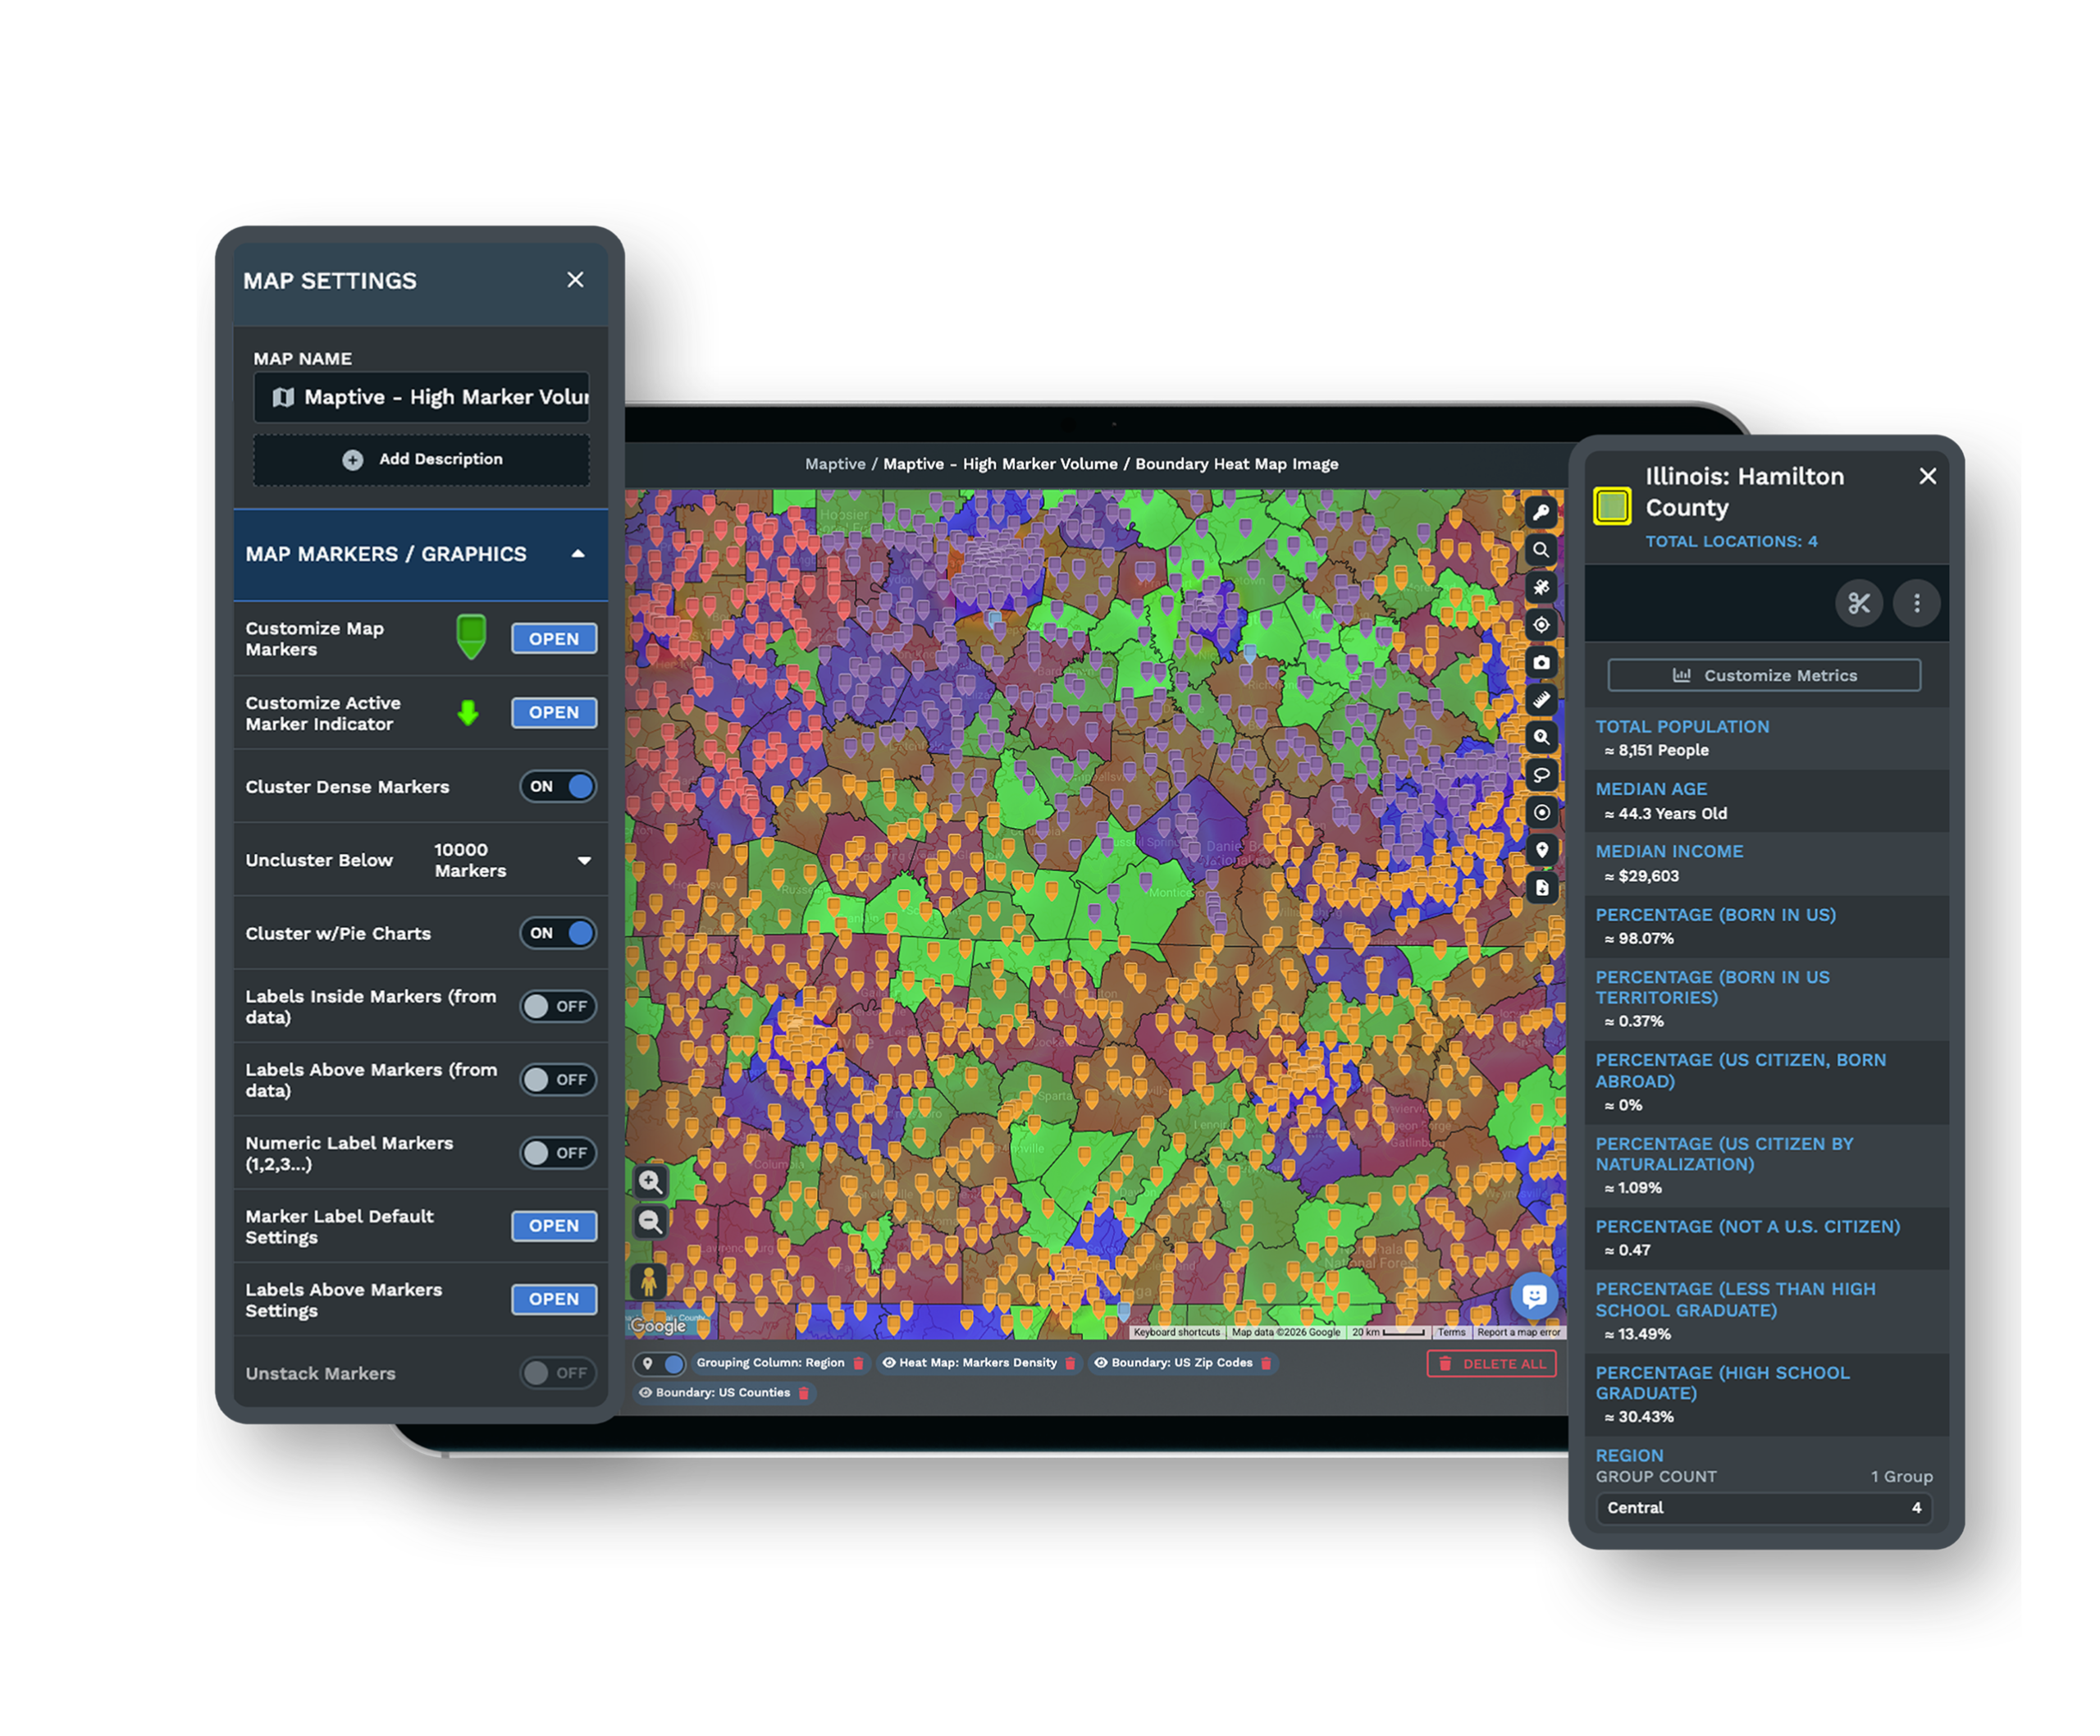
Brand Logos as Custom MarkersUpload a custom marker for each banner so a location carries its brand logo instead of a generic dot. Bold, simple logos saved as transparent images stay legible at pin size, which keeps a multi-brand map readable rather than crowded. Explore custom markers → |
| 03 |
A Legend and Filter in OneEach legend entry acts as a toggle, so a click isolates a single group. Show only the signed-not-open units, only this quarter's closures, or one brand across the map, without editing the underlying data or building a second map. See data filtering → |
| 04 |
Marker Pop-Ups Behind Every PinClick any marker to open its pop-up and read the fields you choose to show, such as owner, open date, or lease status. The color tells the room the category, and the pop-up holds the detail for the person who asks about one unit. |
The Difference Between Open and Merely Signed
A development team watches one number more closely than any other, the gap between units sold and units operating. On a map of identical pins that gap disappears, because a signed-not-open location looks the same as one serving customers. Color the markers by a status column and the two separate on sight.
The FDD already gives you the vocabulary, since Item 20 tracks opened, signed-not-open, terminated, non-renewed, reacquired, and ceased as distinct outlet states. Feed those same values into the Grouping Tool and the report your franchisor already files becomes a map the whole room reads the same way.
Coloring by Ownership, Format, or Territory Status
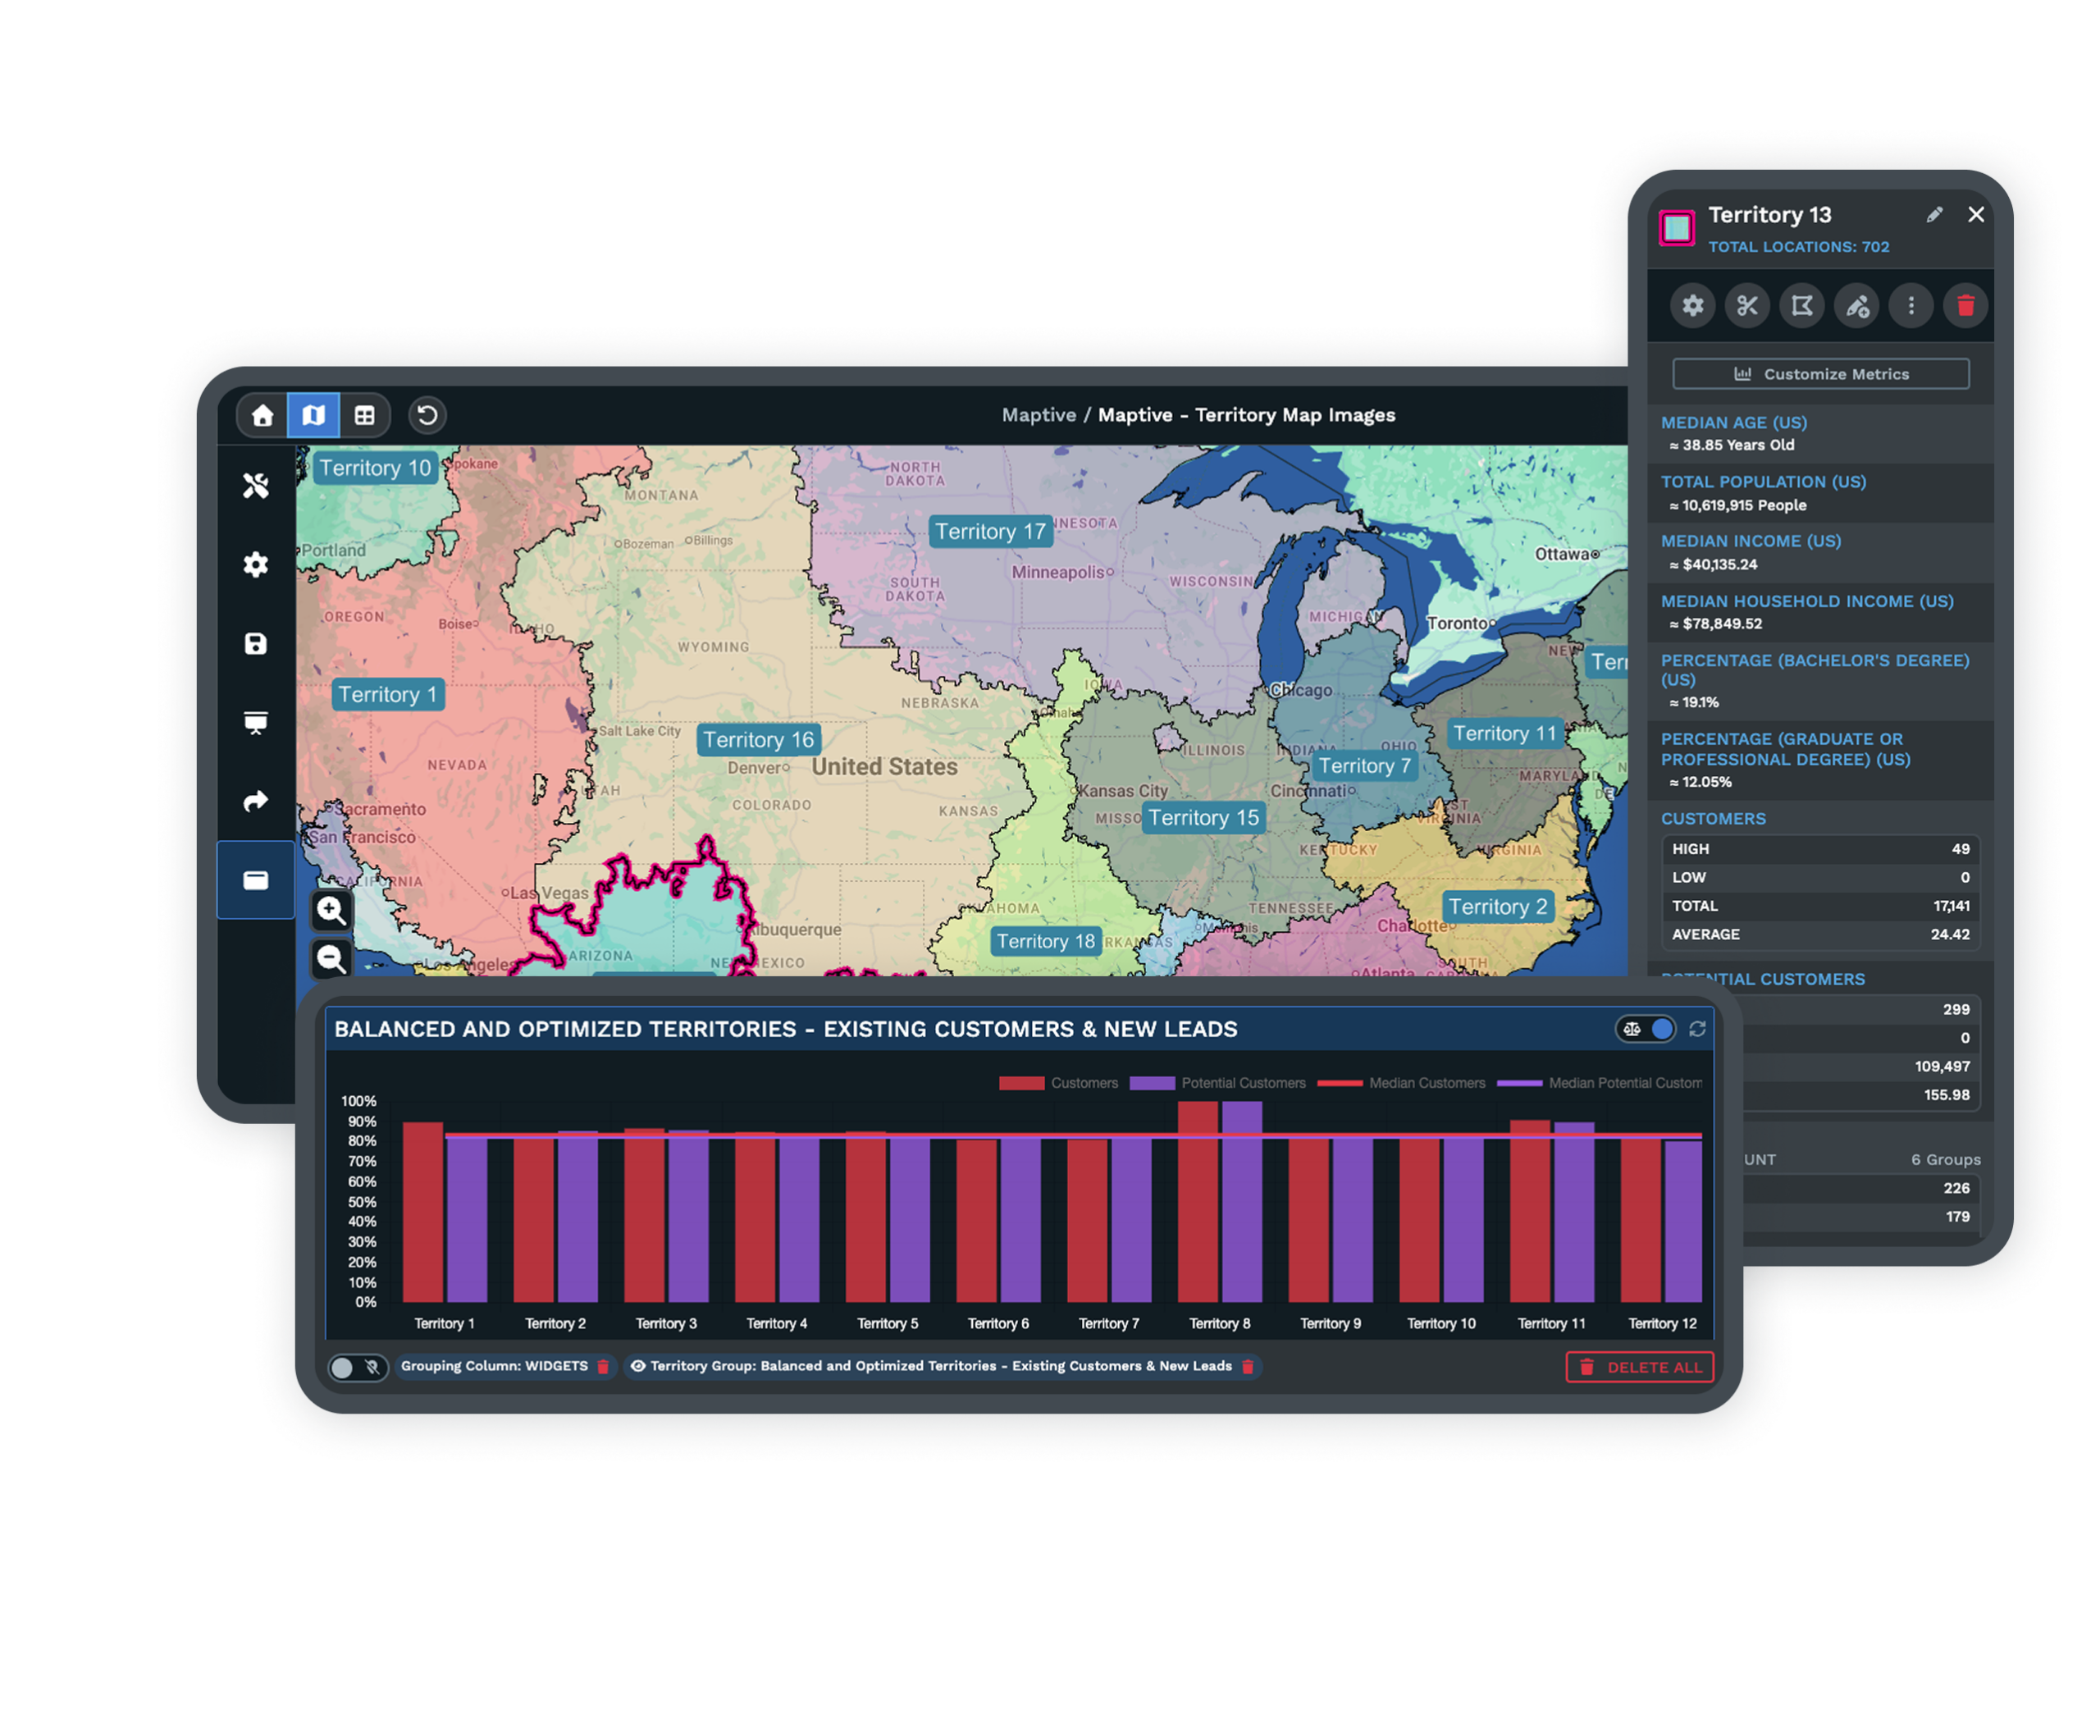
Status is one axis, and type is the next. Color markers by an ownership column to separate company-owned units from franchised ones, the same split the disclosure document already reports in two tables. The same method sorts a network by format, with full stores, express counters, and drive-thru-only sites each taking a hue.
Territory availability colors cleanly too, one shade for open markets and another for reserved or awarded ones, updated as a market moves from available to under offer. The choice of column decides what the map explains.
Working With a Colored Map Your Team Trusts
A Color-Blind-Safe Palette
Red and green alone fail for roughly eight percent of male viewers, so lean away from the traffic-light pairing. A blue-orange scheme and other high-contrast hues stay distinct across common color-vision differences, and pairing each color with a plain label keeps the legend readable when hue alone would not.
One Consistent Color Scheme
Share a color-coded map as a link with view-only or edit permission for each person you invite, so leadership sees the filterable status picture and no one edits the source by accident. Hold one scheme across every map the team opens, so a status color means the same thing in every review.
Security for a Live Map File
The platform runs on 256-bit SSL encryption, two-factor authentication, single sign-on, role-based access, and audit logging, and it passed the Salesforce AppExchange security review. A US and Canada support team answers in under 15 minutes at a 9.7 out of 10 rating when a map question comes up mid-review.
Free trial with the full platform and no credit card
Color-Code Your Network Free
Start a 10-day free trial with no credit card and every tool unlocked. Upload your unit list, group the markers by a status, brand, or type column, watch one color land per value, and toggle the legend to isolate the signed-not-open units, all on your real footprint.
Bring Your Status List to a Live Session
If a board review or a development committee runs on your numbers, a Maptive specialist will color your network with you. Bring the spreadsheet you already keep, and the session turns your status column into a filterable map in front of the people who read it.
Frequently Asked Questions
How do I color-code franchise locations by status?
Put the status in a column of your location spreadsheet, using values such as signed, open, in-construction, terminated, or in-review, then group the map markers by that column. The Grouping Tool assigns one color per status and builds a filterable legend. These match the outlet-status categories a franchisor already reports in FDD Item 20.
Can I use brand logos as map pins?
Yes. Upload a custom marker for each brand or banner, such as its logo, so a multi-brand portfolio shows every brand's identity on one map. Use bold, simple logos saved as transparent images, because markers are small and a detailed logo loses legibility at that size.
How do I color-code locations on a map from a spreadsheet?
Upload the spreadsheet, choose the column to group by, and the tool finds each unique value in that column and drops a colored marker for every row, one color per value. Add a state or province column if town names are ambiguous, or some markers may not place correctly.
Can I show open versus upcoming franchise units in different colors?
Yes. Hold a status column with values such as open, signed-not-open, and under-construction, then color the markers by that column so operating units and pipeline units read as separate colors. Signed-not-open is its own tracked state in the FDD's projected-openings table.
How do I map a multi-brand franchise portfolio on one map?
Tag every location with its brand, then assign each brand a distinct marker color or a custom logo image, one rule per brand. The legend separates each banner on a single map, and the same structure holds as you add banners to the portfolio.
Can I filter a franchise map to show only certain statuses?
Yes. In a grouped-marker map the legend entries work as toggles, so a click shows or hides only that group. You can isolate only the closures, only the signed-not-open units, or a single brand across the whole map without building a second version.
How do I tell company-owned units apart from franchised ones on a map?
Color the markers by an ownership-type column, since company-owned versus franchised is a built-in split a franchisor already reports in separate FDD outlet tables. The same approach handles format types such as full store, express, kiosk, or drive-thru-only.
How many colors should a franchise status legend have?
Keep a categorical legend to about five to seven colors, since human vision reliably separates roughly six to eight and matching colors to a legend gets hard past eight to ten. If you track more categories than that, lean on labels and legend filtering rather than adding more hues.
Can I share a color-coded franchise map with leadership?
Yes. Share the map as a link with viewer-permission controls, so leadership sees the colored, filterable status picture without editing the data.








