

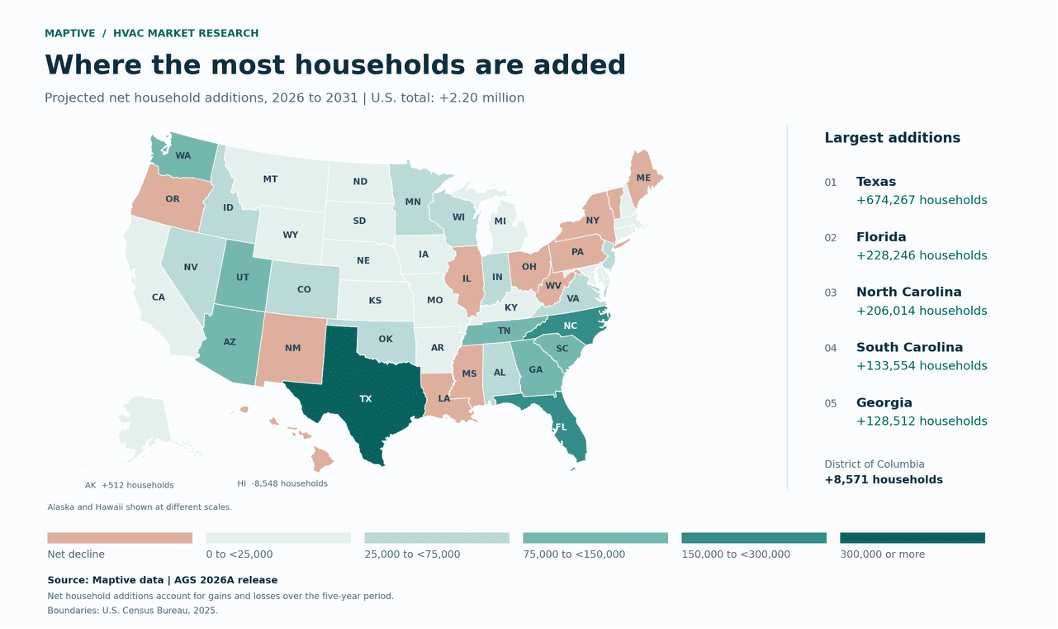
HVAC businesses comparing expansion markets should look closely at Utah, Idaho, South Carolina, Texas and North Carolina. These states lead projected household growth from 2026 to 2031 in Maptive’s analysis of AGS data. Texas leads by a large margin in the number of households added, even though Utah has the highest growth rate.
These projections estimate future household counts. They do not measure HVAC sales or booked service calls. Existing homes may also support repair and replacement work.
States with the fastest projected household growth
Utah and Idaho deserve consideration from operators whose expansion plans depend on a growing customer base. Their projected household growth rates are 7.7% and 6.3%, compared with about 1.6% across the U.S. over the same five years. South Carolina and Texas follow at 5.9% and 5.8%.
| Rank | State | Projected household growth, 2026 to 2031 | Projected net household additions |
| 1 | Utah | 7.7% | 92,700 |
| 2 | Idaho | 6.3% | 48,800 |
| 3 | South Carolina | 5.9% | 133,600 |
| 4 | Texas | 5.8% | 674,300 |
| 5 | North Carolina | 4.5% | 206,000 |
| 6 | Delaware | 4.4% | 18,800 |
| 7 | Nevada | 4.1% | 53,800 |
| 8 | Arizona | 3.6% | 108,500 |
| 9 | Georgia | 3.0% | 128,500 |
| 10 | Tennessee | 2.7% | 80,700 |
Maptive analyzed AGS 2026A data for this table. Household additions are rounded to the nearest 100.
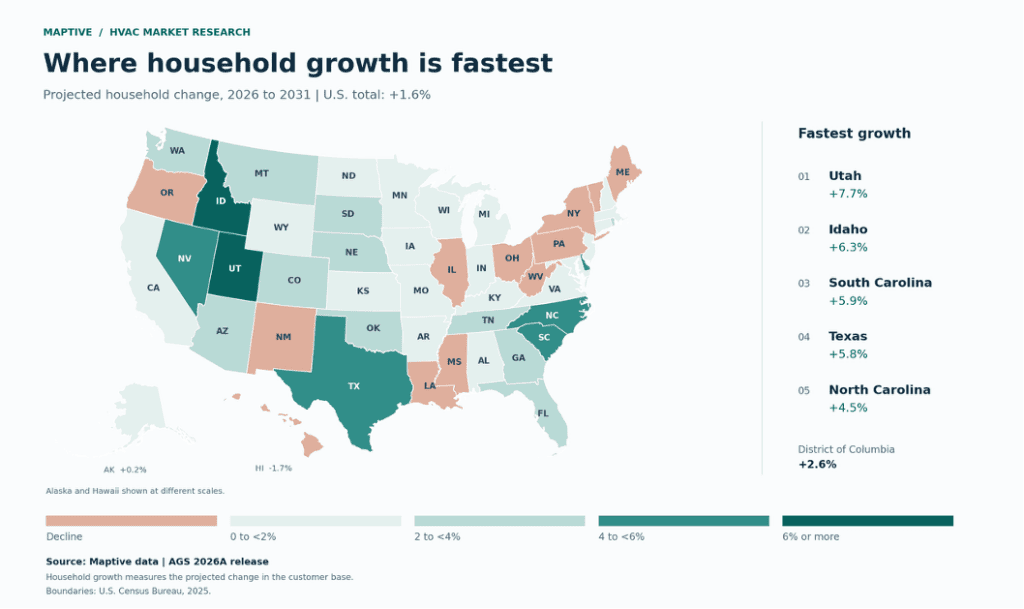
Projected household growth by state. Source: Maptive data, AGS 2026A.
Delaware’s projected growth of 4.4% places it just below North Carolina. It adds about 18,800 households, compared with 206,000 in North Carolina.
The net additions account for household gains and losses over the period. They do not count newly built homes. An operator cannot turn them directly into an installation forecast or assume that each added household will buy a service contract.
Texas adds the most potential HVAC customers
Texas offers the largest projected increase in the customer base. Its estimated 674,300 added households account for 30.6% of the country’s net household increase through 2031. The state starts with about 11.6 million households, or 8.6% of the national total.
Florida ranks second in projected household additions, at about 228,200. Its growth rate of 2.4% is below the ten states in the table.
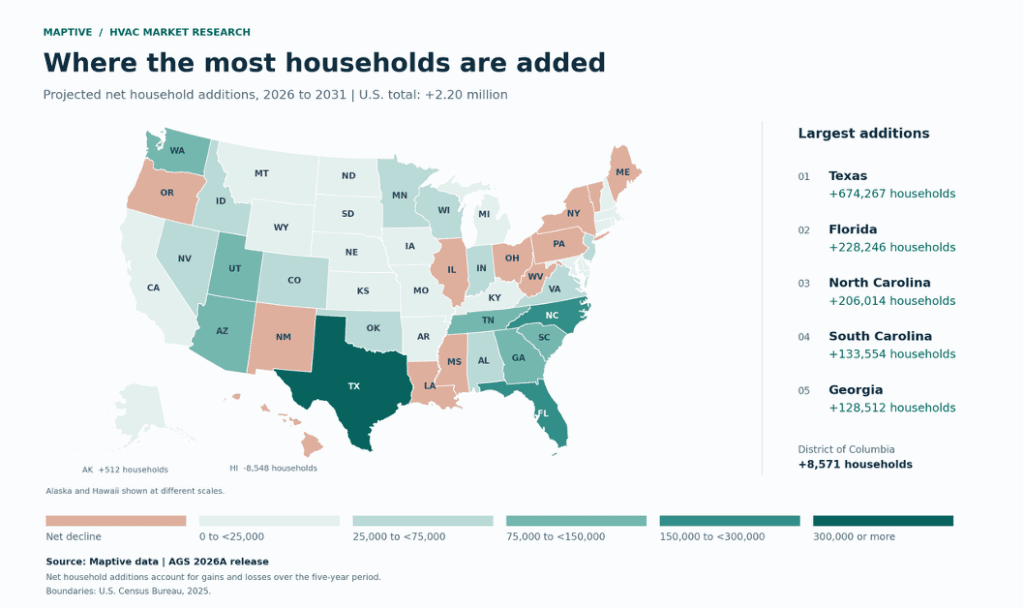
Projected net household additions by state. Source: Maptive data, AGS 2026A.
Texas, Florida, North Carolina, South Carolina and Georgia together account for about 62% of projected net U.S. household additions. A regional service company comparing nearby expansion markets can start with the states in that group.
A branch decision also depends on where the added households are. An operator needs to know whether they fall within a practical drive of a depot, whether the company can service their equipment, and how much of the market existing firms already cover.
Heating and cooling demand vary by state
Expansion into Utah or Idaho requires attention to heating service as well as cooling. Idaho has 6,583 heating degree days and 772 cooling degree days. Utah has 5,726 heating degree days and 1,149 cooling degree days. Both states combine fast projected household growth with substantial heating requirements.
Cooling degree days measure how far daily average temperatures exceed a reference temperature over a period. Higher values mean the weather creates a greater need for cooling. They do not count days when an air conditioner runs or predict the number of repair calls.
Arizona, Florida, Texas and Nevada pair high cooling values with projected household growth. Louisiana, Mississippi and Hawaii also have high cooling values, but their household bases are projected to shrink. Existing customers in those states still need cooling service.
Housing age and HVAC replacement opportunities
Operators focused on existing-home service can use housing age to select areas for closer research. Nevada has the largest share of housing built from 1990 to 2009, at 47.0%. Georgia follows at 38.1%, then Arizona at 37.7%. The national share is about 26%.
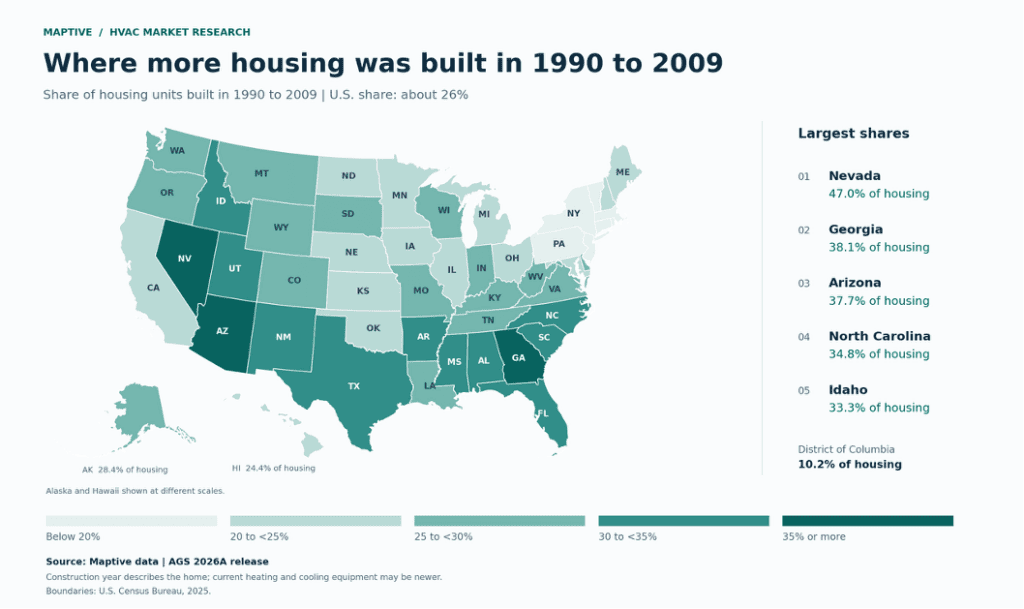
Housing built from 1990 to 2009 as a share of each state’s housing units. Source: Maptive data, AGS 2026A.
Homes from that period are about 17 to 36 years old in 2026. Their current heating and cooling equipment may be much newer. A homeowner could have replaced a system several years ago, so construction year cannot establish how many systems are due for replacement.
Check equipment age when assessing replacement opportunities. ENERGY STAR recommends considering replacement for air conditioners and heat pumps older than 10 years, and furnaces or boilers older than 15 years. Those ages prompt an assessment rather than a requirement to replace equipment.
Nevada, Georgia and Arizona also have growing household bases in the projection. An operator assessing these markets should examine new-customer opportunities alongside service records for existing homes. Equipment installation dates, repair history and current condition would help distinguish maintenance customers from likely replacement customers.
Plumbing and heating spending growth
Texas has the largest projected increase in annual household spending on plumbing and heating, at about $264 million by 2031 compared with 2026. North Carolina follows at $81 million, Georgia at $63 million, Florida at $58 million and South Carolina at $45 million. These figures describe the change between two annual spending totals, rather than spending accumulated across five years. The category includes plumbing and does not isolate central air conditioning or all HVAC purchases. It provides a broader service-spending comparison, not a forecast of revenue available to HVAC contractors.
Contractor counts need a closer local check
Utah and South Carolina have the most projected household additions per establishment in the building equipment contractor category. The five-year additions equal about 51.5 households per establishment in Utah and 50.6 in South Carolina, compared with about 11 nationally. Idaho follows at 43.4, Texas at 39.6 and Nevada at 36.3.
The establishment count includes plumbing and electrical firms alongside heating and cooling contractors. The count does not show how many technicians each business employs or whether it serves residential customers. The ratio compares five years of projected household additions with a current business count.
A high ratio alone cannot establish a technician shortage. Local service capacity may change before 2031 as new firms enter the market or existing firms hire, expand their service areas or work across state boundaries.
Compare local service areas in Maptive
An operator considering South Carolina can compare candidate service areas with the company’s existing customer locations. A branch would need to reach enough suitable households within an acceptable drive time.
In Maptive, plot customer locations and candidate branch addresses together. Use the Boundary Tool to display supported demographic measures or numeric spreadsheet data by geographic area, then compare those areas with the territories the company already serves.
The Drive Time Polygon tool can show the area reachable within a selected driving time from a branch address. Use it to compare customer coverage from each candidate branch. Local household projections and equipment records need to be obtained and checked separately; the state figures do not supply them.
Compare reachable household counts with existing customer density, equipment types and service history before choosing a branch or territory. Use the same records to estimate how much work the crews could take on.