


Free Online Tool
Free Mapping Software
Do you have your location data in a spreadsheet? Add your file and Maptive plots every row on an interactive map you can color, filter, measure, and share by link.
Works in your browser on Mac, Windows, and Chromebook.
Trusted by teams at













Match Your Job to the Right Set of Tools
What you need from a map depends on what you are doing with it. These are the five jobs people use Maptive for most, and the tools for each one.
| What you need | Tools that do it | What you end up with |
|---|---|---|
| A map for a report | Import, color coding, map export | A styled map sized for a slide or a printed page. |
| Customer and account data | Filters, grouping, CRM sync | A live map of your accounts that keeps up as records change. |
| Territory planning | Automated territories, boundary tool, lasso | Even areas, with counts and totals for each one. |
| A map for clients | Custom pins, map styling, share links | A branded map that opens in a browser with no login. |
| Routes and coverage | Route optimization, drive-time areas, radius circles | Stops in the right order, and a picture of what each site reaches. |
A One-Off Map for a Report or a Slide
You need a map for a document or a slide. You make it once and you are done with it.
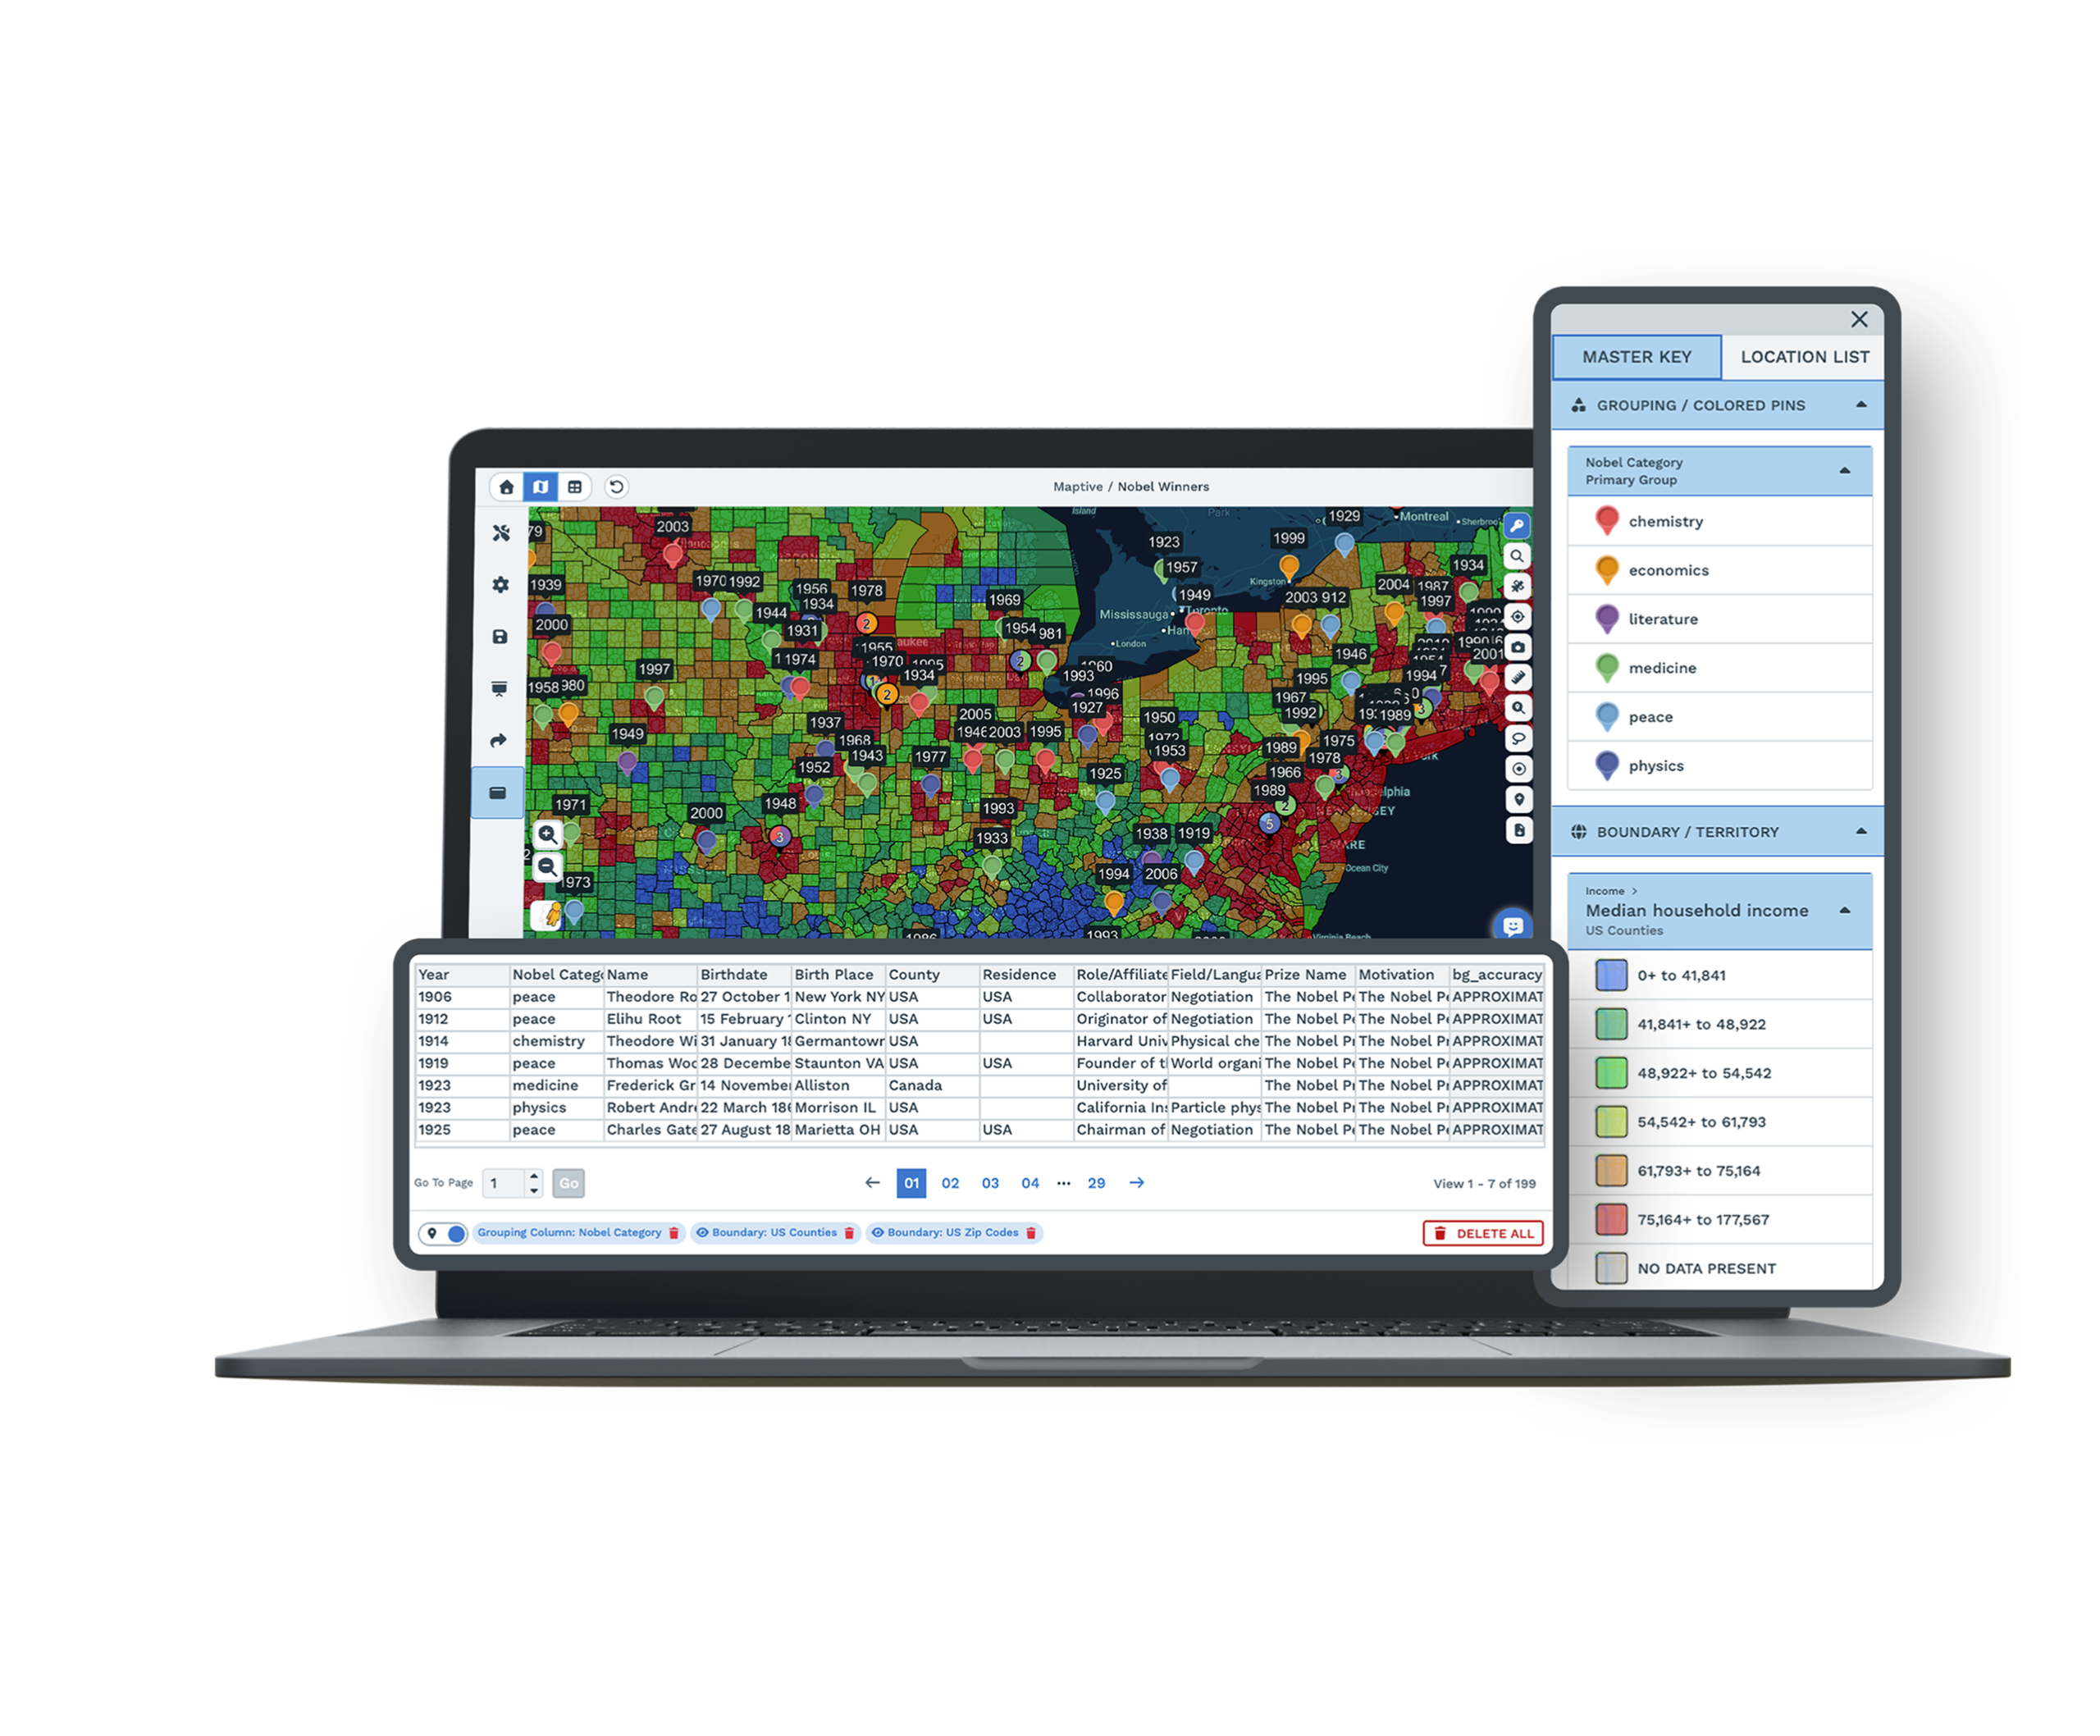
Spreadsheet in, presentation map out
Add your file. Maptive reads your headers, asks which columns hold the location, and plots every row.
Full street addresses work. So do city and state, a zip code column on its own, or latitude and longitude. If a row will not match, Maptive tells you which one, so you can fix it instead of finding out later that your count is short.
The rest is styling. Pick any column and Maptive colors the pins by that value and builds the legend for you. Switch the background to a plain map for print, or to satellite when you need to see what is around each site.
When it looks right, save it as an image for a slide, a large print file, or a link.
- Tools you will use
- Data import, color coding, map styling, export
- What you need
- One CSV or Excel file with a location column in it
- How long it takes
- Minutes. There is no template to fill in first.
An Ongoing Map of Customer or Account Data
Your list keeps changing, so the map has to change with it.
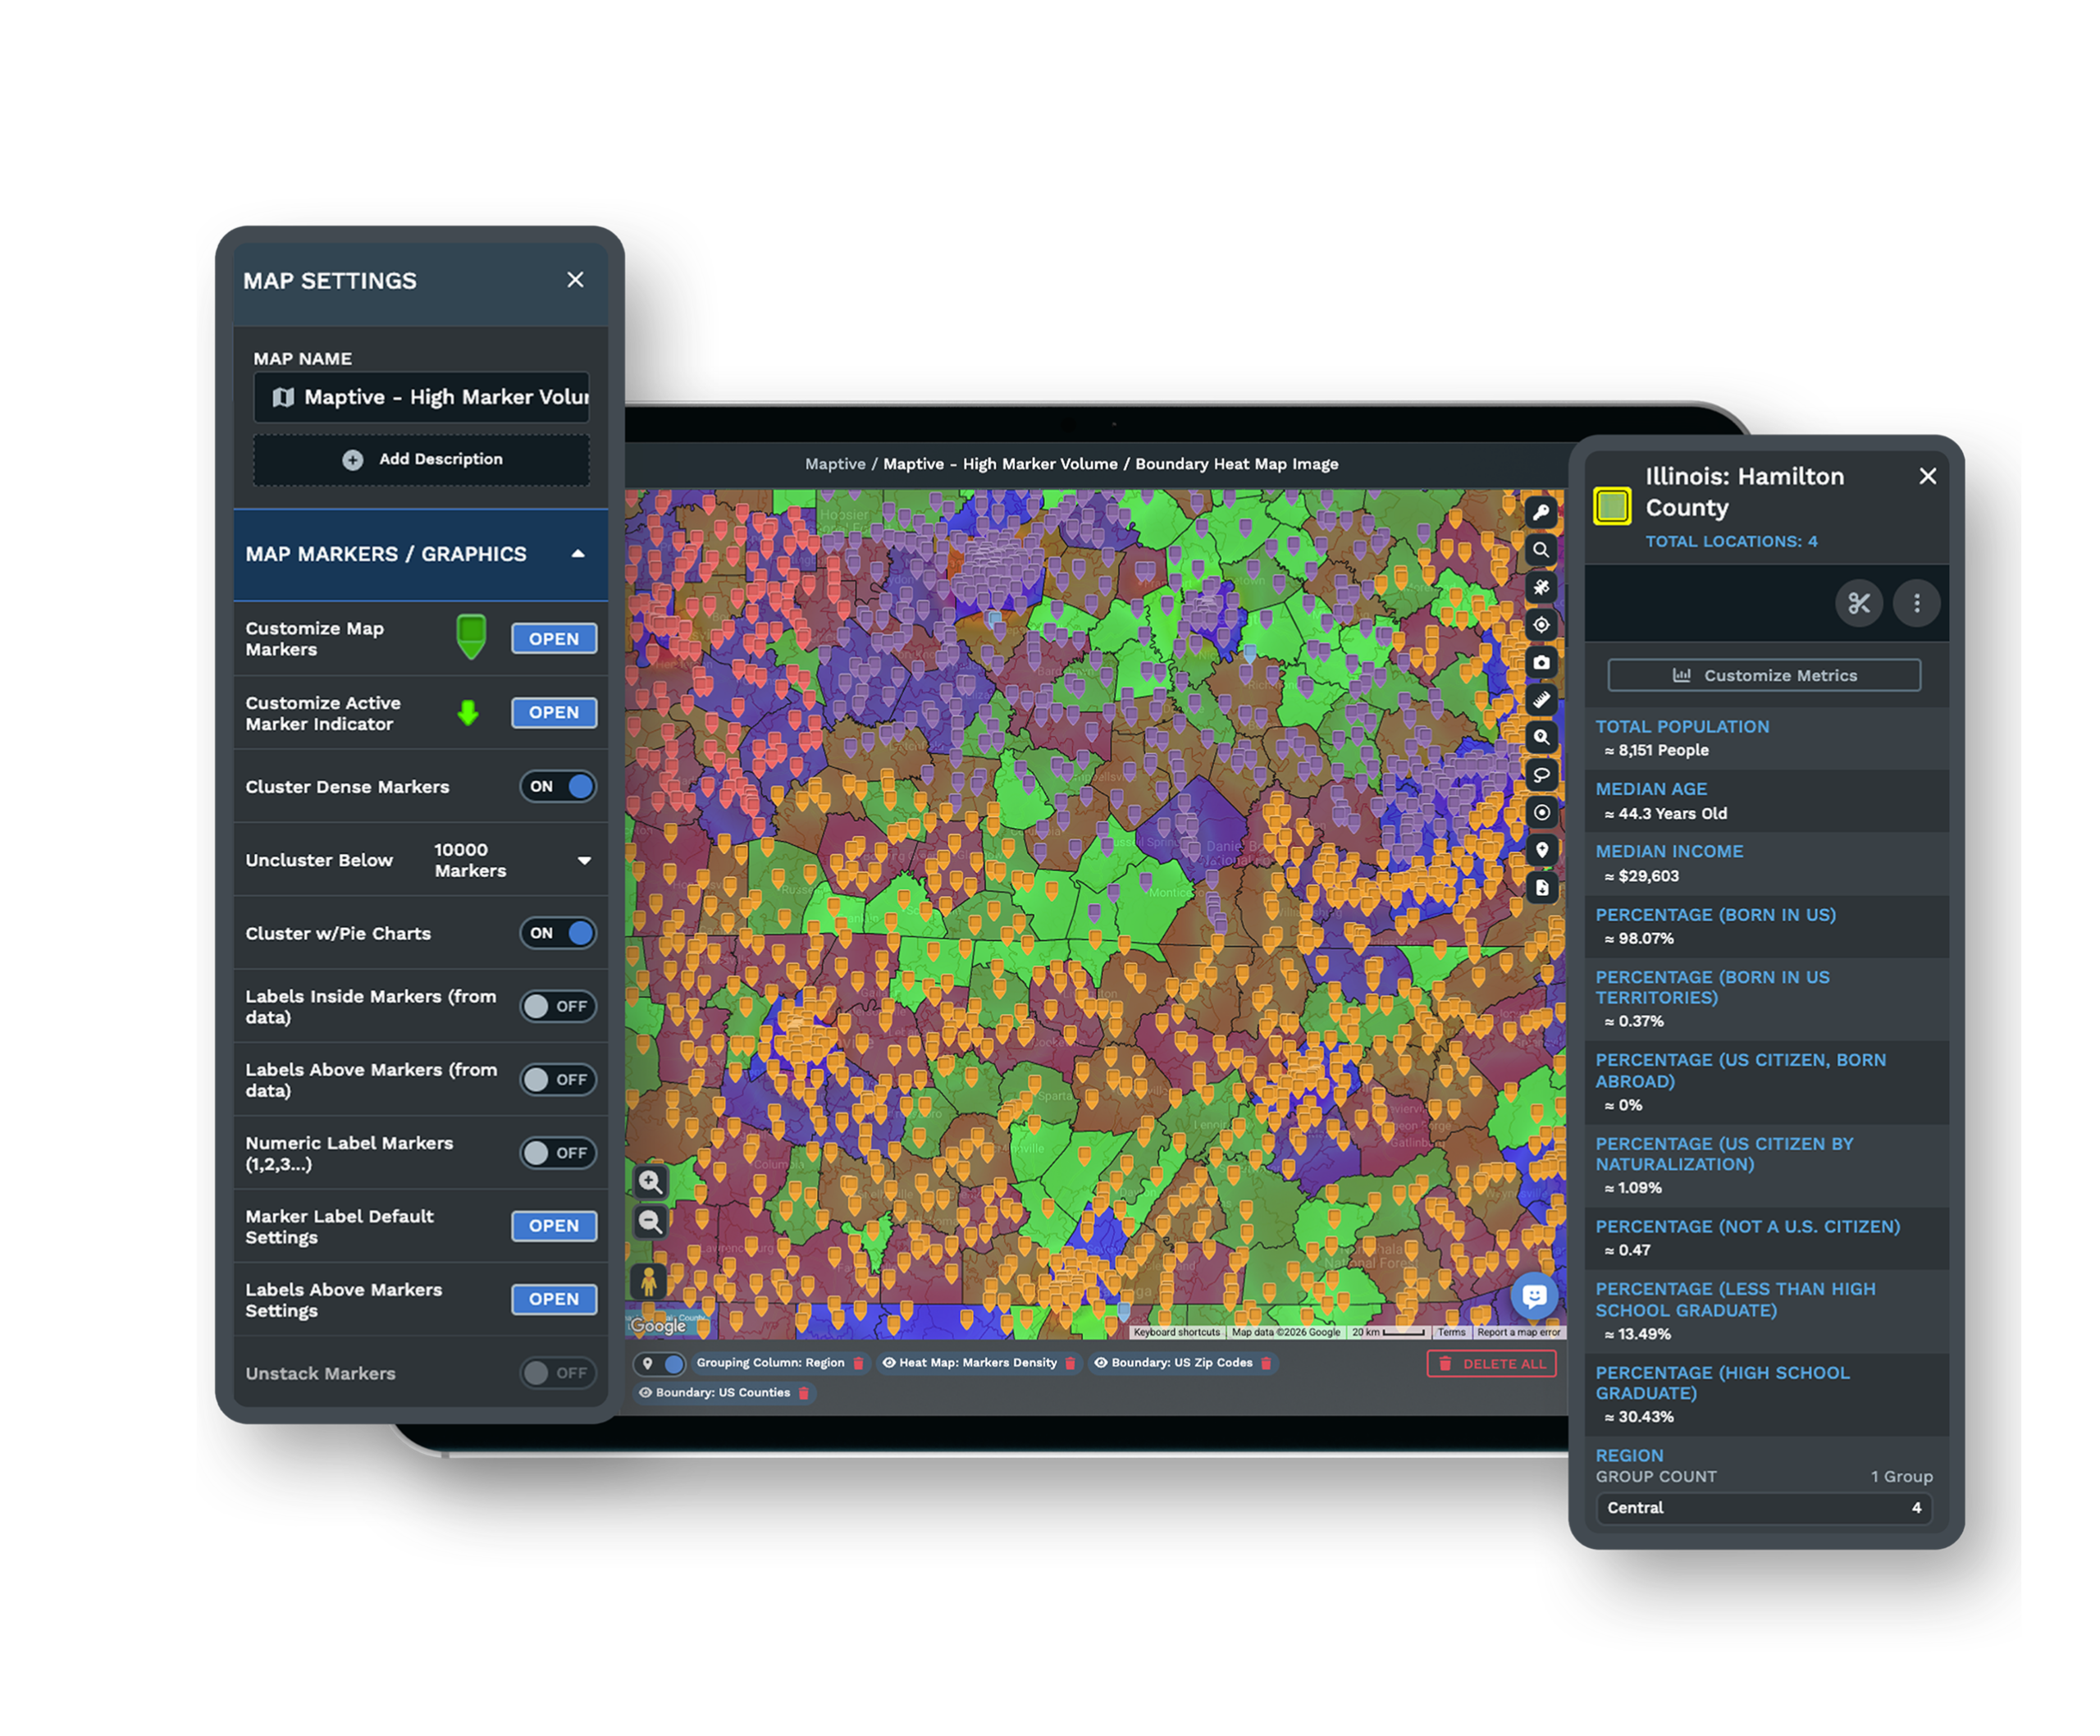
Ask the map questions
Getting the dots on screen is the easy part. The useful bit is what you can ask the map afterwards.
Filter down to accounts over a certain size in one region. Group pins by product line or by rep and see the count for each. If you have so many pins that they cover each other, switch to a heat map to see where your volume is and where it is thin.
You can also put census data underneath your own, like income, age, and household numbers by zip code. That turns a map of where your customers are into a map of where more of them might be.
If your records live in a CRM, connect it and the map reads from it directly, so you are not exporting a file every time something changes. If they live in a spreadsheet, upload the new version over the old one and the map updates, keeping the colors and filters you set.
- Tools you will use
- Filters, grouping, heat maps, census overlays, CRM sync
- What you need
- Your account list, or a connection to the CRM holding it
- What it saves you
- Rebuilding the same map by hand every month
Territory Planning and Coverage
Splitting a region between people is hard to do in a spreadsheet, because the question is about places, not rows.
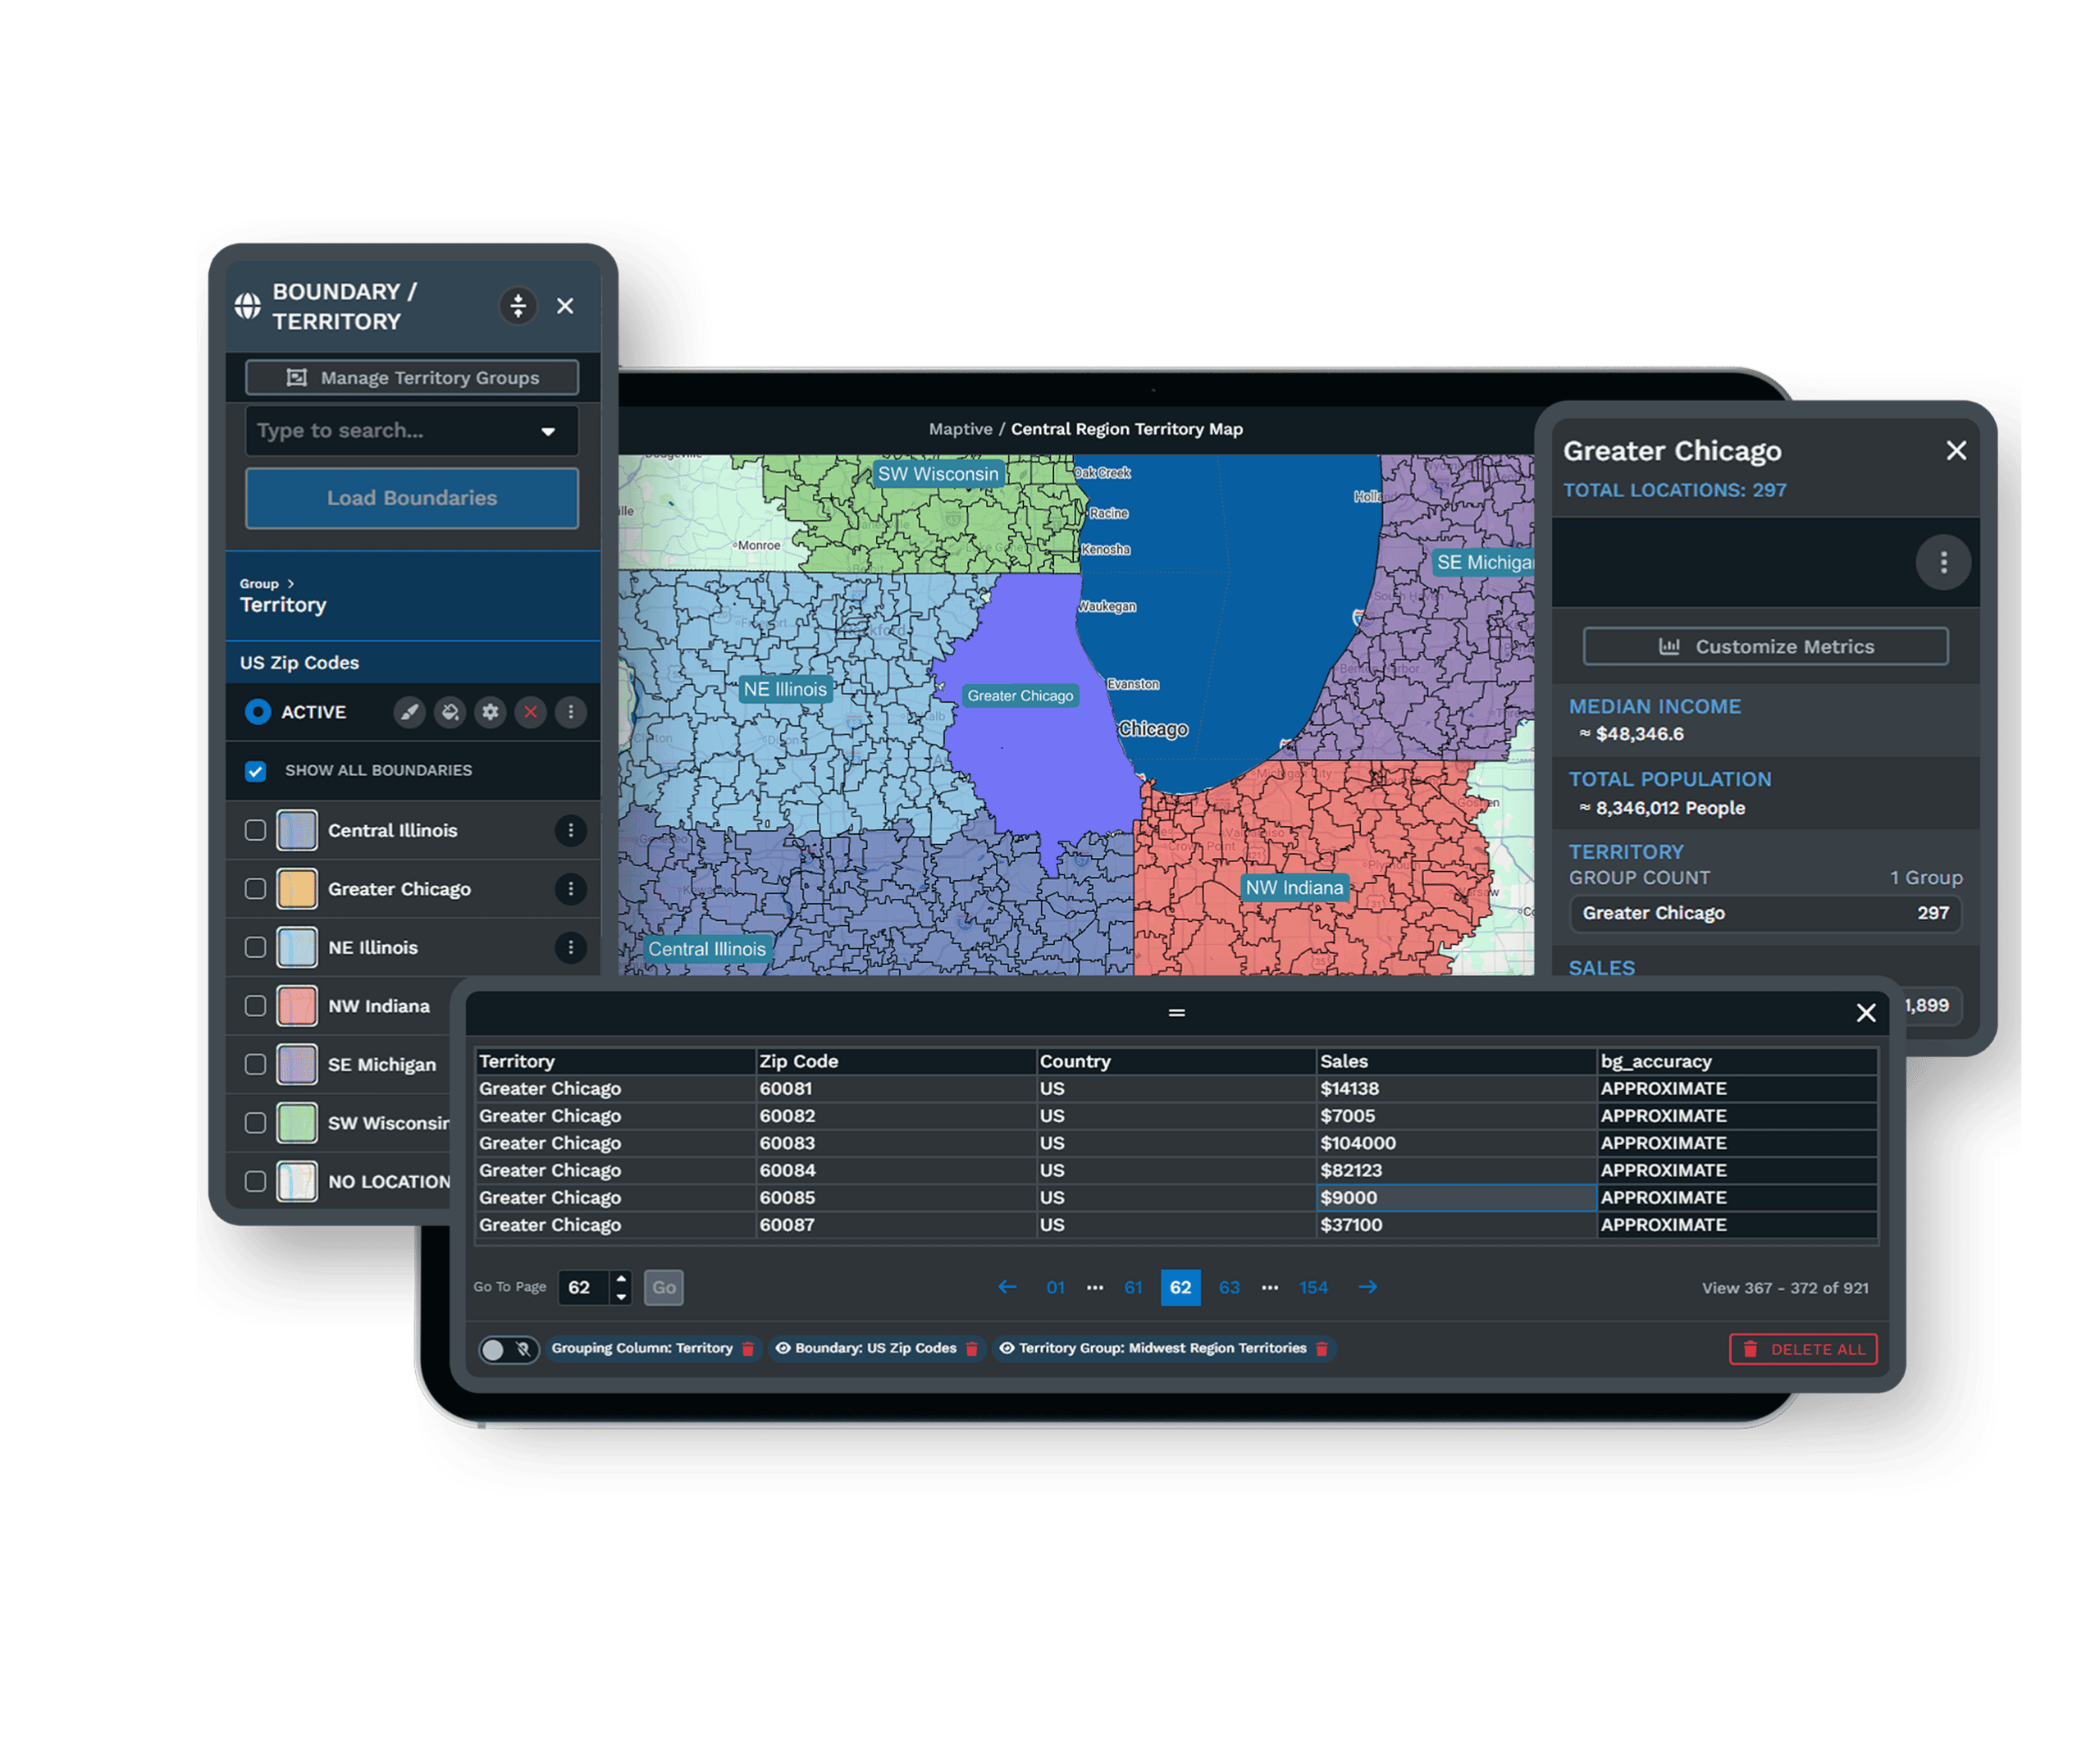
Draw the areas, then see what is in them
There are three ways to build territories. Group zip codes, counties, or states into named areas. Draw around a group of pins by hand with the lasso, for when the line you want does not follow a border. Or let the automated territory creator split them evenly across however many reps you have.
Then each territory tells you how many records are inside it, plus the totals for any number column you pick. An uneven split shows up as a number instead of a guess.
Move a boundary and both sides update straight away.
The map also shows where two locations overlap, and where nothing is close enough to anything.
- Tools you will use
- Automated territory creator, boundary tool, lasso, grouping
- What you need
- Your locations, plus the column you want balanced, like revenue or account count
- What you get back
- Named areas with counts and totals on each one
A Map You Share With Clients or Publish
You want to send the map to someone outside your team, with your branding on it, and you do not want them signing up for anything.
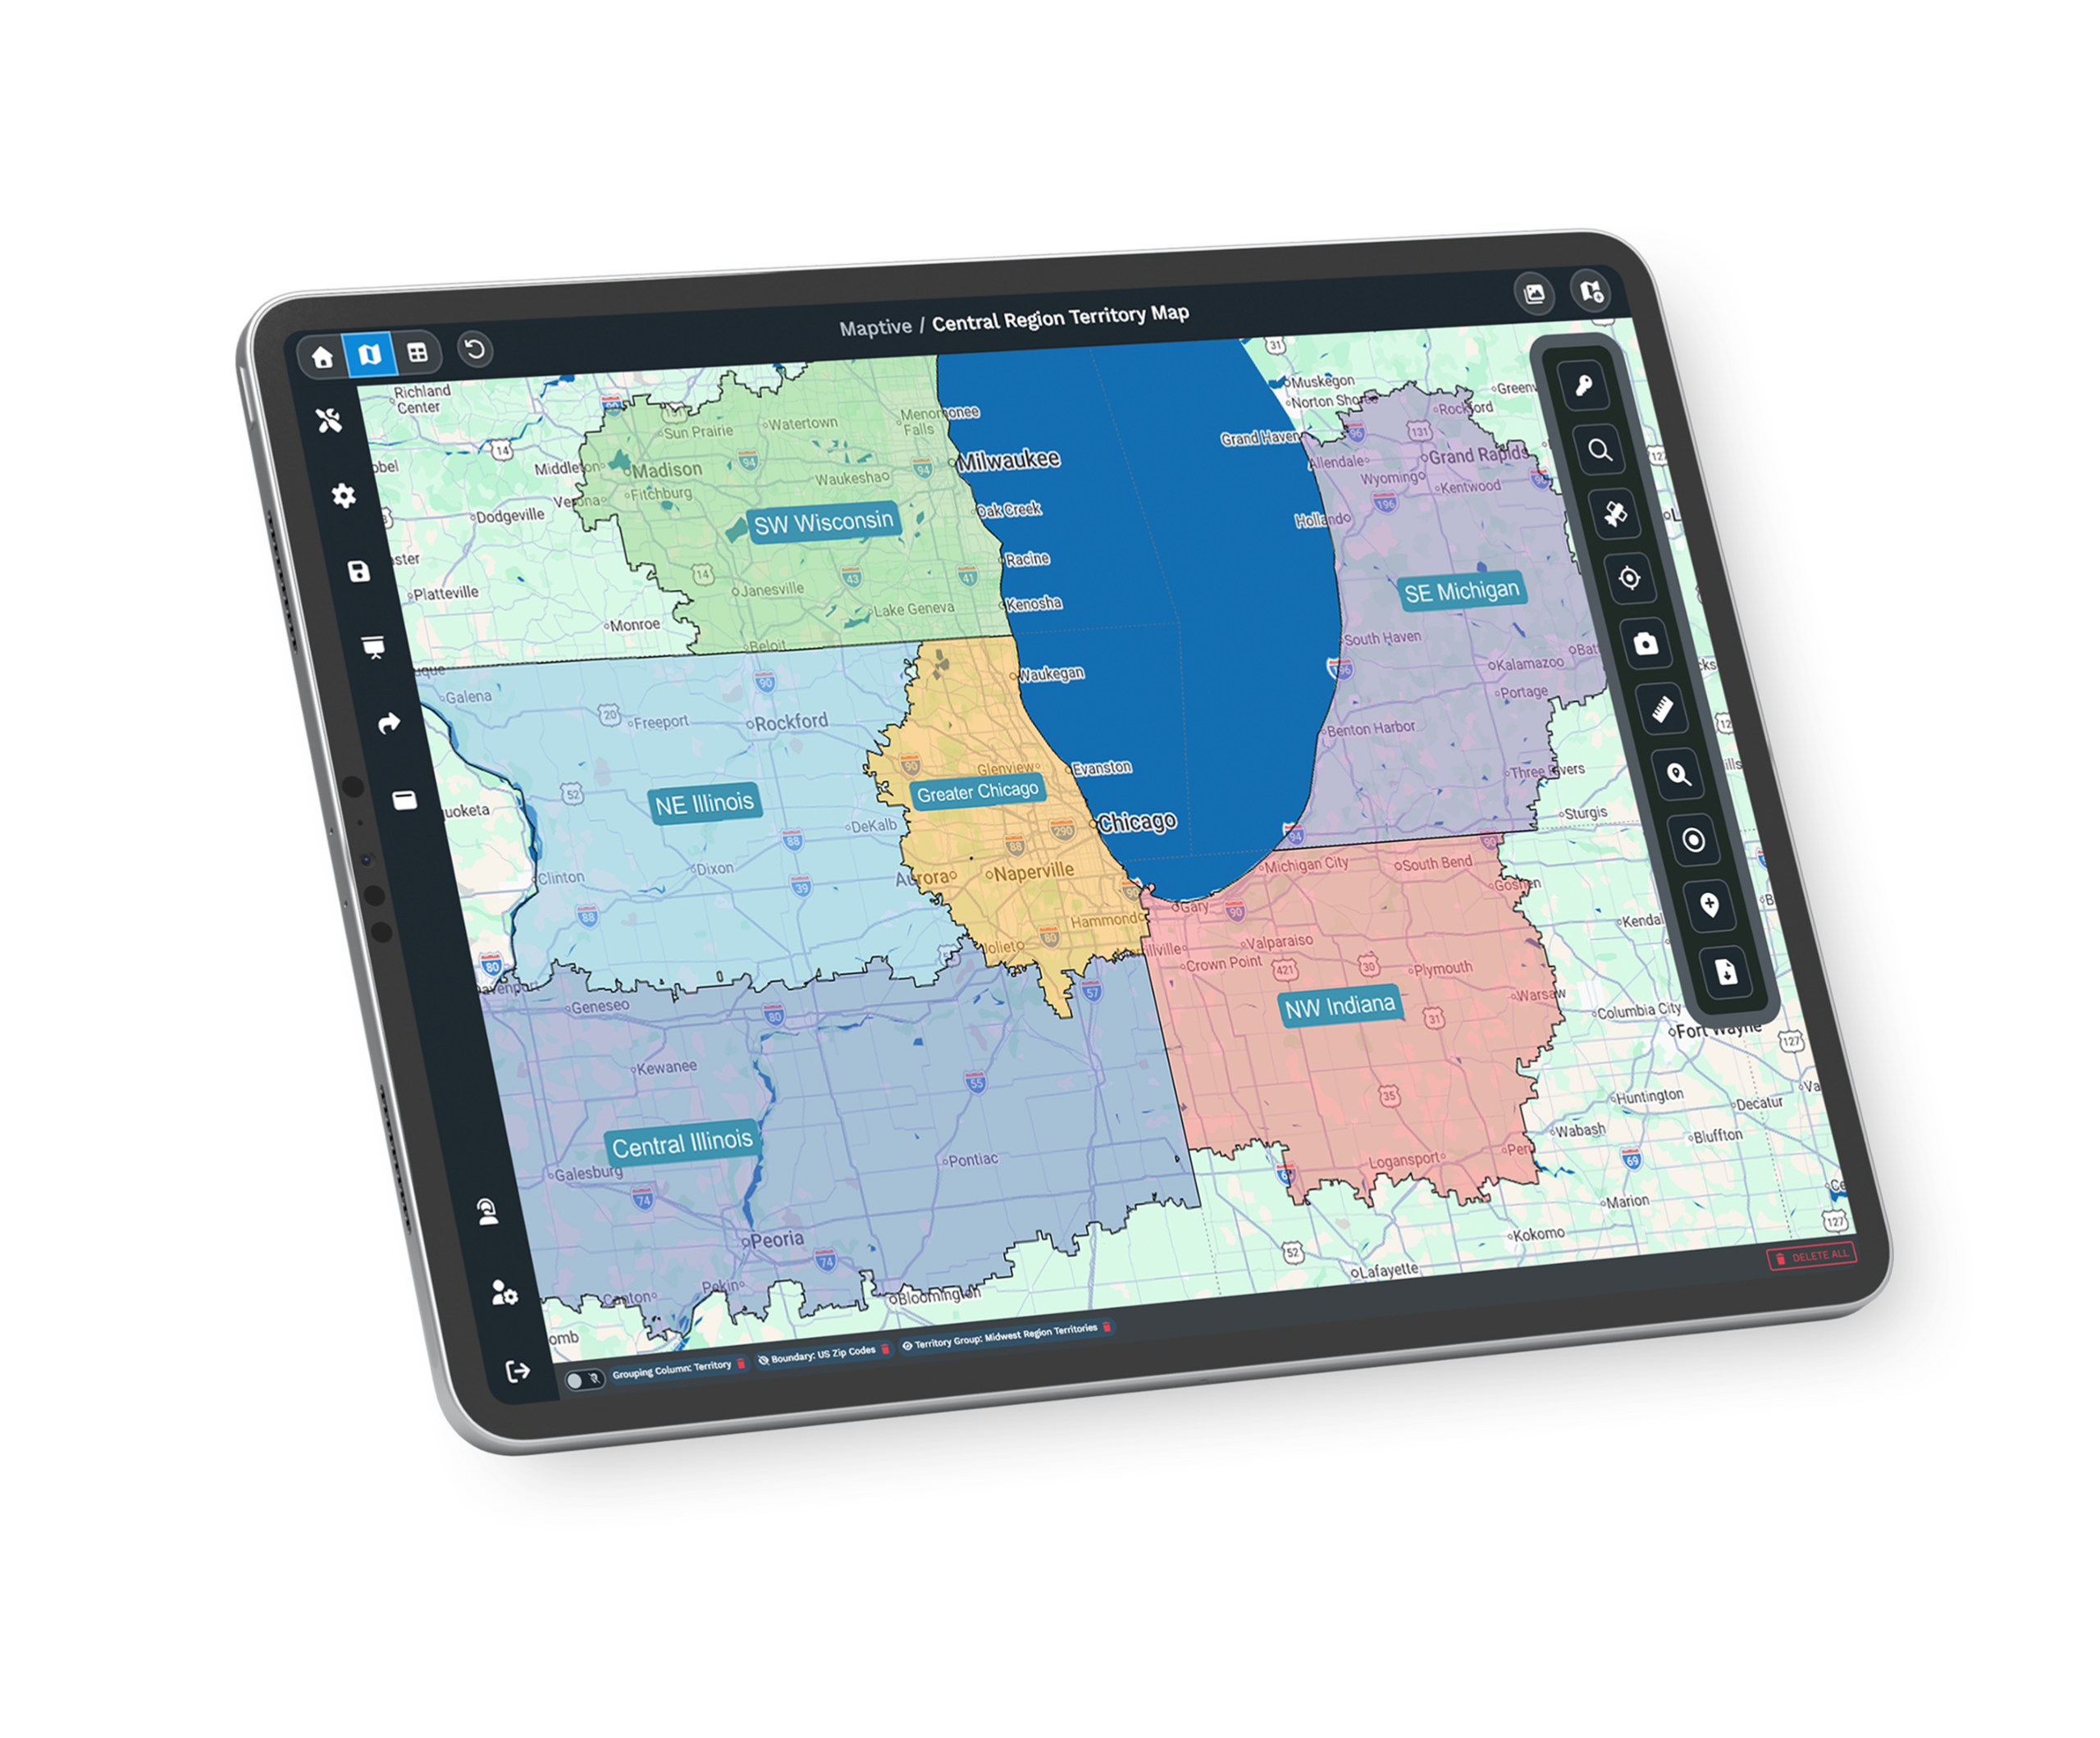
Branded, interactive, opens with a link
Upload your own pin icons so the map uses your logo instead of generic pushpins. Change the background map to your brand colors, and decide how much road and label detail shows. Add text, shapes, and notes onto the map where something needs explaining.
There are three ways to send it. A link opens the live map in any browser, with no account needed at the other end. An embed puts the same map inside a web page. An export gives you a flat image or a print file.
Whoever you send it to can still click a pin for the details, use any filters you left on, and type in an address to find the nearest location. You keep control of the map, and when you change it, their view changes too.
- Tools you will use
- Share, embed and export, custom pins, map styling, drawing tool
- What they need
- A browser. No login, nothing to install.
- Ways to send it
- Live link, page embed, slide image, print file
Driving Routes and Field Visits
Work out the order to drive a day of stops in, and see how far each location can reach.
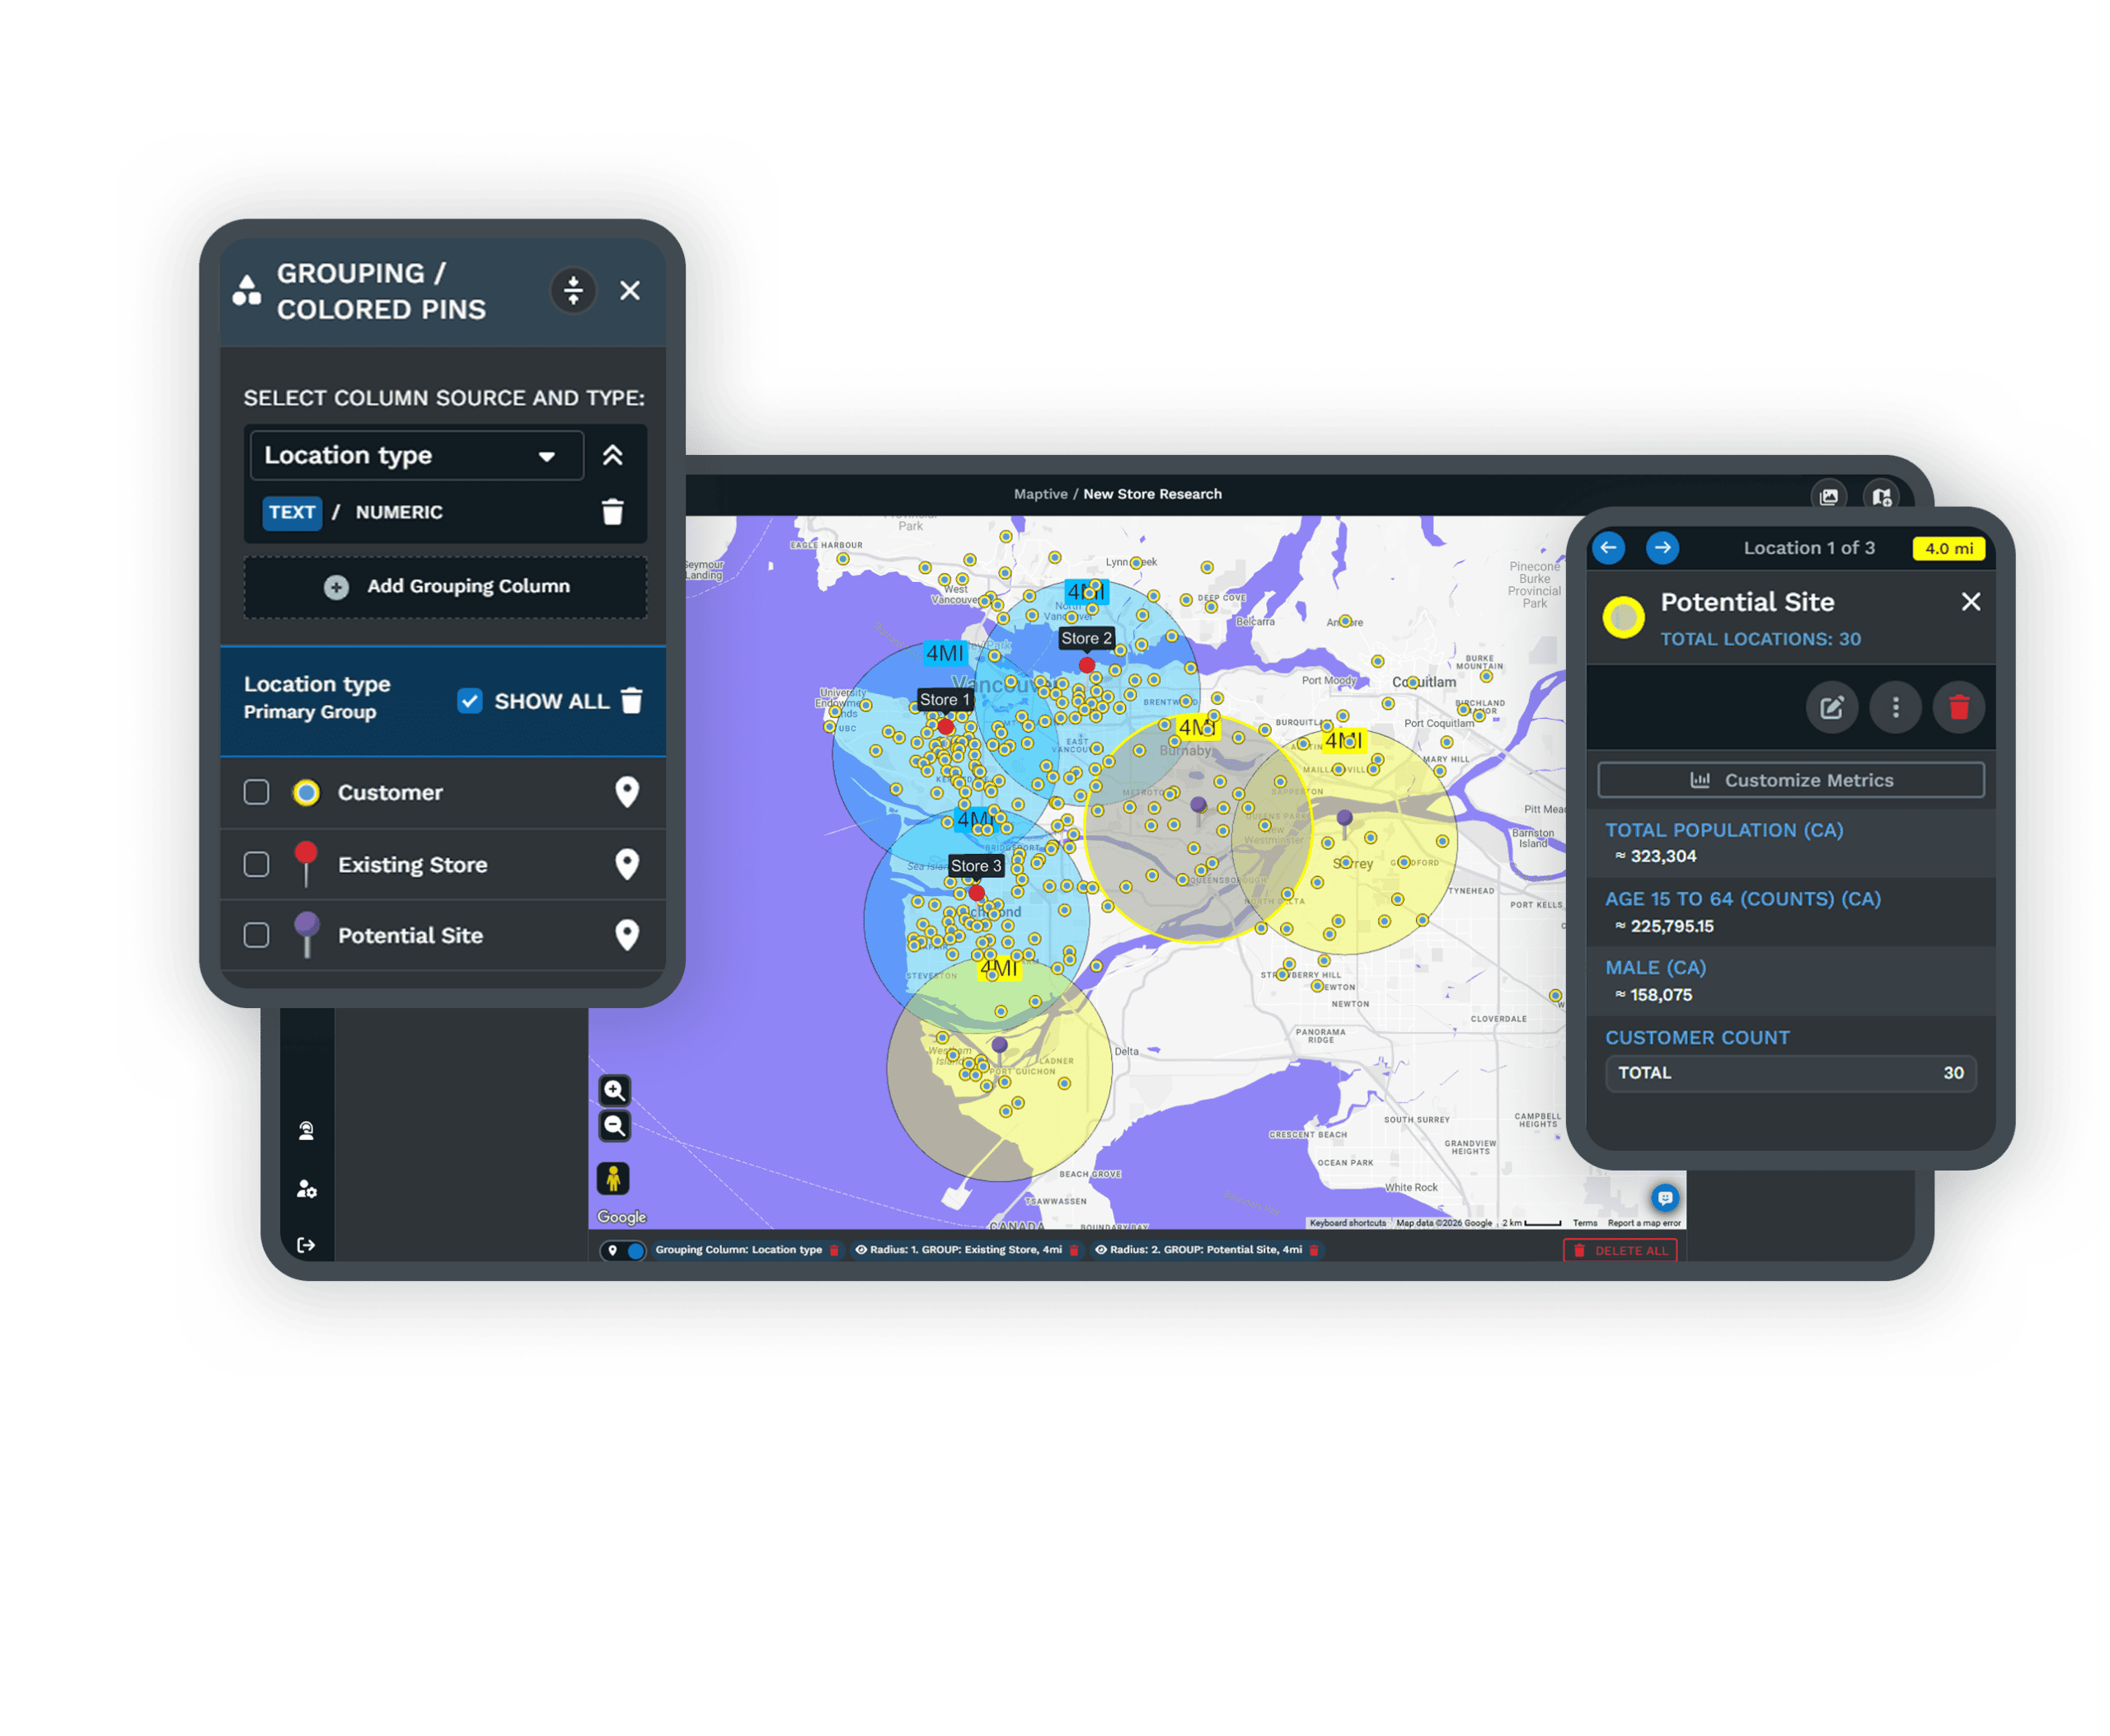
Put the stops in order, then see what each site covers
Give Maptive a full day of stops and it works out the order that keeps the driving down, instead of following the order you typed them in. Send the finished route to a phone for turn-by-turn directions.
Coverage is the other half. Drive-time areas shade in everything you can reach within a set number of minutes from a location. That is not the same as a circle on a map, because thirty minutes of driving gets you a lot further on a highway than in a city center. Circles are still useful for a simple distance rule, and you can draw either one around every site at once.
Put the two together and you can see which addresses you can reach in time, which ones you miss, and where another location would close the gap.
- Tools you will use
- Route optimization, turn-by-turn directions, drive-time areas, radius circles
- What it plans
- A full day of stops, put in the best order for you
- Coverage output
- Drive-time areas and distance rings around every location
Everything Is Switched On From the First Login
There is no cut-down starter version. Every tool is there from the moment you sign in, along with the census data behind them.
Nothing held back
Every tool is there from the start, so the first map you build is the map you carry on using.
- All 60+ mapping and analysis tools
- Census data by zip code and tract
- Up to 200,000 pins on one map
- No credit card to get started
Use your own data
Maptive reads the file you already have. There is no sample data set to work from and no template to fill in first.
- CSV, XLSX and XLS files
- Addresses, cities, zip codes or coordinates
- Rows that will not match get flagged
- Re-upload to refresh a map in place
Made for work
The security and support you need for business use come as standard rather than as an upgrade.
- SSL encryption and two-factor login
- Single sign-on and role-based access
- Phone, chat and email support
- Maps stay private unless you publish them
Putting Customer Data on a Map
A customer list is not something you want to drop into any tool that will take it. Your maps stay private to your account unless you choose to publish one, and you control sharing map by map. Maptive runs 256-bit SSL, two-factor login, single sign-on, role-based access, and audit logging. Amazon, Coca-Cola, CBRE, Capital One, and the US Department of Energy all run location work on Maptive. Each of them passed its own procurement and security review first, which is usually the hard part.
Put Your Own List on a Map
Add your file, match the columns, and start working with a real map of your own data. Every tool is switched on, and you do not need a credit card to start.
Frequently Asked Questions
Do I need a credit card to start?
No. You can set up an account, add your own data, and build a working map without entering any card details. Every feature is switched on from the moment you sign in.
What file types can I upload?
CSV, XLSX and XLS. There is no template to fill in first. Maptive reads whatever headers your file already has and asks which ones hold the location.
What counts as location data?
A column of full street addresses works. So does city and state, a zip code on its own, or latitude and longitude. If a row cannot be matched to a place, Maptive flags it so you can fix it rather than losing it without noticing.
How many locations can I put on one map?
Up to 200,000 pins on a single map. How much data you can store overall depends on your plan, but the tools you get do not change.
Do I need GIS skills to use it?
No. Maptive runs in a browser and starts from the spreadsheet you already have. Nothing to install, no map projection to pick, no shapefile to track down. If you know which column holds your addresses, you know enough.
Can I share a map with someone who does not have an account?
Yes. A share link opens the live map in any browser with no login needed. You can also embed it in a web page, or export it as an image or a print file. Whoever you send it to can click pins for details, use the filters you left on, and search for the nearest location to an address.
Can I build sales territories from my data?
Yes. Group them from zip codes, counties or states, draw them by hand around a cluster of pins, or have them split evenly across a set number of reps. Each area shows its record count and column totals, so you can see an imbalance as a number.
Will my map update when my spreadsheet changes?
Upload the new version over the old one and the map refreshes, keeping the colors, filters and territories you set up. If you work from a CRM, connect it and changes flow through without any re-upload.








