
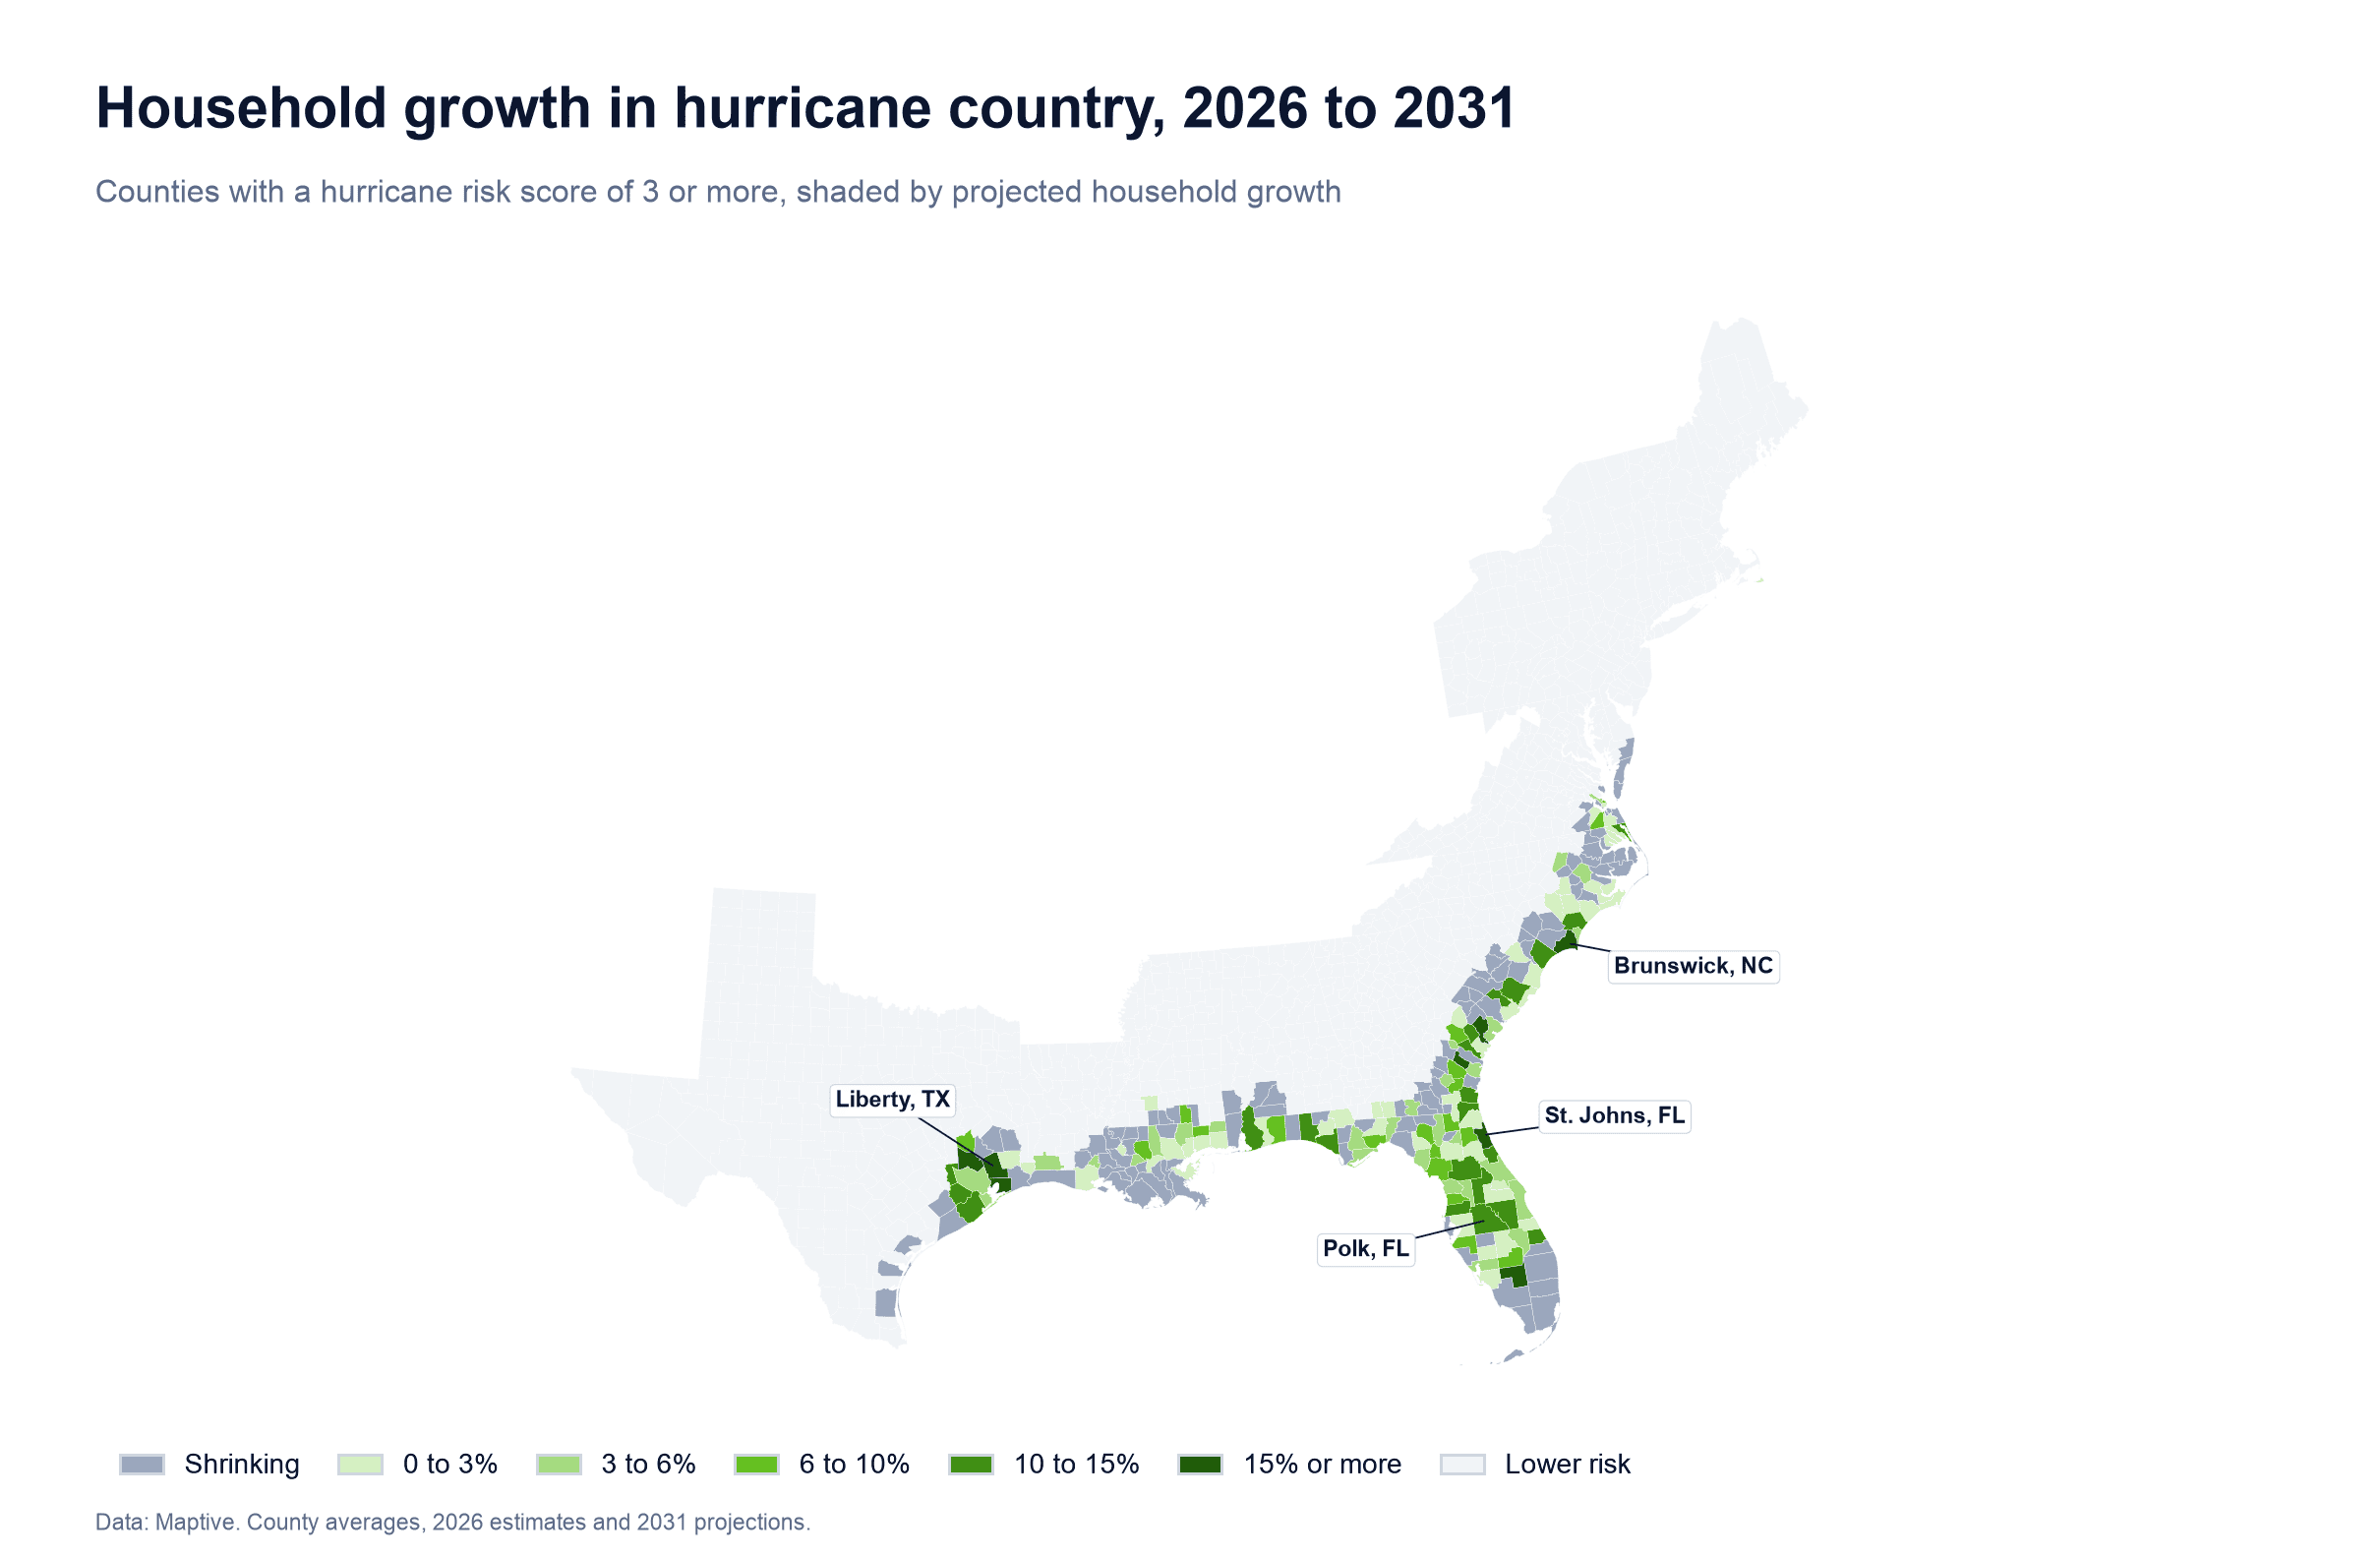
Counties with meaningful hurricane risk have about 13% of US households today, yet they are on track to add roughly 24% of all new households between 2026 and 2031. The appeal is strongest across Florida, coastal Texas and the Carolinas, where lower costs, warm weather and new housing continue to attract people. Counties exposed to storm surge, the seawater a hurricane pushes ashore, are set to lose households overall. People are moving into hurricane country, but most are staying away from areas exposed to storm surge.
Polk County, Florida and the suburbs south of Houston have new homes, schools and grocery stores that were not there two years ago.
Most of that growth is in some of the country's most hurricane-exposed counties. These places have the cheapest land, the warmest winters and the most new housing, but storms also reach them most often. For now, people are accepting the hurricane risk for those benefits.
How was this measured?
The analysis uses 2026 household estimates, 2031 household projections, median home values and standardized hurricane and storm surge risk scores for all 3,144 US counties, as available in Maptive.
How big is the shift?
US households should grow about 1.6% between 2026 and 2031, adding a little over 2.2 million new households. Counties that score 3 or more out of 10 on hurricane risk should grow nearly twice as fast, at about 3% over the same period.
Those 236 counties are spread across 11 states from Texas to Massachusetts. They have about one in eight American households today and are on track to add about one in four new households. Their share of growth is much larger than their share of households, which runs against the idea that storm risk keeps people away.
| Counties | Share of US households today | Share of new US households, 2026 to 2031 | Five-year household growth |
|---|---|---|---|
| Hurricane risk 3 or more | 13.1% | 24.3% | 3.0% |
| Hurricane risk 4 or more | 10.1% | 16.6% | 2.7% |
| Storm surge risk 1 or more | 4.6% | Losing households | -0.9% |
| All US counties | 100% | 100% | 1.6% |
Counties scoring 4 or more show the same pattern. They have about a tenth of US households and should account for about a sixth of household growth.
What counts as hurricane country?
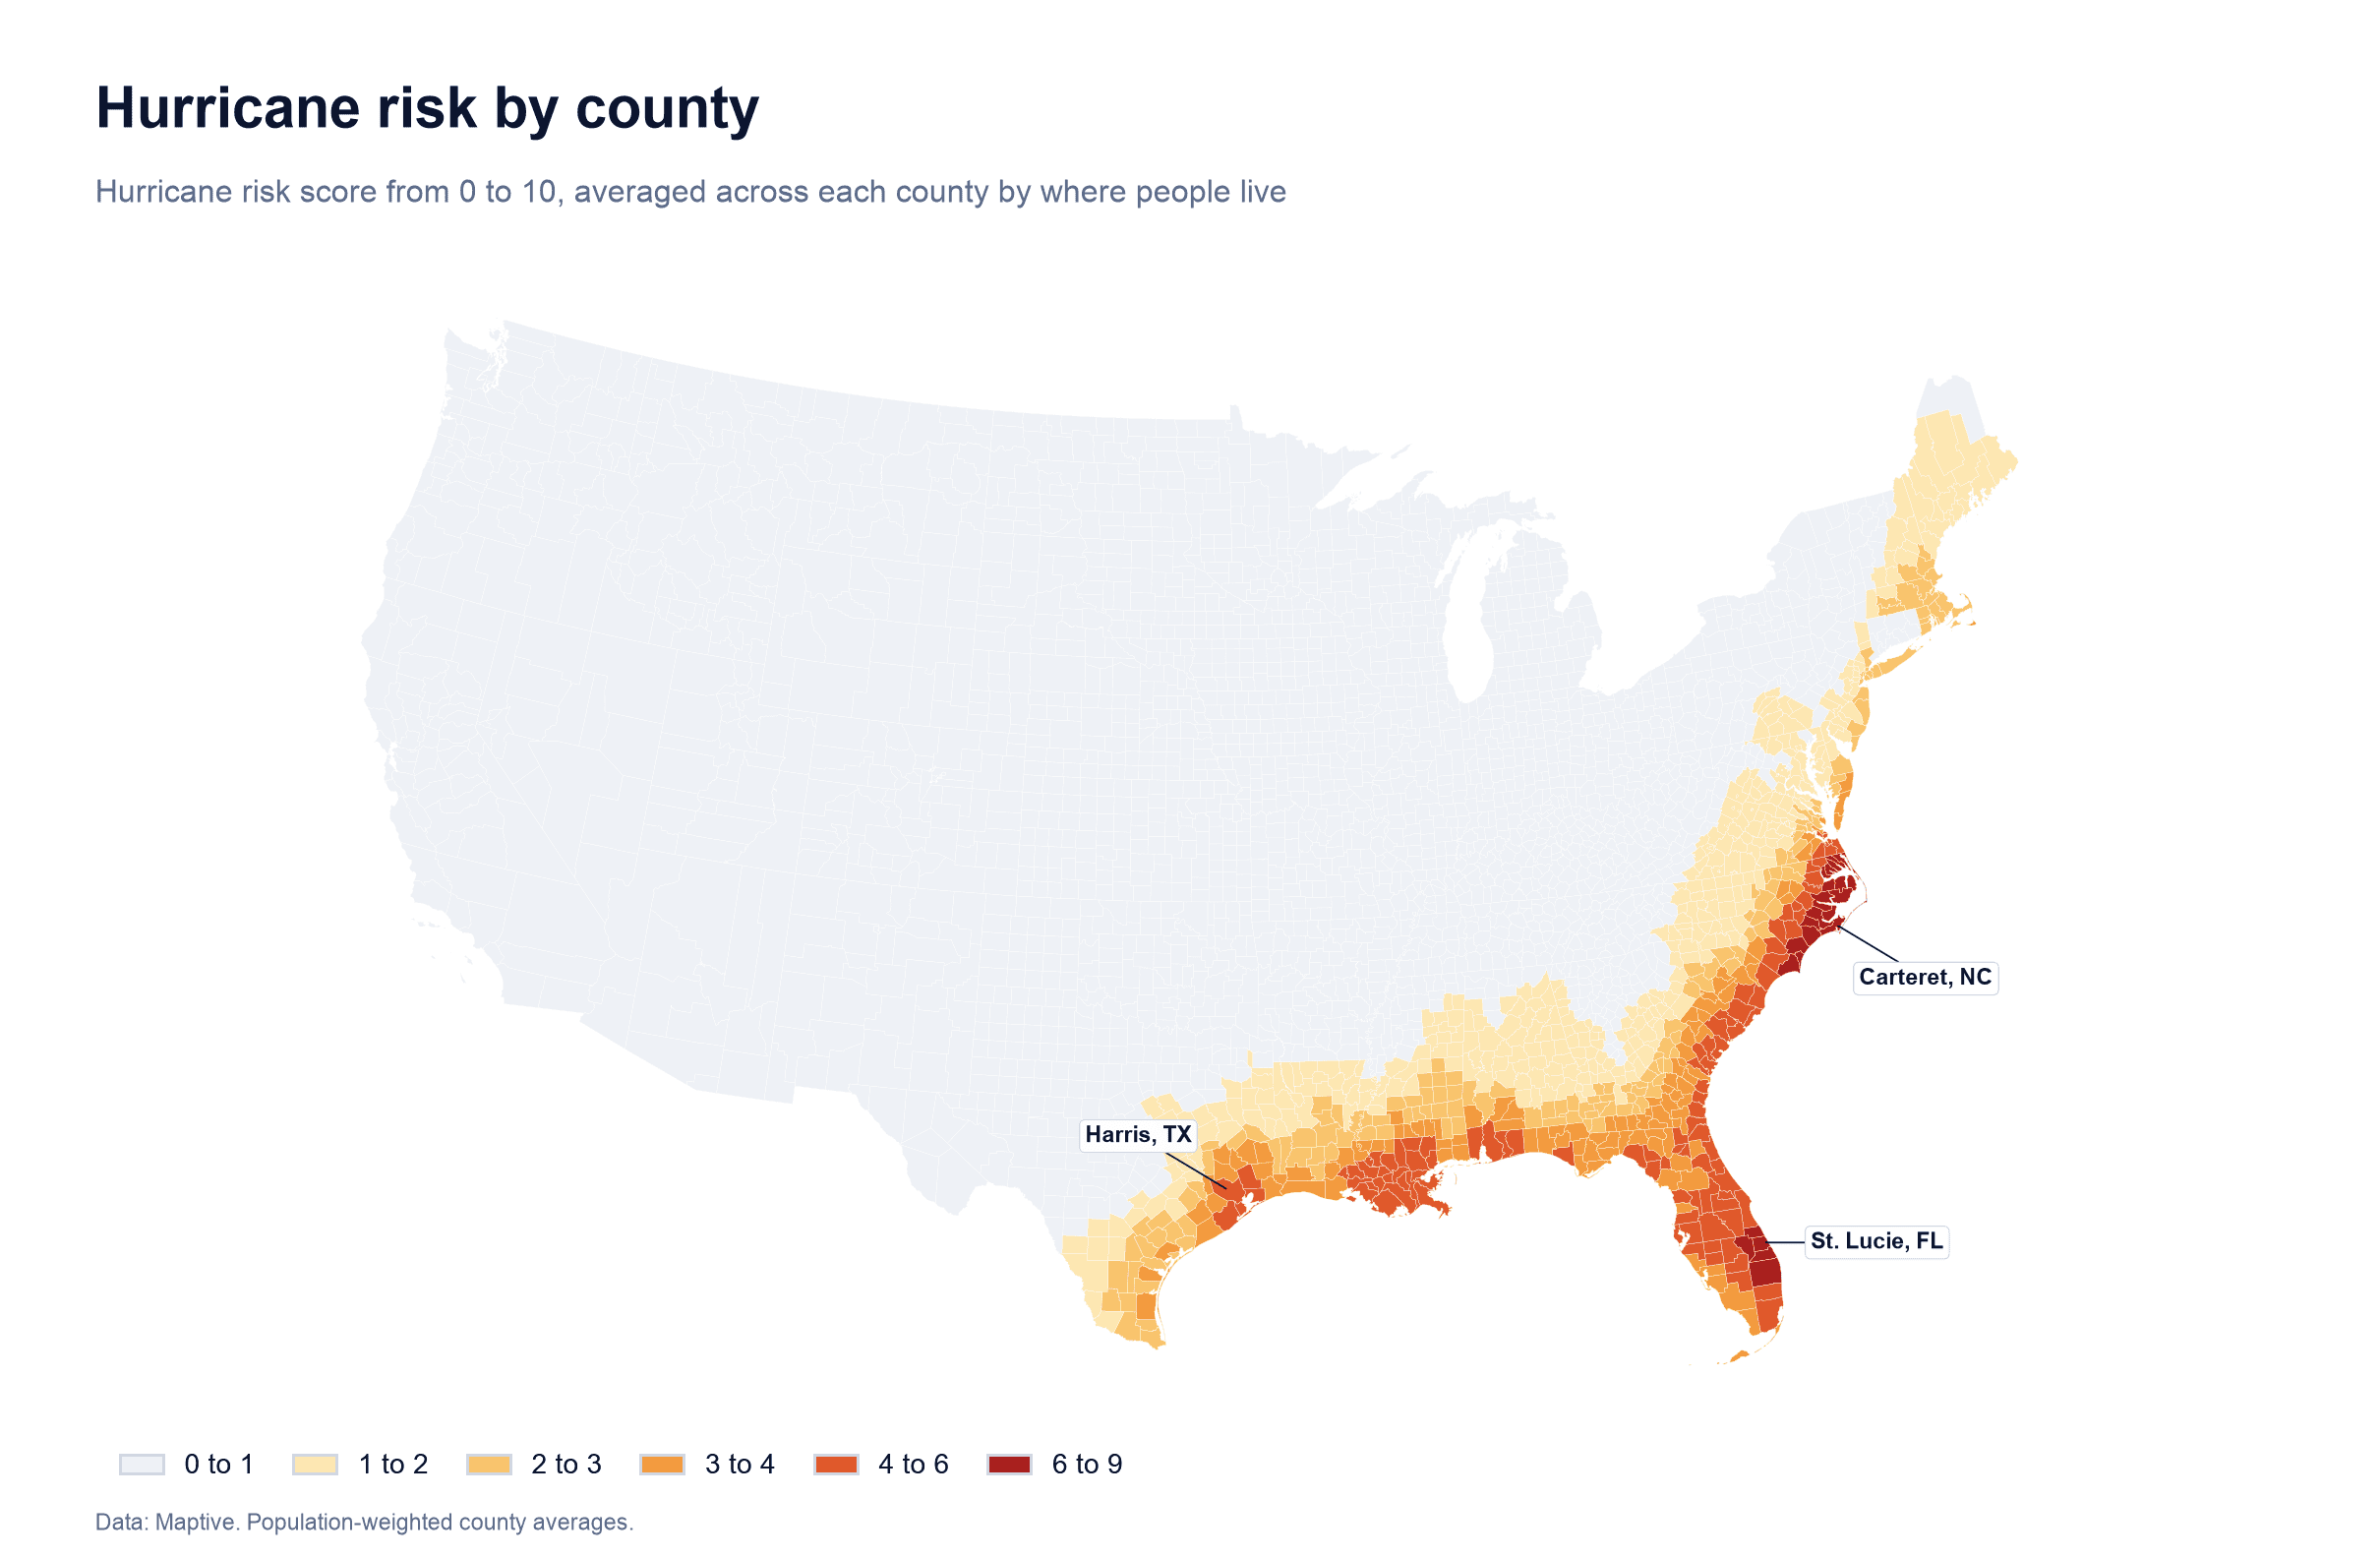
For this analysis, a county with a hurricane risk score of 3 or higher on a 0 to 10 scale counts as hurricane country. The score uses the area's past record of hurricanes and is averaged across each county based on where people live.
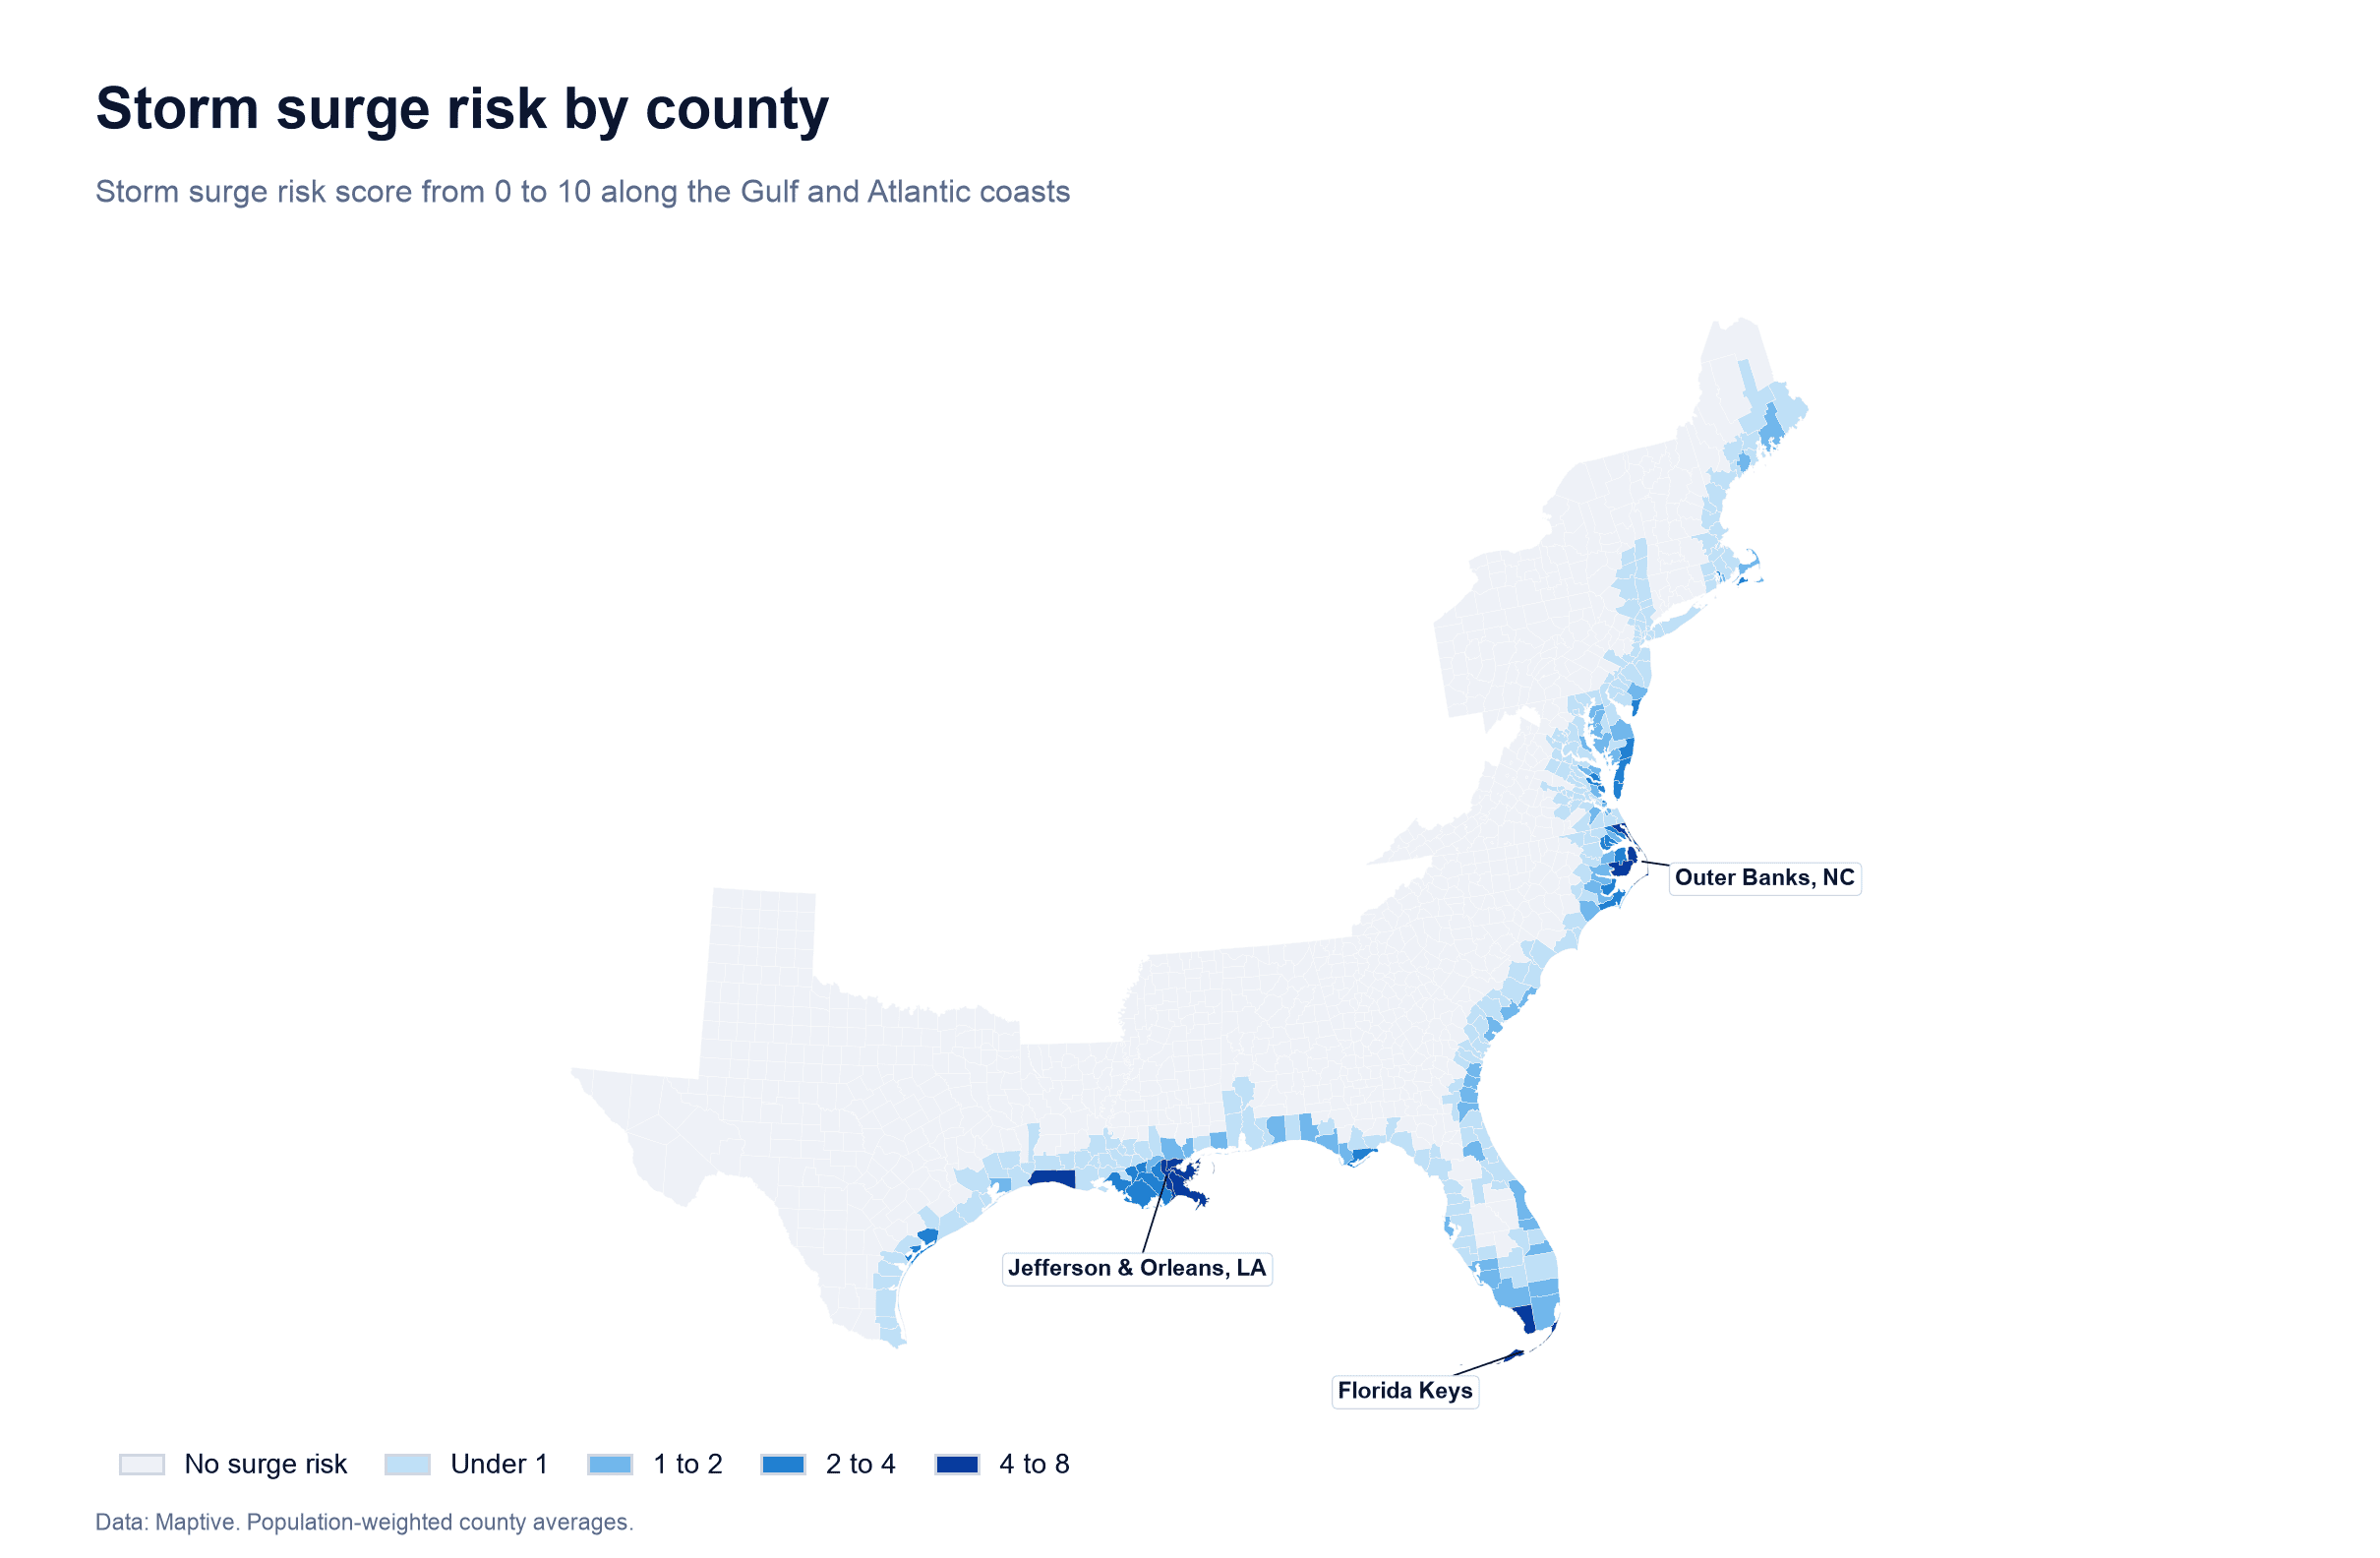
Storm surge is measured separately from hurricane risk. Hurricane winds and rain can reach a hundred miles inland. Storm surge is seawater pushed onto land by a storm and usually affects a narrow band along the coast. Surge risk measures exposure to that water, including whether a street might end up underwater.
Both scores are county averages and can hide differences within a county. A county with a moderate score can still have waterfront neighborhoods with far higher risk.
The fastest-growing high-risk counties
Among counties with at least 10,000 households and a hurricane risk score of 4 or more, these are growing the fastest.
| Rank | County | Hurricane risk (0 to 10) | Households in 2026 | Growth by 2031 |
|---|---|---|---|---|
| 1 | Liberty County, TX | 4.1 | 34,800 | 31.2% |
| 2 | Jasper County, SC | 4.7 | 15,100 | 21.5% |
| 3 | Chambers County, TX | 4.5 | 19,200 | 19.8% |
| 4 | St. Johns County, FL | 5.2 | 134,800 | 18.4% |
| 5 | Brunswick County, NC | 8.3 | 78,600 | 16.2% |
| 6 | Hendry County, FL | 4.8 | 15,400 | 15.6% |
| 7 | Berkeley County, SC | 4.8 | 103,200 | 14.9% |
| 8 | Lake County, FL | 4.5 | 186,200 | 14.7% |
| 9 | Pasco County, FL | 4.2 | 269,300 | 13.9% |
| 10 | Brazoria County, TX | 4.4 | 147,100 | 13.9% |
Liberty and Chambers counties are on the edge of the Houston metro, where new subdivisions have spread east toward the bay. Jasper and Berkeley counties are part of the growth spreading outward from Savannah and Charleston.
Only two US counties score higher on hurricane risk than Brunswick County, North Carolina. They are its neighbors, Carteret and New Hanover. Brunswick should still add about 12,800 households in five years.
Where the most new households are expected
Growth rates show where change is fastest. The number of new households shows where the most people are going. Among counties with a hurricane risk score of 4 or more, these will add the most households by 2031 if the projections hold.
| Rank | County | New households, 2026 to 2031 |
|---|---|---|
| 1 | Harris County, TX | 66,000 |
| 2 | Polk County, FL | 42,300 |
| 3 | Pasco County, FL | 37,500 |
| 4 | Lake County, FL | 27,300 |
| 5 | St. Johns County, FL | 24,800 |
| 6 | Horry County, SC | 23,000 |
| 7 | St. Lucie County, FL | 21,400 |
| 8 | Osceola County, FL | 20,600 |
| 9 | Brazoria County, TX | 20,500 |
| 10 | Manatee County, FL | 19,500 |
Seven of the ten counties are in Florida. The list includes coastal counties such as St. Johns, Horry and Brazoria, and inland counties such as Polk, Lake and Osceola. All have low storm surge exposure, with none scoring above 1 on storm surge risk.
Every Florida county is hurricane country
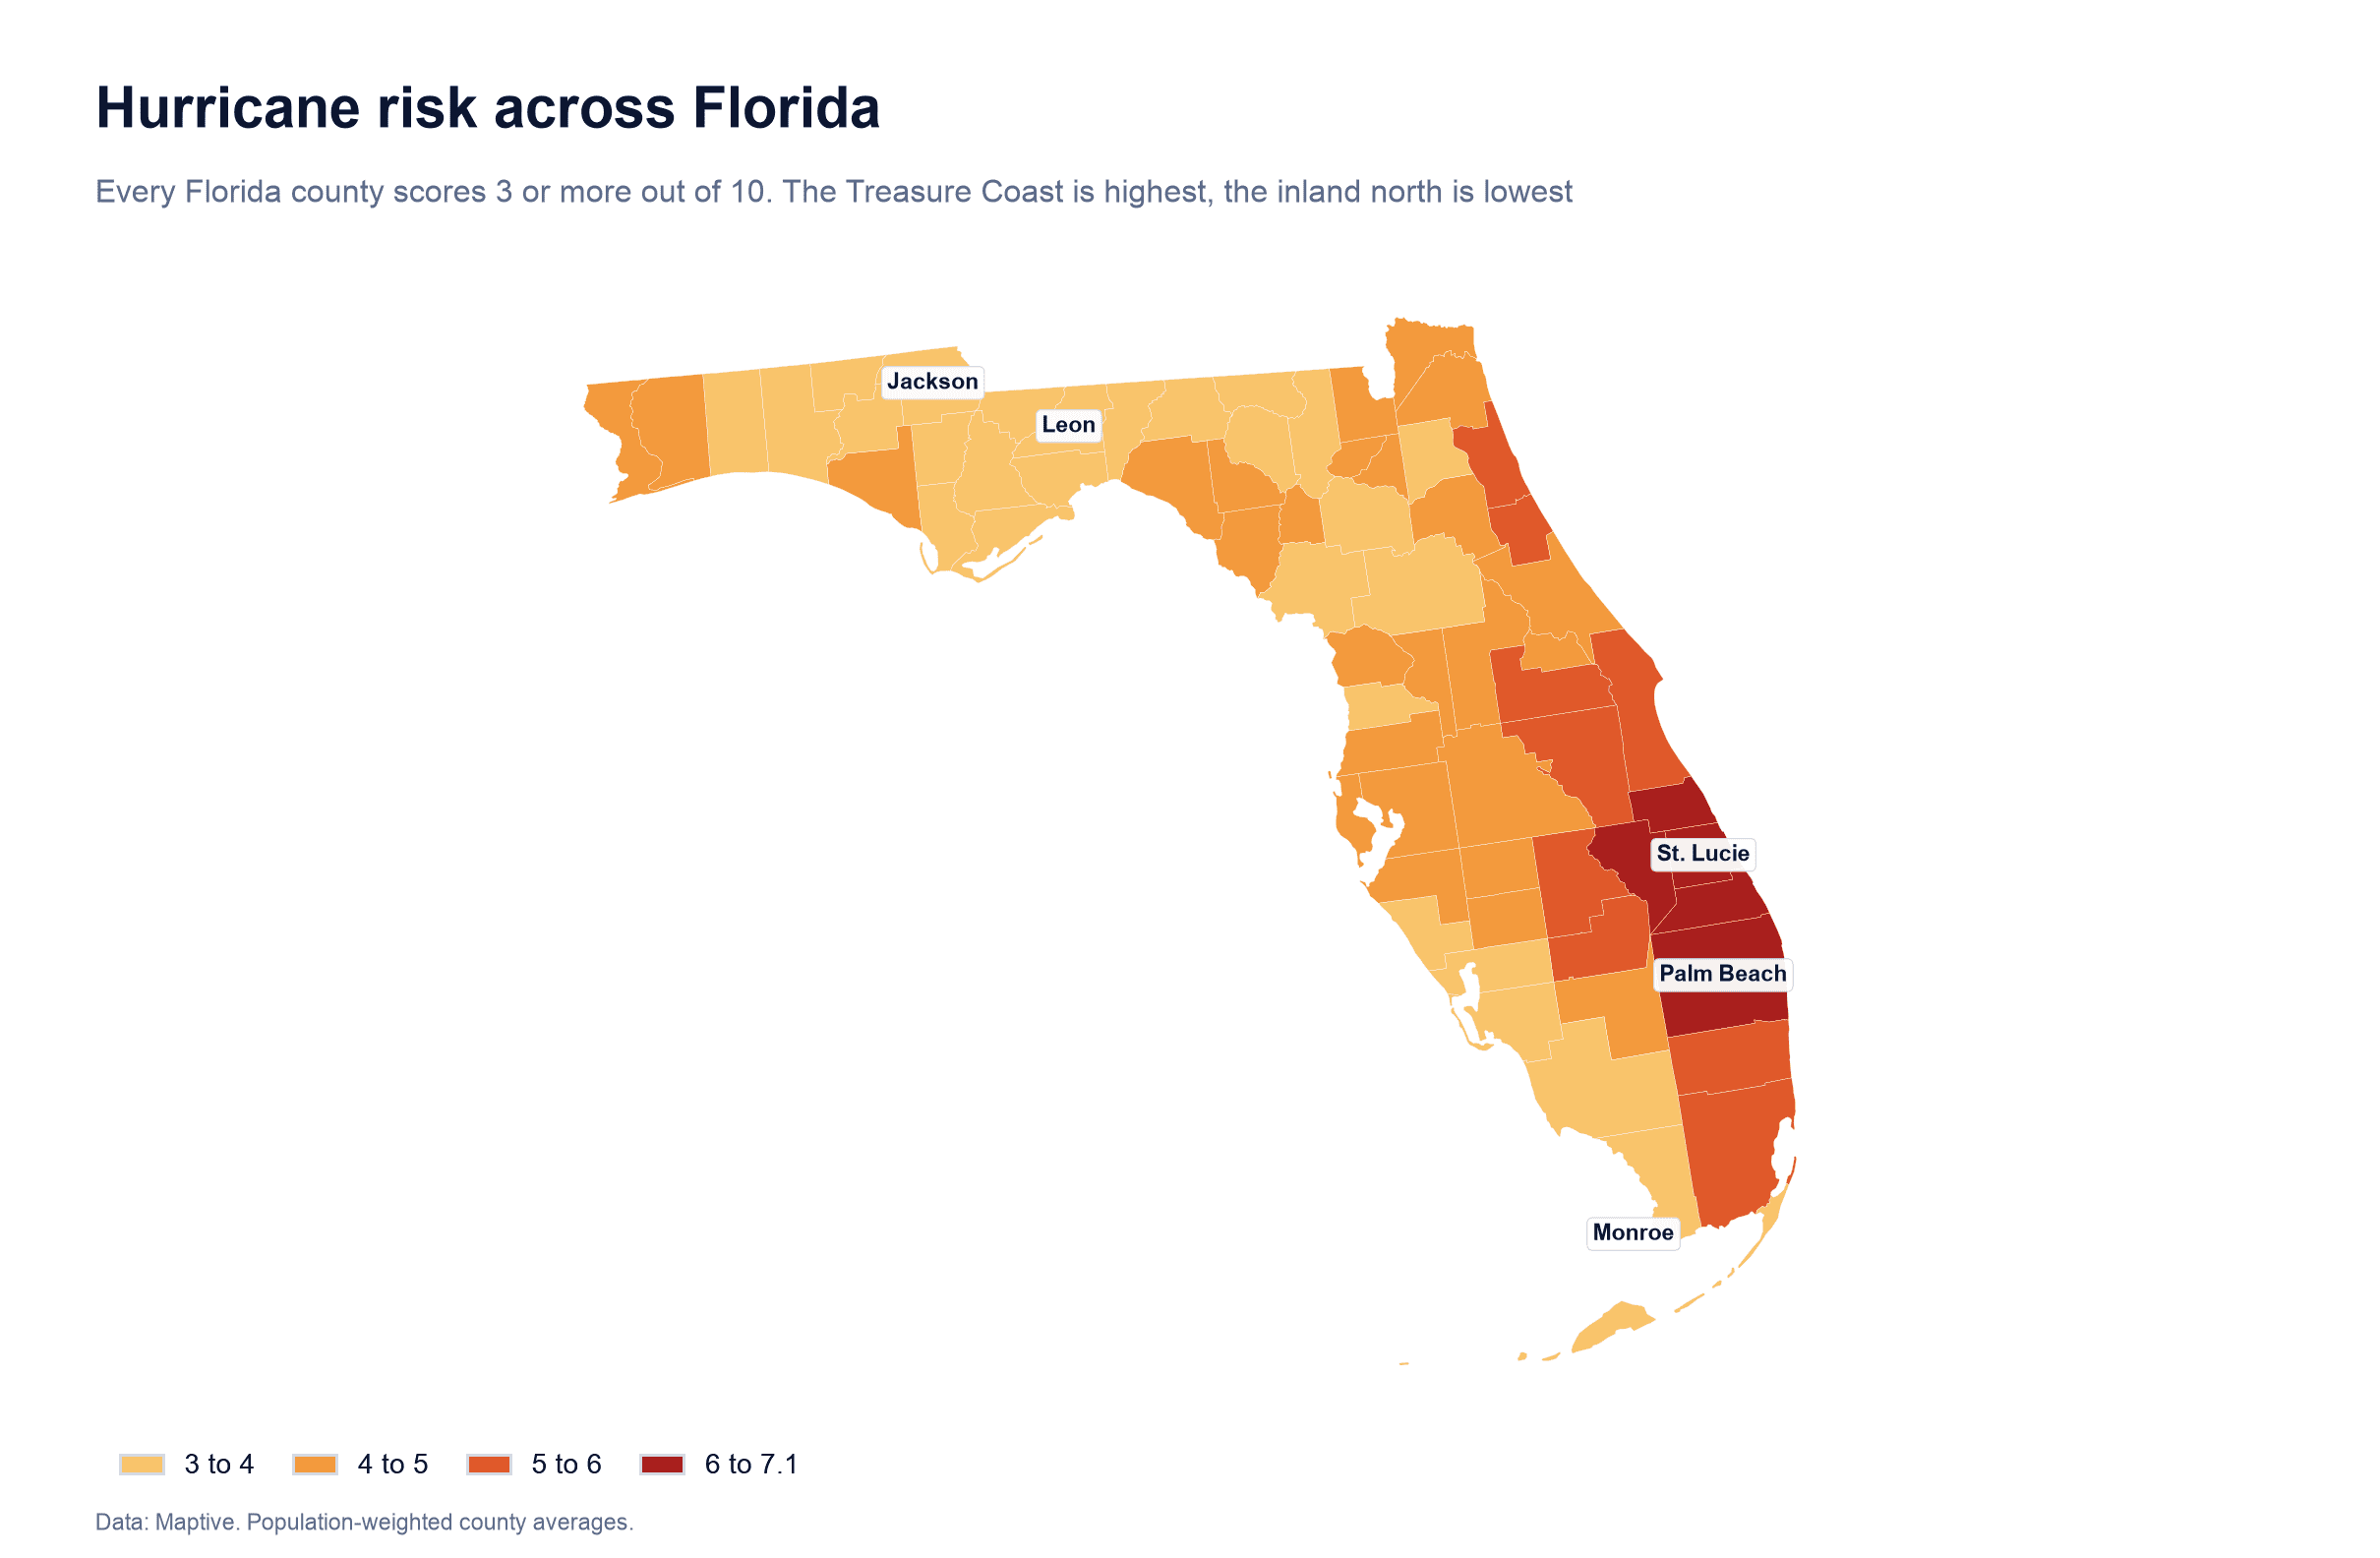
Florida is the only state where every county counts as hurricane country. All 67 counties score at least 3, and Florida has the highest average hurricane risk of any state after weighting the scores by where people live.
All of the roughly 228,000 households Florida should add by 2031 will be in hurricane-exposed counties. In South Carolina, the share is about 40%. In Texas, it is about 31%, or more than 210,000 households, because the state is growing so quickly overall.
North Carolina has the highest-risk individual counties in the US along its Outer Banks and southern coast. Most of its growth is inland around Raleigh and Charlotte. Only about 14% of its new households are headed for counties scoring 3 or more.
Household decline in storm surge counties
The trend reverses in counties exposed to storm surge. The 93 counties scoring 1 or more on storm surge risk should lose about 0.9% of their households by 2031, while the rest of the US grows.
Some of the steepest declines are in places with very expensive homes. Among surge-exposed counties with at least 5,000 households, these have the highest median home values.
| County | Median home value | Storm surge risk (0 to 10) | Household change by 2031 |
|---|---|---|---|
| Nantucket County, MA | $1,655,000 | 1.2 | +1.3% |
| Dukes County, MA | $1,228,000 | 2.4 | -1.0% |
| San Juan County, WA | $797,000 | 2.2 | -1.1% |
| Monroe County, FL | $778,000 | 5.0 | -9.3% |
| Barnstable County, MA | $691,000 | 1.3 | -3.7% |
| Newport County, RI | $658,000 | 1.2 | -3.5% |
| Collier County, FL | $635,000 | 1.1 | -1.0% |
Monroe County, which covers the Florida Keys, should lose about one in eleven households. Jefferson and Orleans parishes in Louisiana have the highest storm surge scores nationwide. Both should shrink, by about 5% and 7%, respectively.
High prices, insurance costs and limited room to build likely play a part in those figures. Whatever the mix, the direction is consistent. People are still moving toward the coast, but fewer are moving onto it.
Fast-growing low-risk counties in hurricane states
The fastest growth in the Gulf and South Atlantic states is inland. Among counties in those states with at least 10,000 households, a hurricane score under 1 and no storm surge exposure, these should grow fastest.
| Rank | County | Growth by 2031 |
|---|---|---|
| 1 | Kaufman County, TX | 47.2% |
| 2 | Jackson County, GA | 28.2% |
| 3 | Dawson County, GA | 27.8% |
| 4 | Caldwell County, TX | 24.4% |
| 5 | Parker County, TX | 23.7% |
Kaufman County, east of Dallas, is projected to grow faster than any other county of its size in the US. Jackson and Dawson counties are on the northern edge of metro Atlanta, and Caldwell County is part of the growth spreading south and east from Austin.
What this means for businesses
Businesses that serve homes and families face both a planning problem and an opportunity as people move into hurricane country. More households in exposed counties mean more roofs to repair, air conditioners to replace after outages, claims to process and people who need care when a storm passes through.
Businesses can consider which service areas are adding the most homes and how exposed those areas are. They can check whether their crews, branches and inventory are where growth is going or where it was ten years ago. If they are expanding, they can compare a fast-growing coastal county with a fast-growing inland county that has a fraction of the risk.
Restoration, roofing and HVAC companies can add staff in fast-growing exposed counties before the season starts. Insurers and lenders can watch places where exposure and growth are rising together. Retail and franchise brands moving into the Southeast can compare coastal markets with inland ones such as Kaufman or Jackson counties before they commit to a lease.
Businesses can map household growth, hurricane risk, storm surge risk and home values at the county, ZIP code or neighborhood level with their own customer and location data. The map turns a national trend into specific places to act on.
The move into hurricane country is not slowing. Price, climate and where new homes get built are driving it. So far, the numbers show people accepting hurricane risk while avoiding storm surge exposure.
Frequently asked questions
Which US county has the highest hurricane risk?
On the 0 to 10 scale used here, Carteret County, North Carolina scores highest at about 9.0, followed by New Hanover and Brunswick counties, also in North Carolina.
Which state has the highest hurricane risk?
Florida has the highest average hurricane risk when scores are weighted by where people live. It is the only state where every county scores 3 or more. North Carolina has the highest-scoring individual counties.
What is the difference between hurricane risk and storm surge risk?
Hurricane risk reflects how often hurricanes strike an area and how severe they tend to be. That risk can extend far inland. Storm surge risk measures exposure to seawater pushed ashore by a storm and is usually limited to a narrow coastal band.
Which county is growing fastest overall?
Among counties with at least 10,000 households, Kaufman County, Texas has the fastest projected growth between 2026 and 2031, at about 47%.
Are people moving away from the coast?
Growth remains strong in coastal states and hurricane-exposed counties. Counties with storm surge exposure are losing households as a group.
How can I get hurricane, storm surge and household growth data for my own area?
The data is available in Maptive. You can map hurricane and storm surge risk scores, along with tornado, hail, wind, wildfire and earthquake risk, with current household estimates, five-year household projections and median home values. The data goes down to states, counties, ZIP codes, cities, census tracts and block groups. You can display it on the same map as your customers, locations and territories.