


Marker Grouping Tool
Marker Grouping Tool: Color-Code Map Pins by Any Data Column
Group every pin on your map by any column in your file so each distinct value sits in its own bucket. Toggle a group off in the legend to focus the map on the rows that matter.
No credit card required
Trusted by teams at
















How to Group Map Markers by a Data Column in 3 Steps
Pick a column and Maptive splits your pins into a Primary Group. Layer a Secondary Group on top to bring in a second column.
01
Open the Grouping Tool
Open Map Tools from the side panel of your Maptive map, then click the Grouping Tool / Colored Pins Tool from the list.
02
Pick a Column as the Primary Group
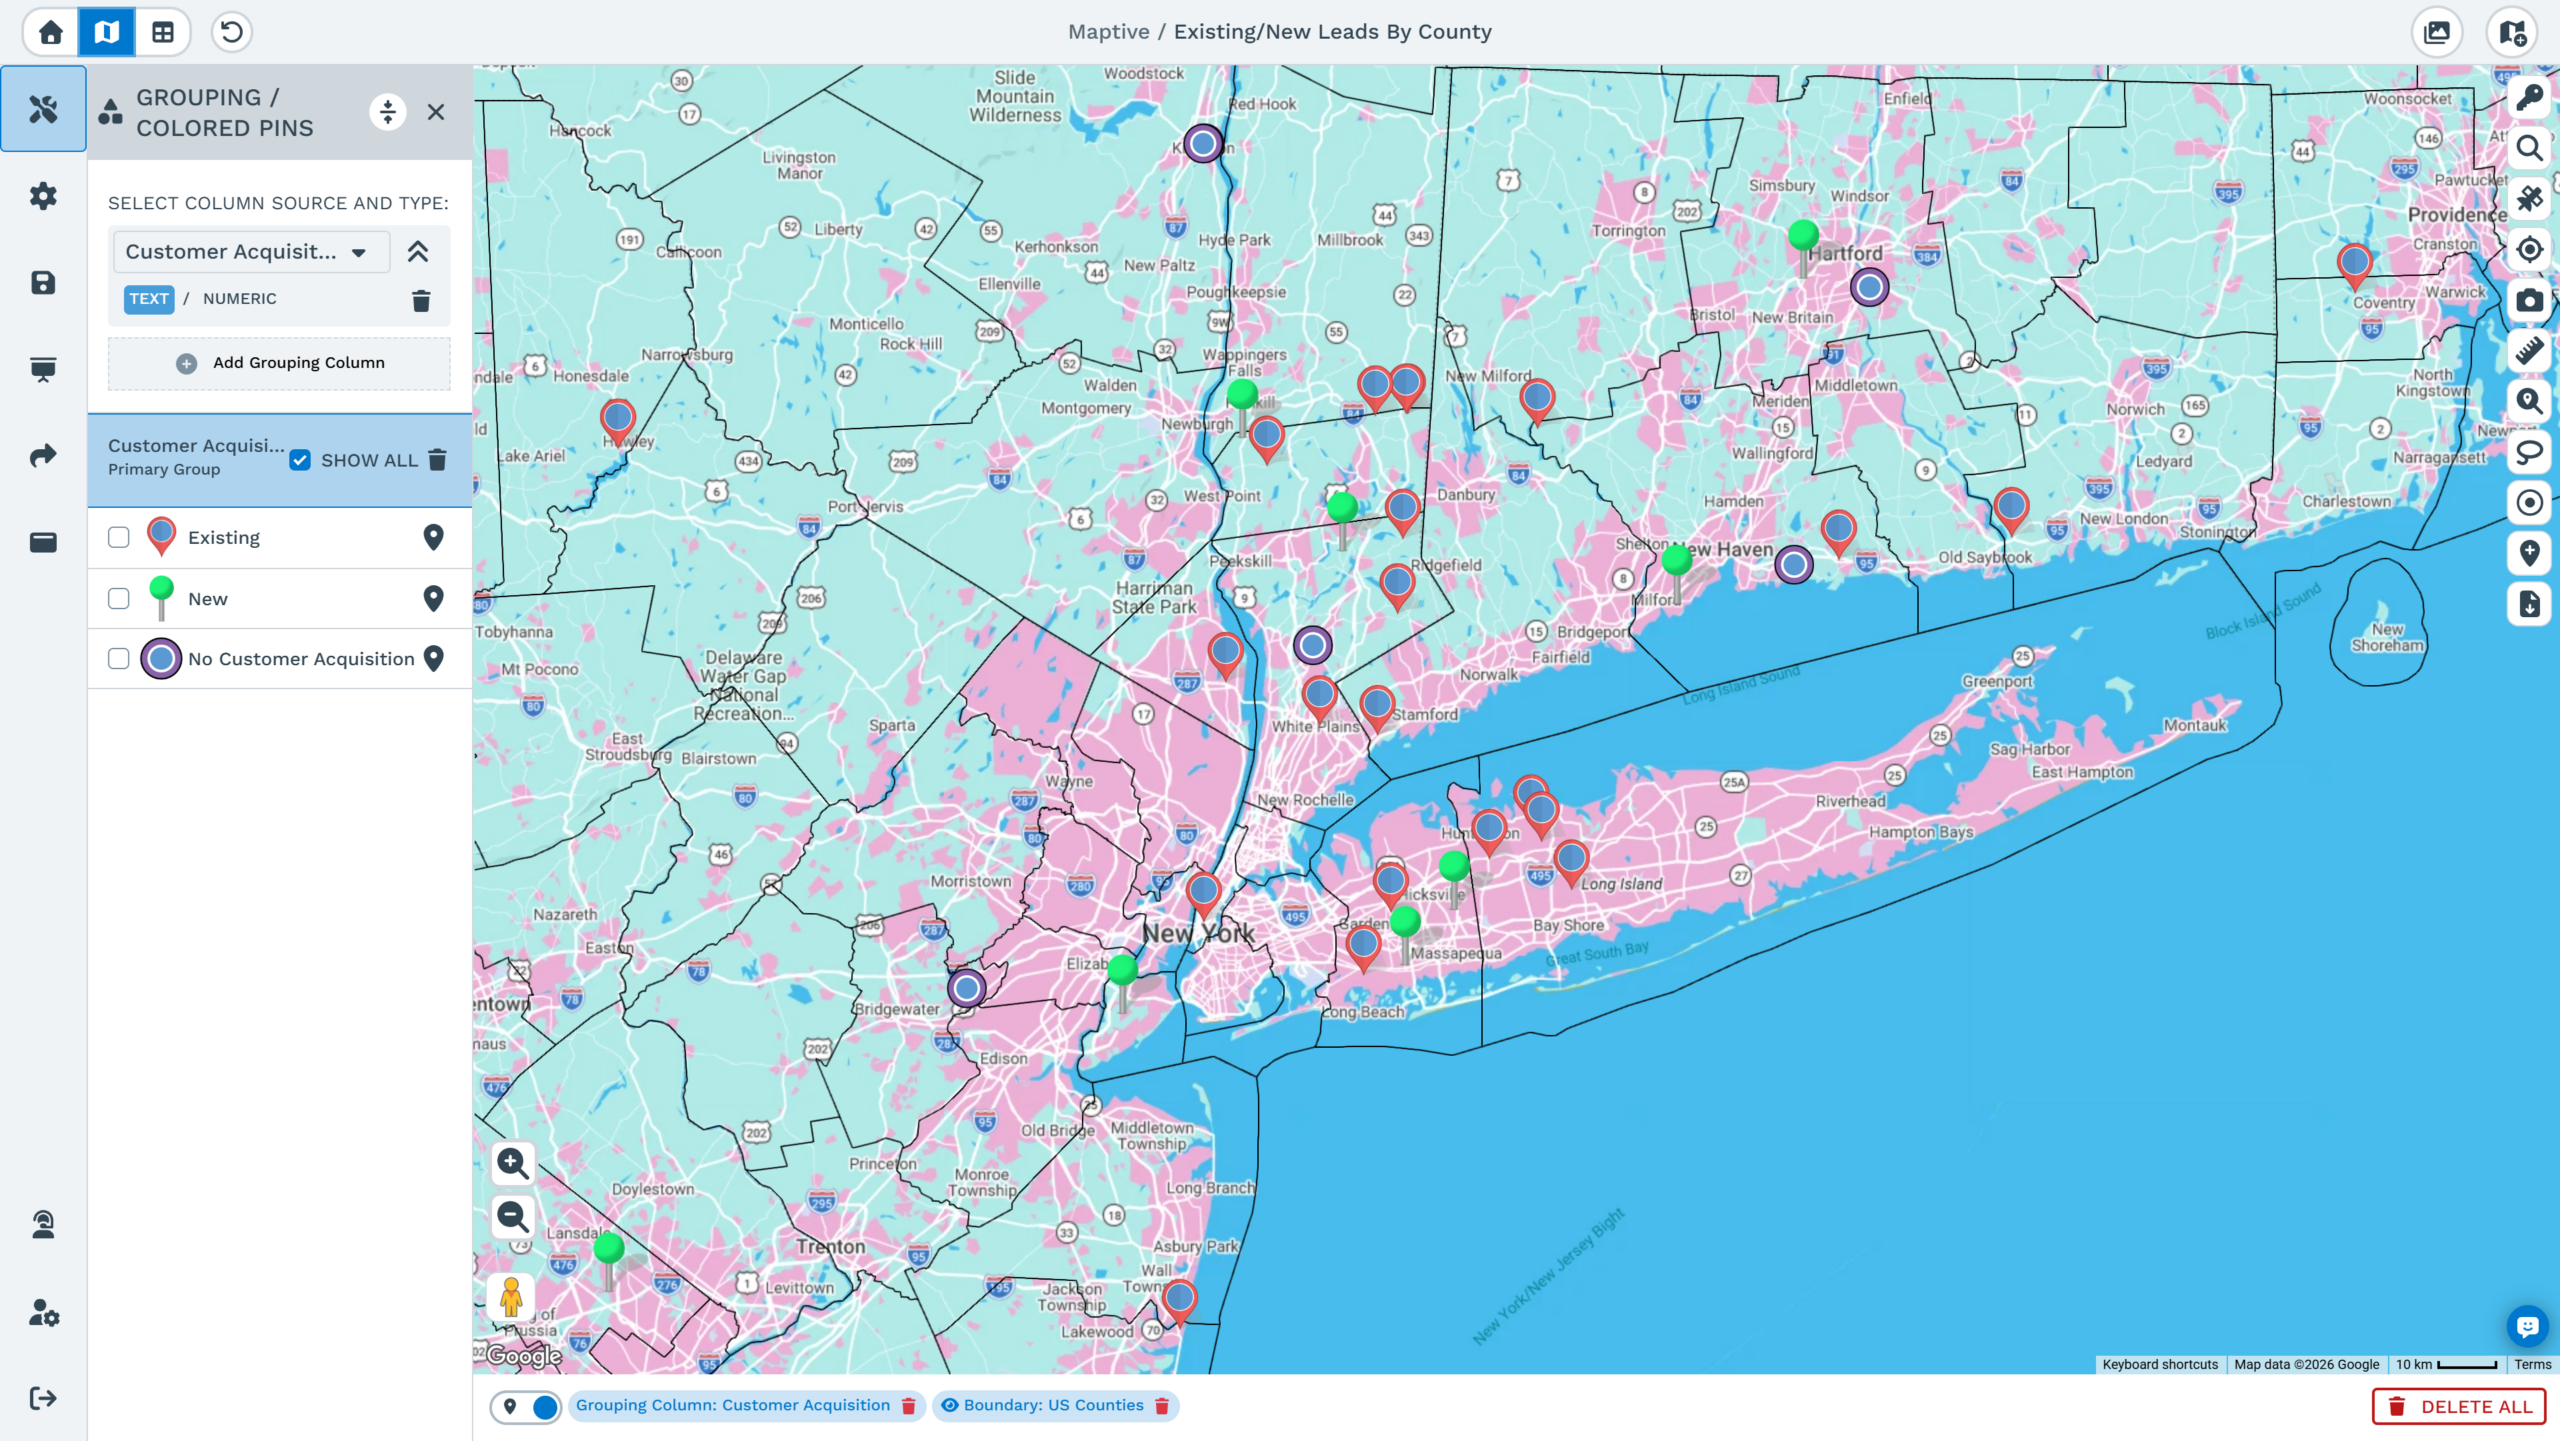
Pick a column from your data set as the Primary Group, and Maptive splits the pins into a group for every distinct value in that column.
03
Toggle Groups to Focus the Map
A grouped map appears alongside a clickable panel. Each group is listed by its value, and switching one off narrows the map to the rows you care about.
What the Grouping Tool Panel Controls
Every control below lives in the same panel, so a grouped map can be adjusted without rebuilding it or reloading your file.
Primary Group: Split Pins by One Column
Pick a column from your data set as the Primary Group, and Maptive splits every pin into a group for each unique value found across the matching rows.
Secondary Group: Add a Second Column on Top
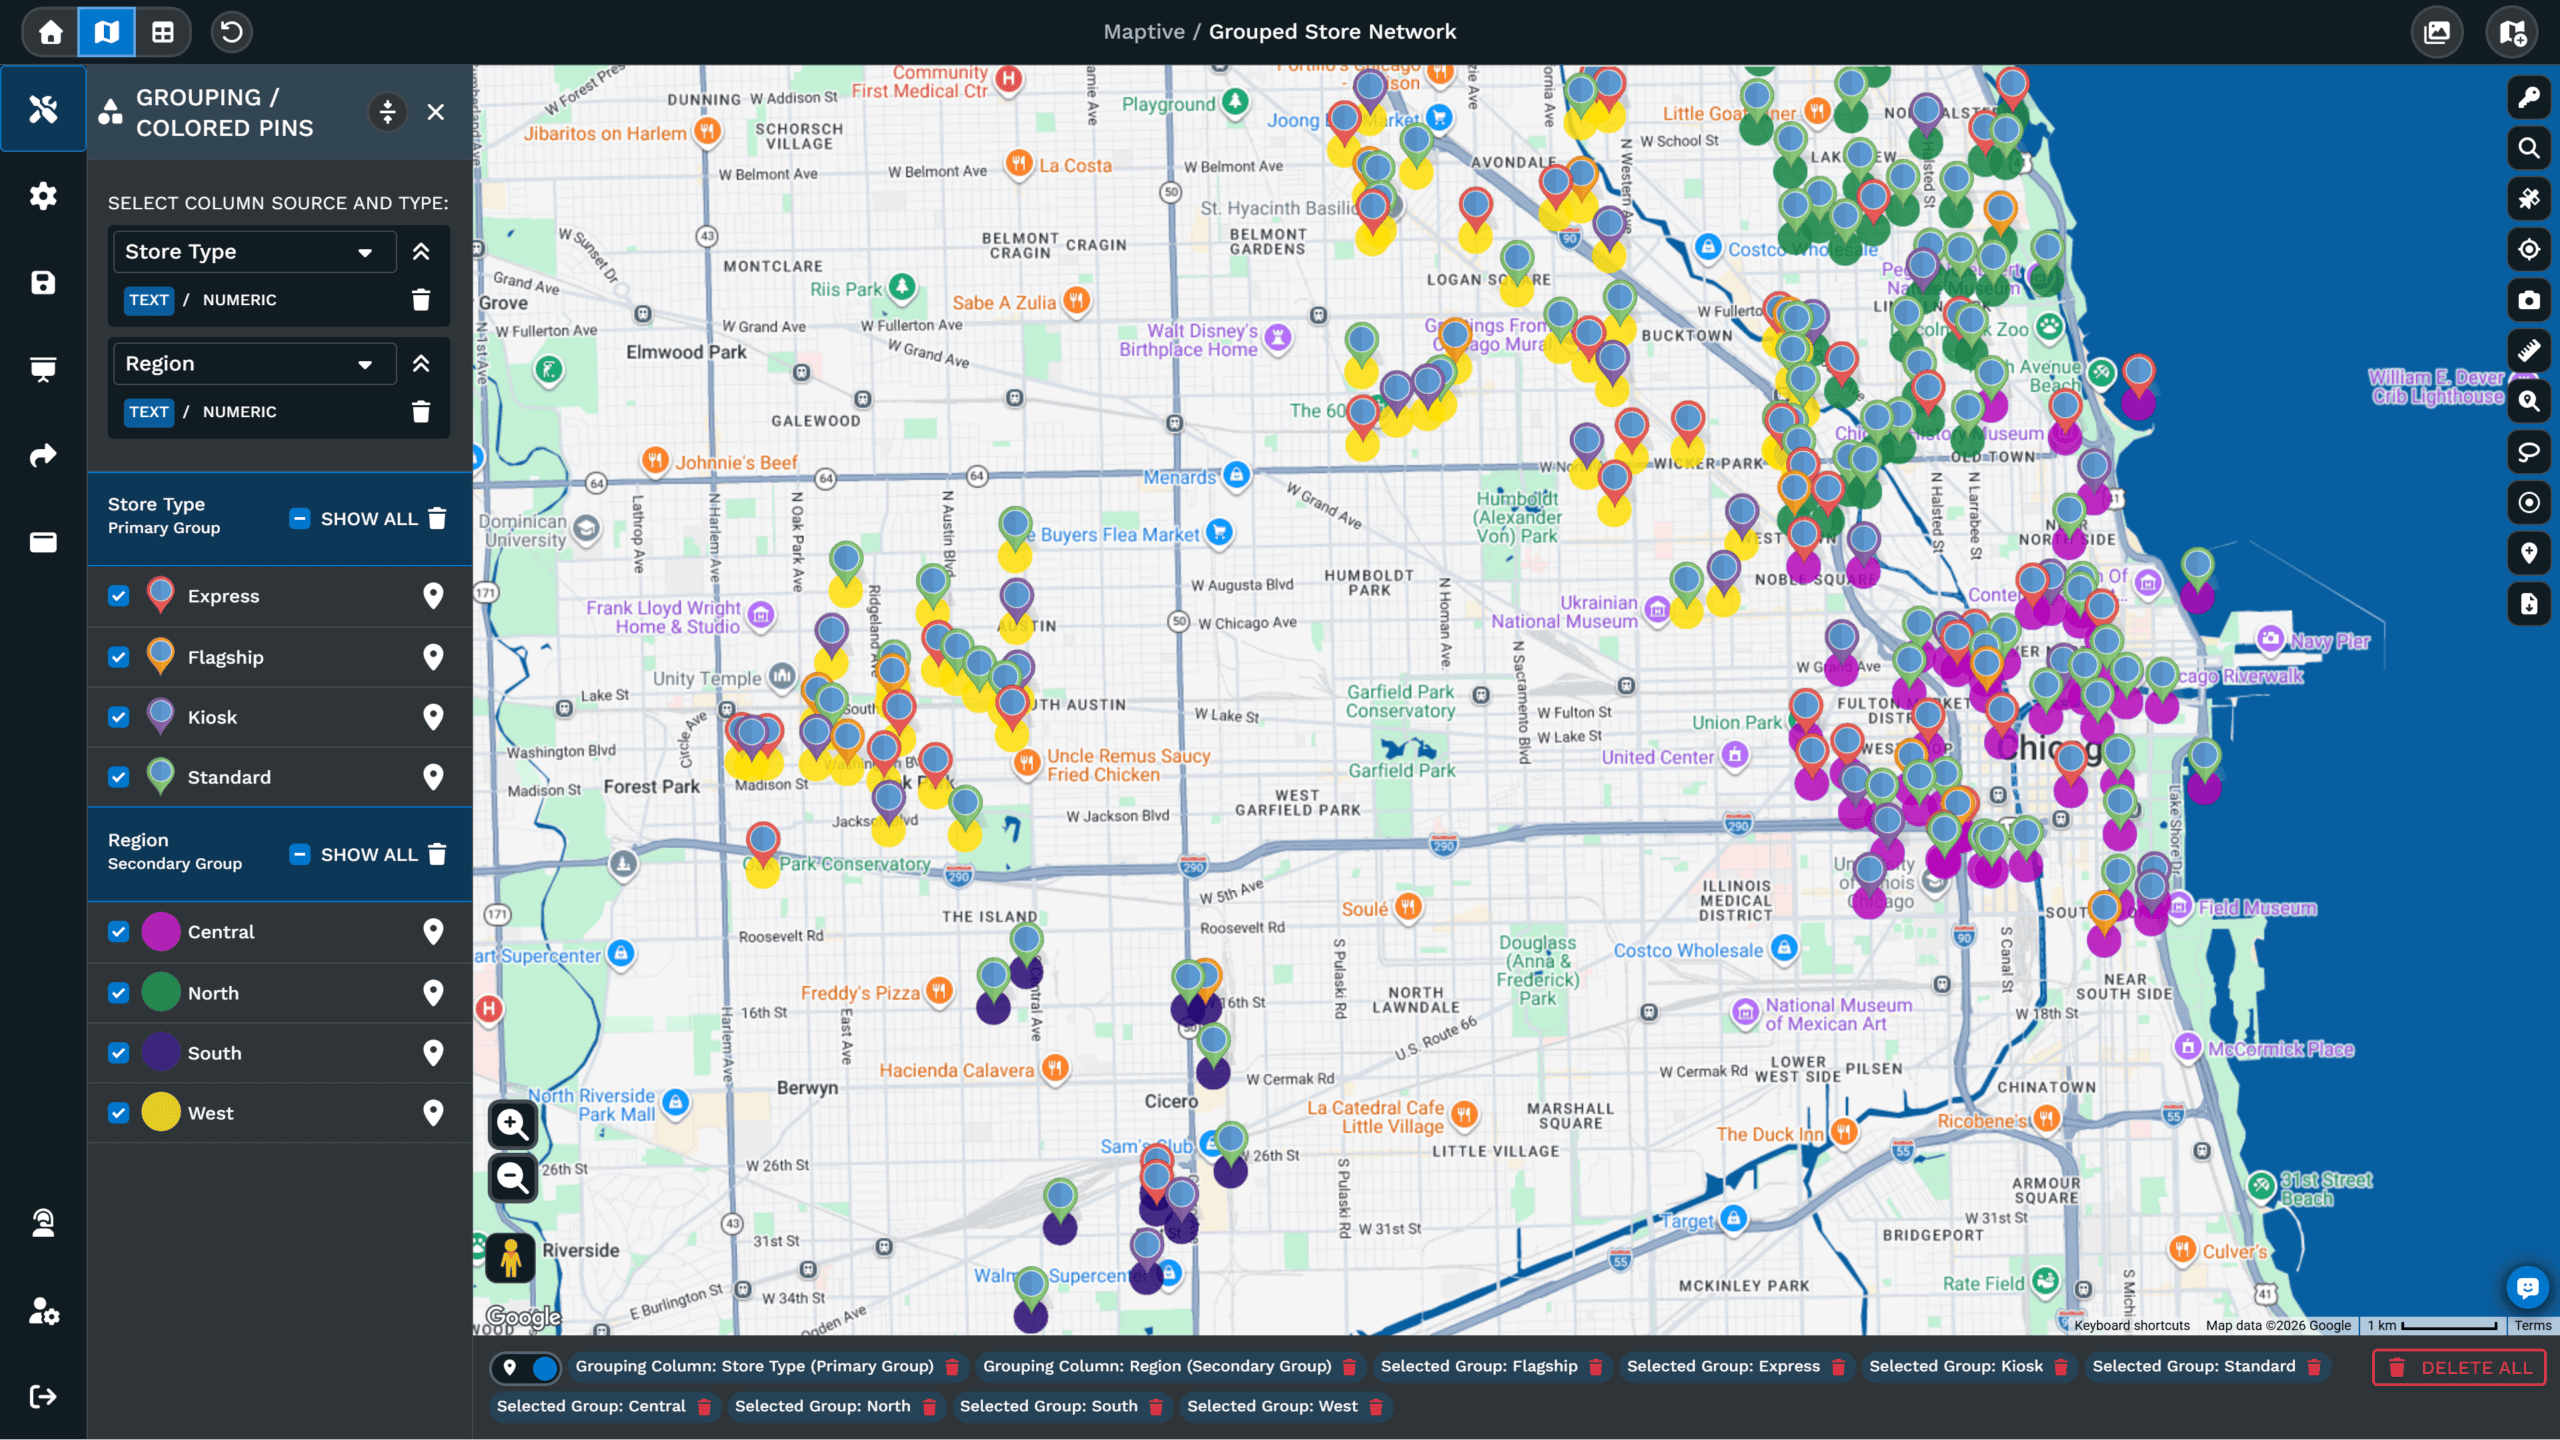
Add a second column as the Secondary Group on the same view, so each pin carries two group signals without running the tool again from scratch.
Numeric Ranges: Bucket a Number Column
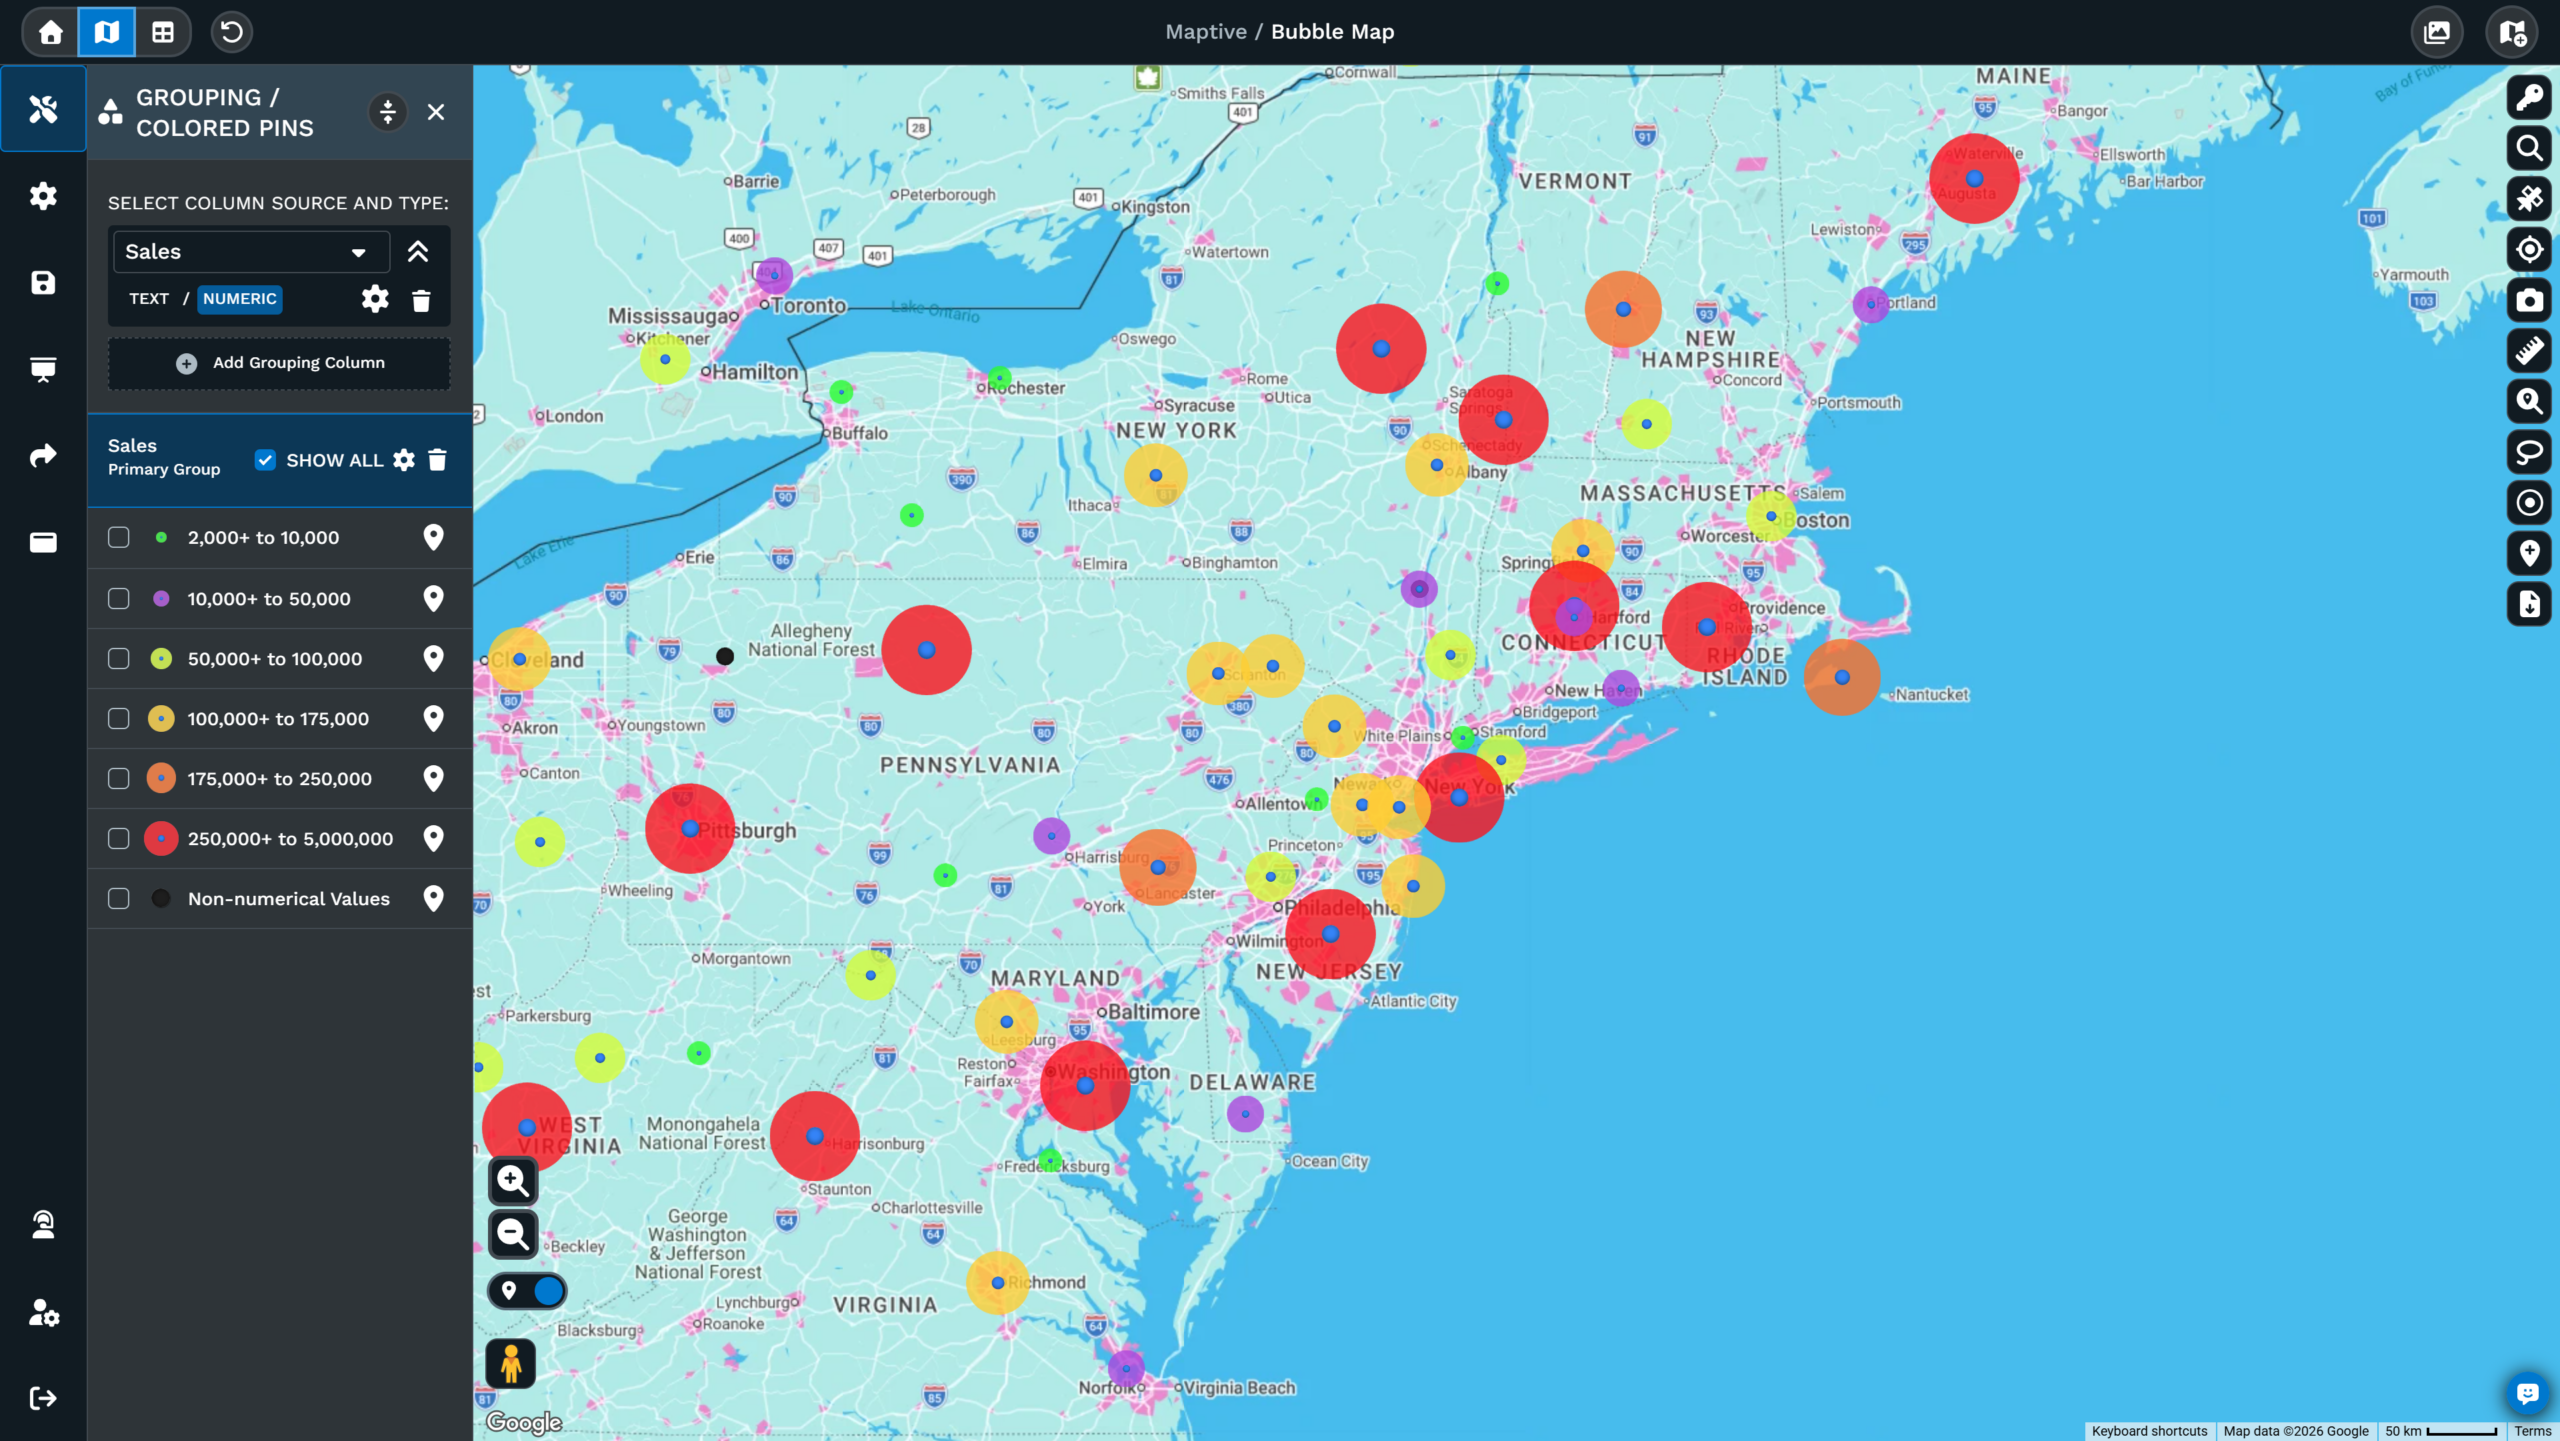
Switch a number column to Numeric and the popup lets you choose how many ranges to use, group by percentages or by number ranges, and pick a marker style.
Per-Group Settings: Style One Group at a Time
Click the small white icon to the right of a group to open the picker and set the marker style for that group across every pin tied to the value.
Legend Toggles: Show or Hide Any Group
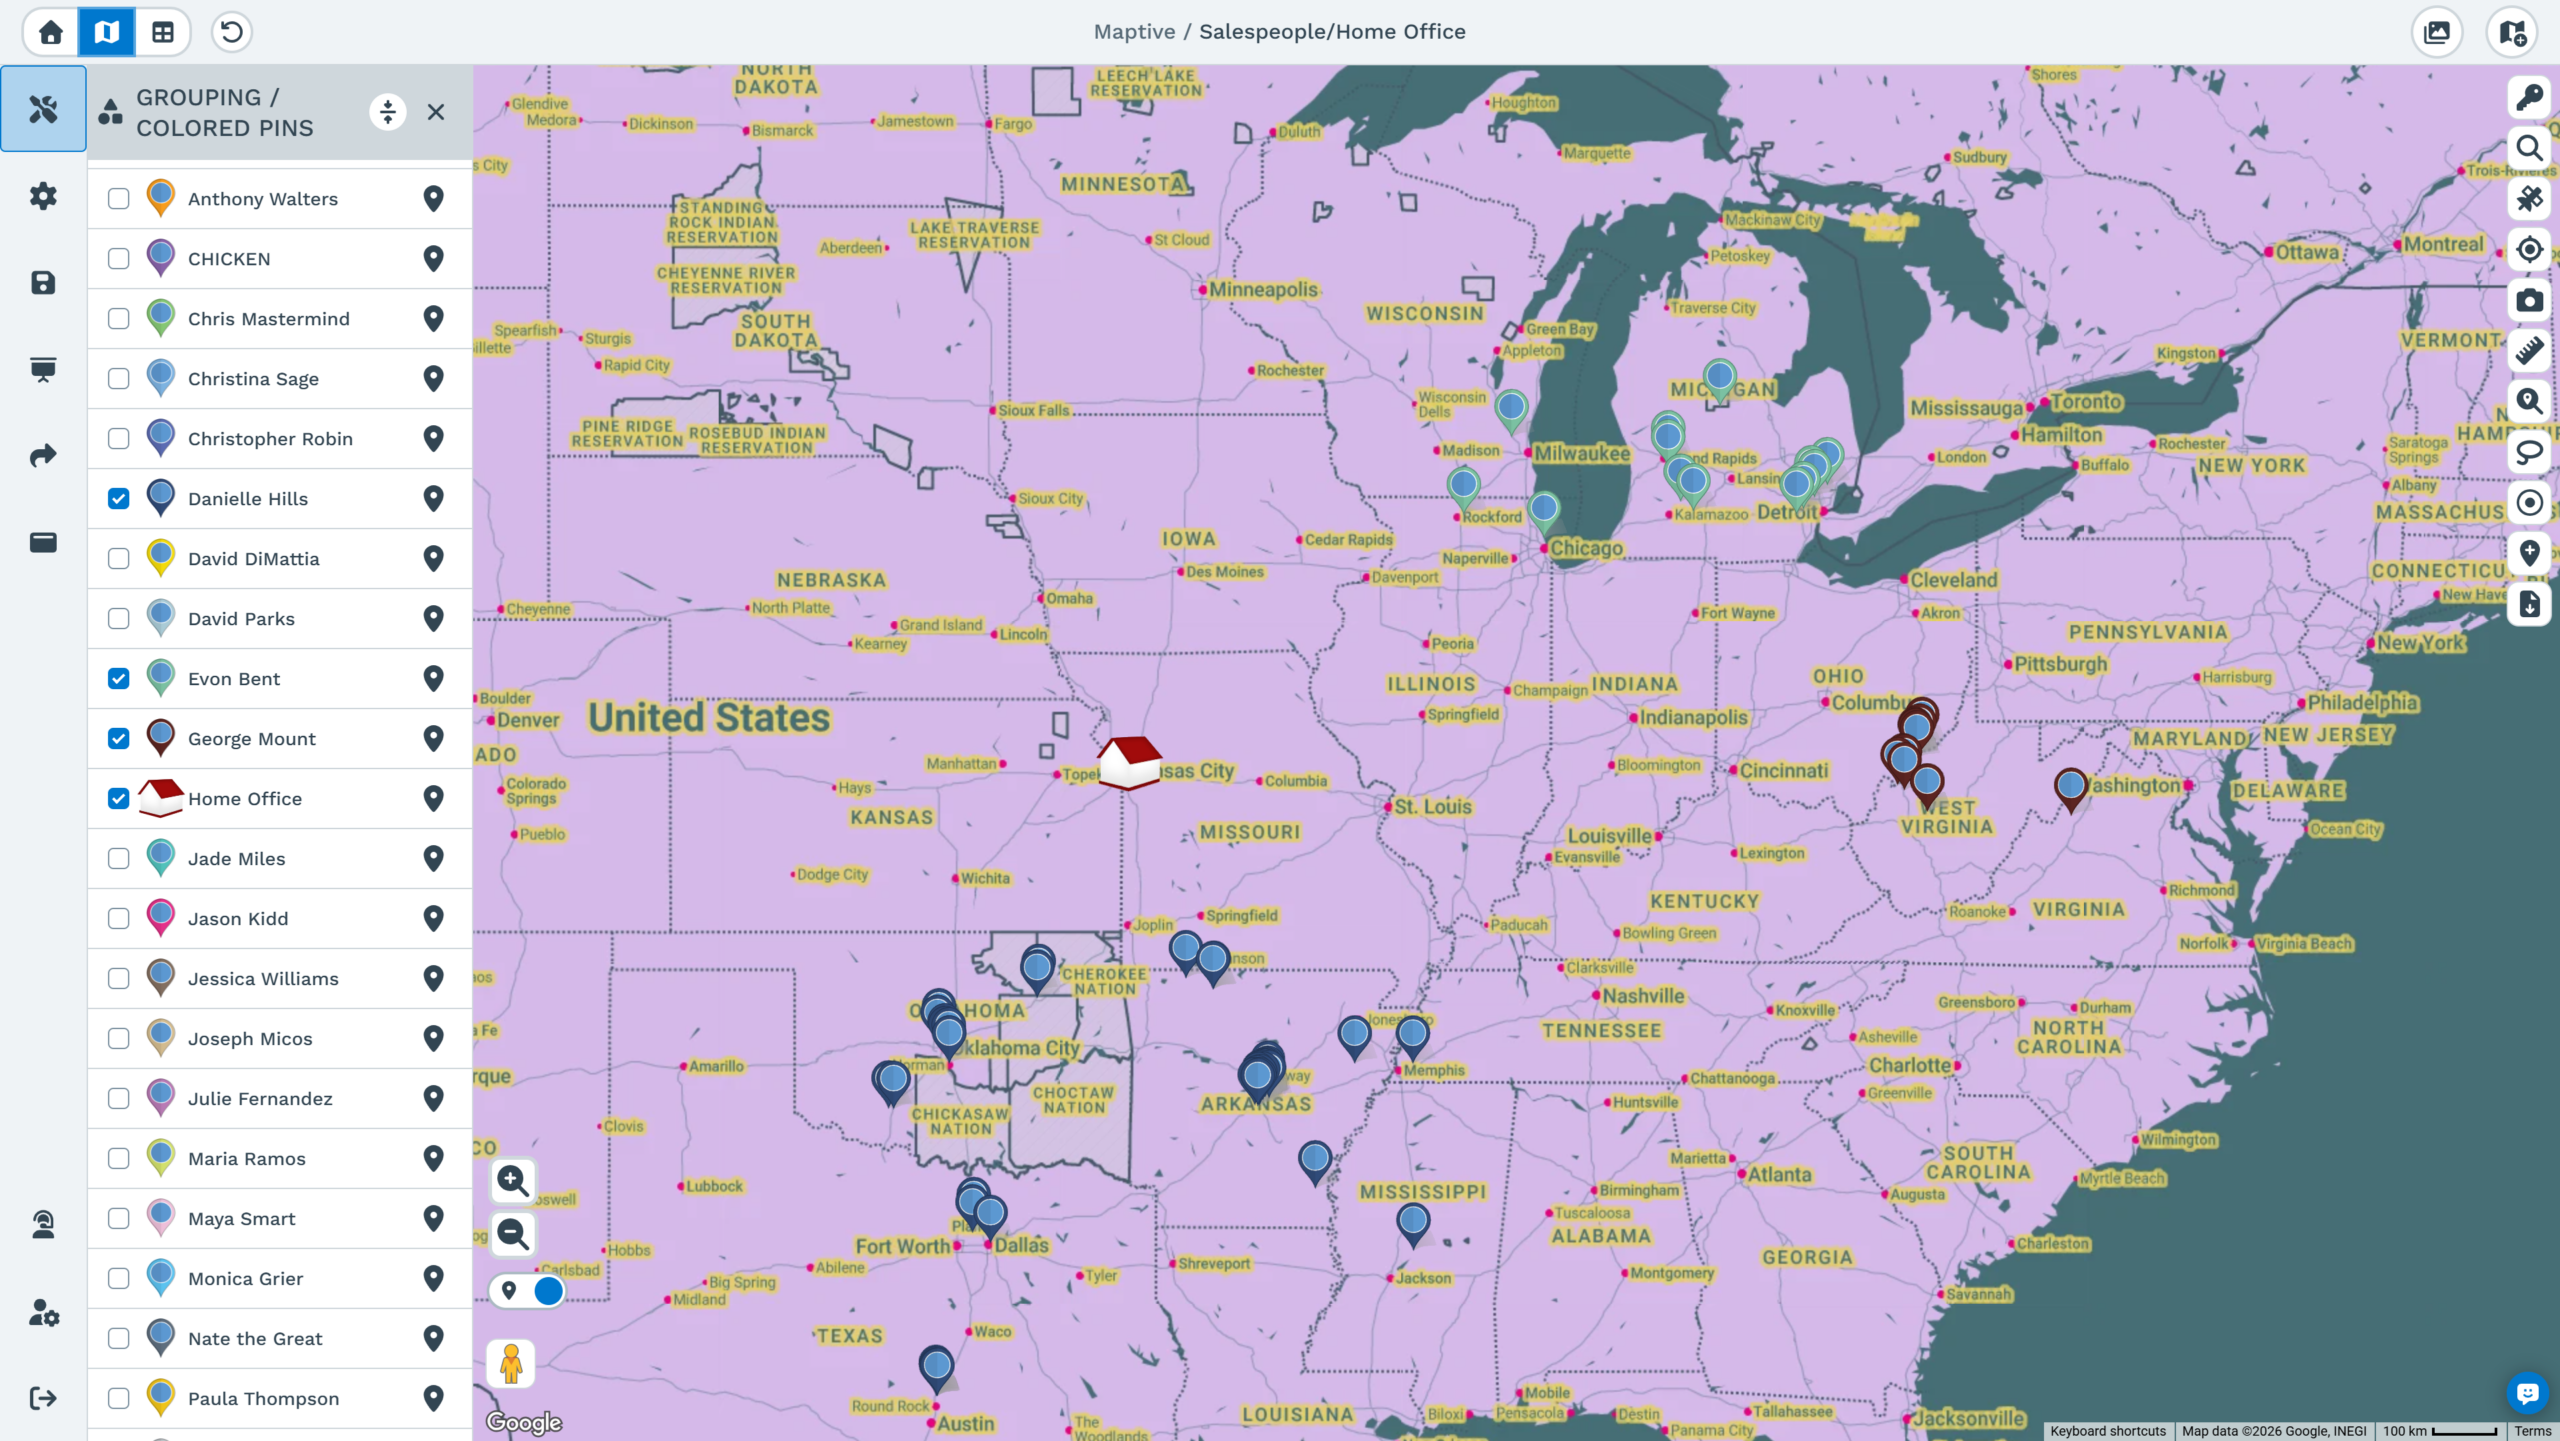
Select or deselect any Primary or Secondary group from the panel to hide or show that slice of the map and isolate the rows you want.
Group Filtering: Narrow the Map Without a Filter Step
Untick a group in the panel and Maptive removes that slice from the map while the rest of the grouped pins stay exactly where they are.
How to Filter, Style, and Zoom a Grouped Map
A grouped map carries every slice on screen by default. The panel inside the Grouping Tool doubles as the filter, the style editor, and the navigation for each group.
Isolate a Single Group in Two Clicks
Each group sits in the panel with a checkbox that controls the visibility of every pin tied to that value. Switching a group off hides those pins while the rest of the grouped map stays in place, and switching it back on returns them. Untick everything except the slice you want and the map narrows to those rows immediately, which is how a specific rep, status, or category gets isolated for a single question.
Set Color, Shape, and Custom Icons per Group
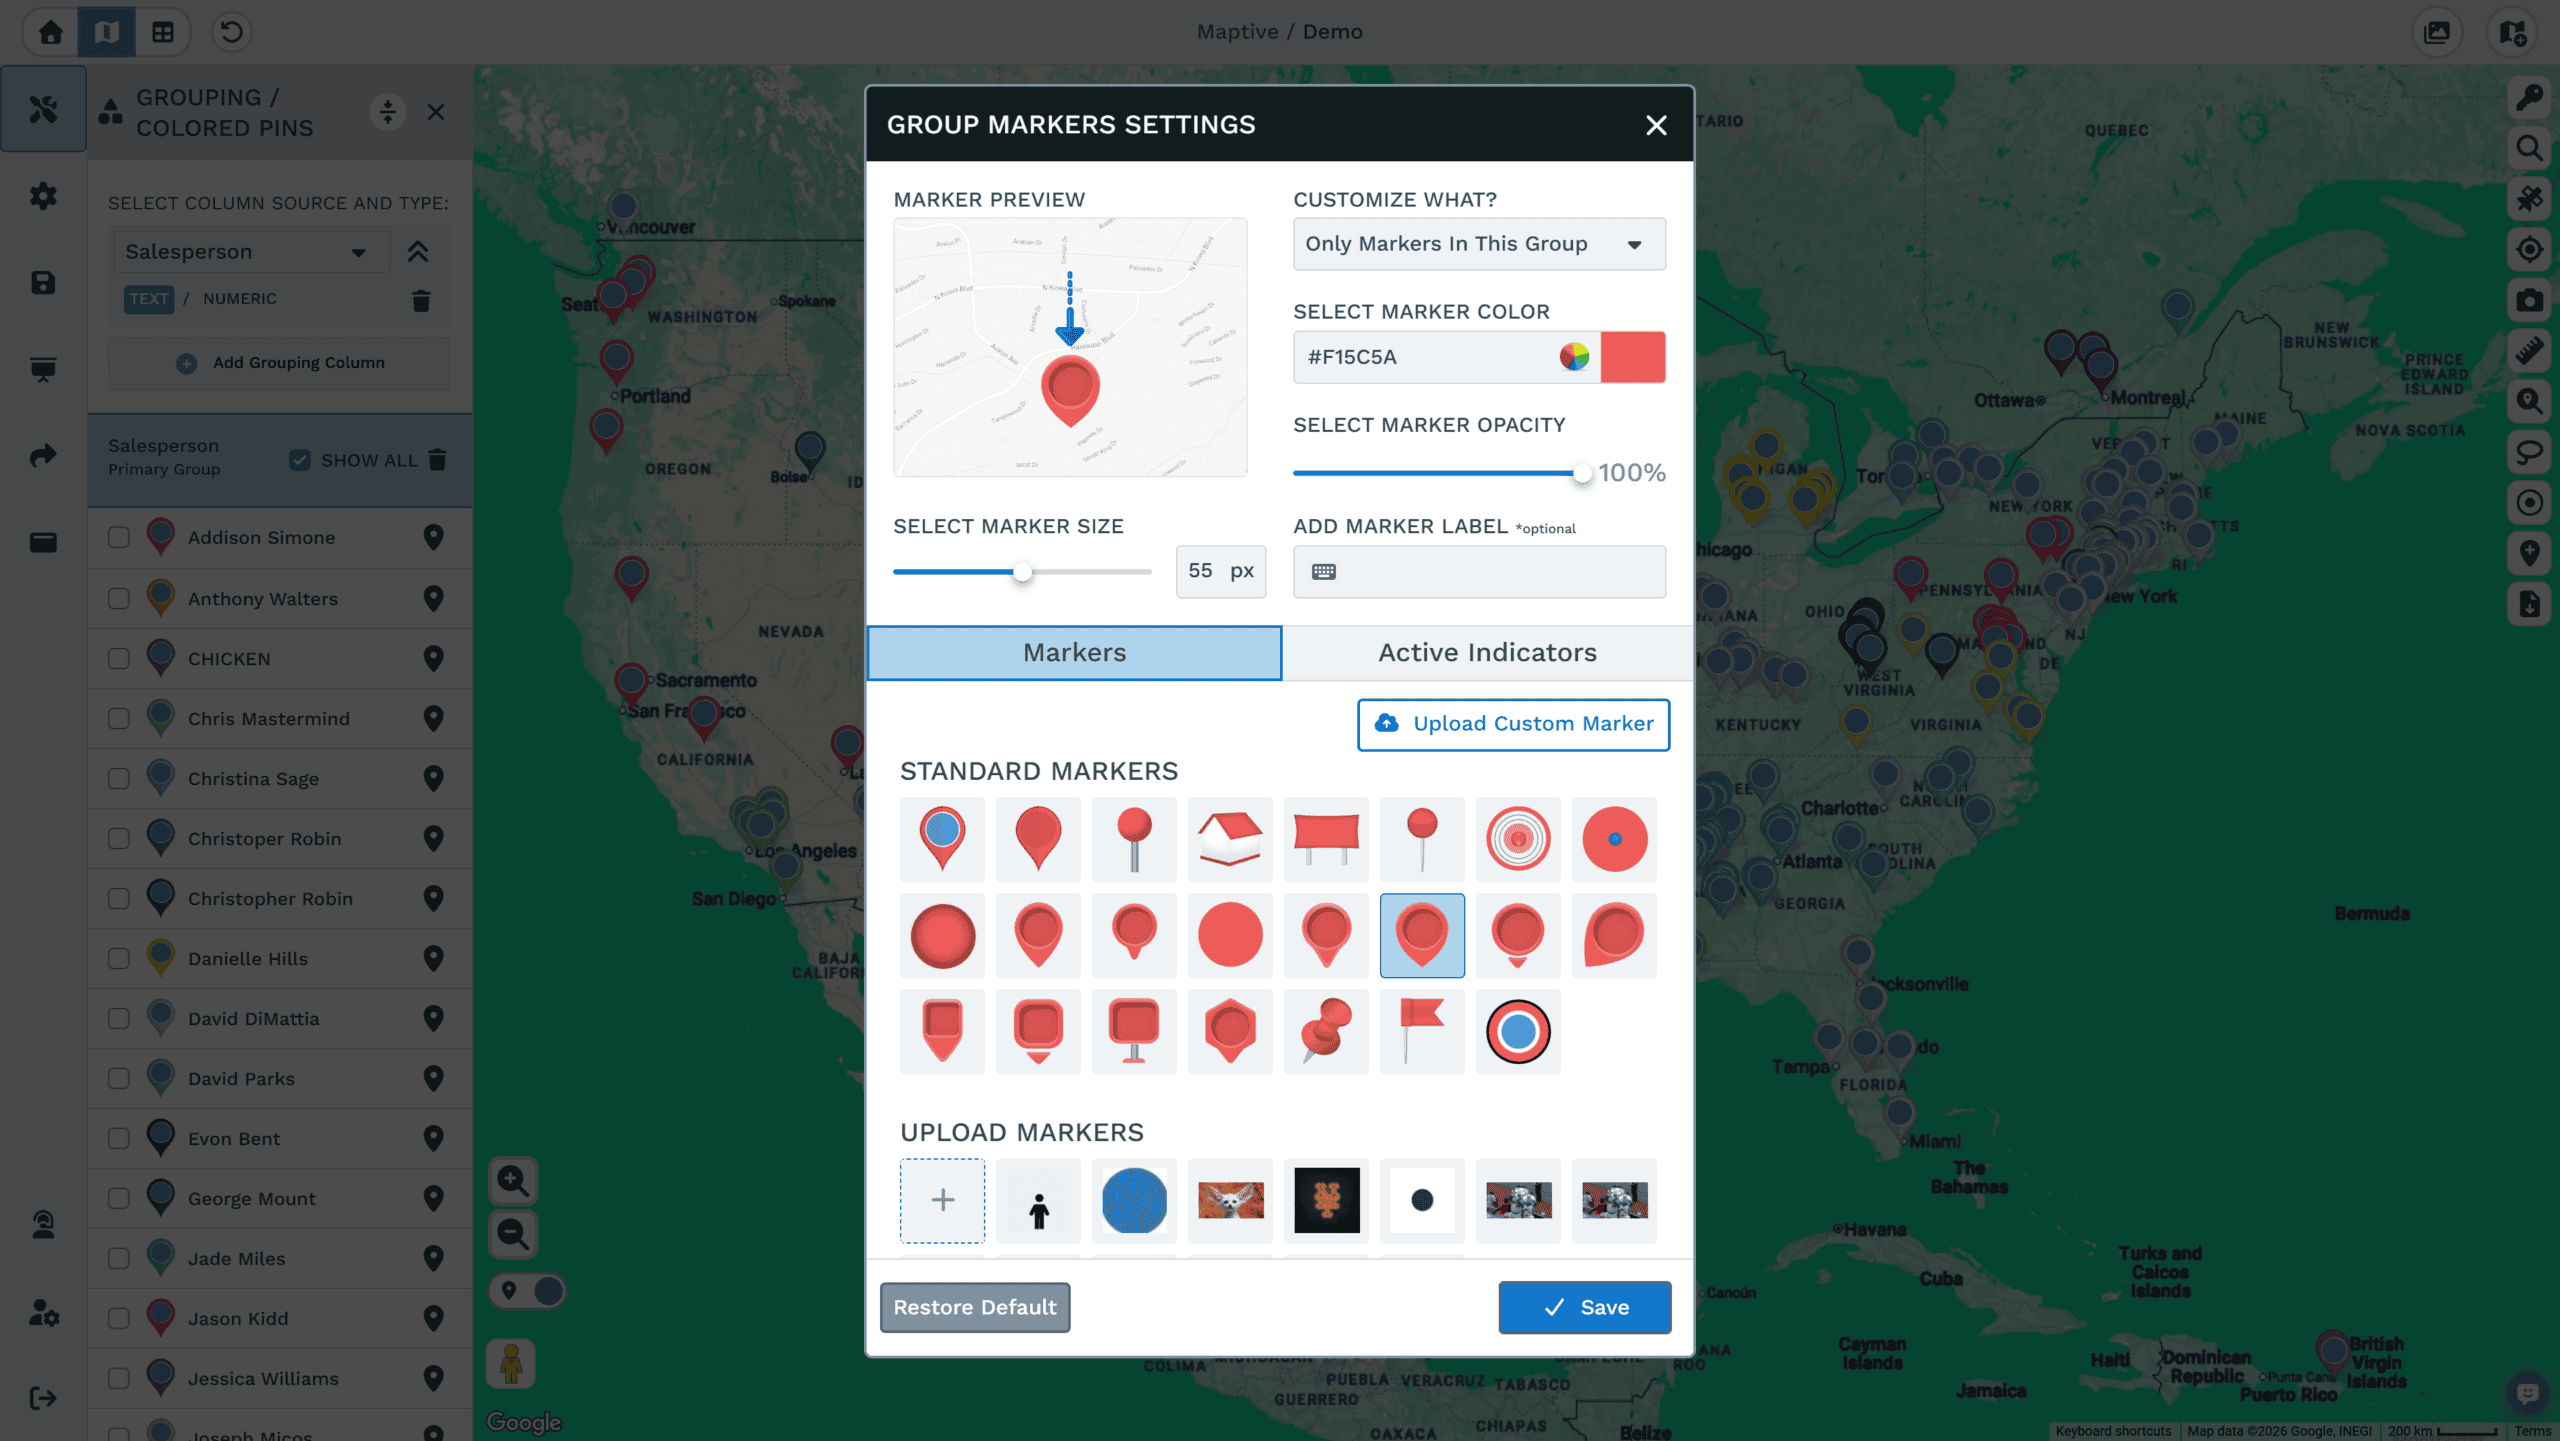
Click the small white icon to the right of a group, or the location pin icon beside it, to open Group Marker Settings. Color, opacity, size, marker shape, and an uploaded custom icon all apply to every pin in that group, and the choice stays attached across reloads of the same file. The Answer Center recommends styling through the Grouping Tool rather than editing pins one at a time, since individual edits never appear in the legend and can be overwritten when data reloads.
Jump Straight to a Group's Footprint
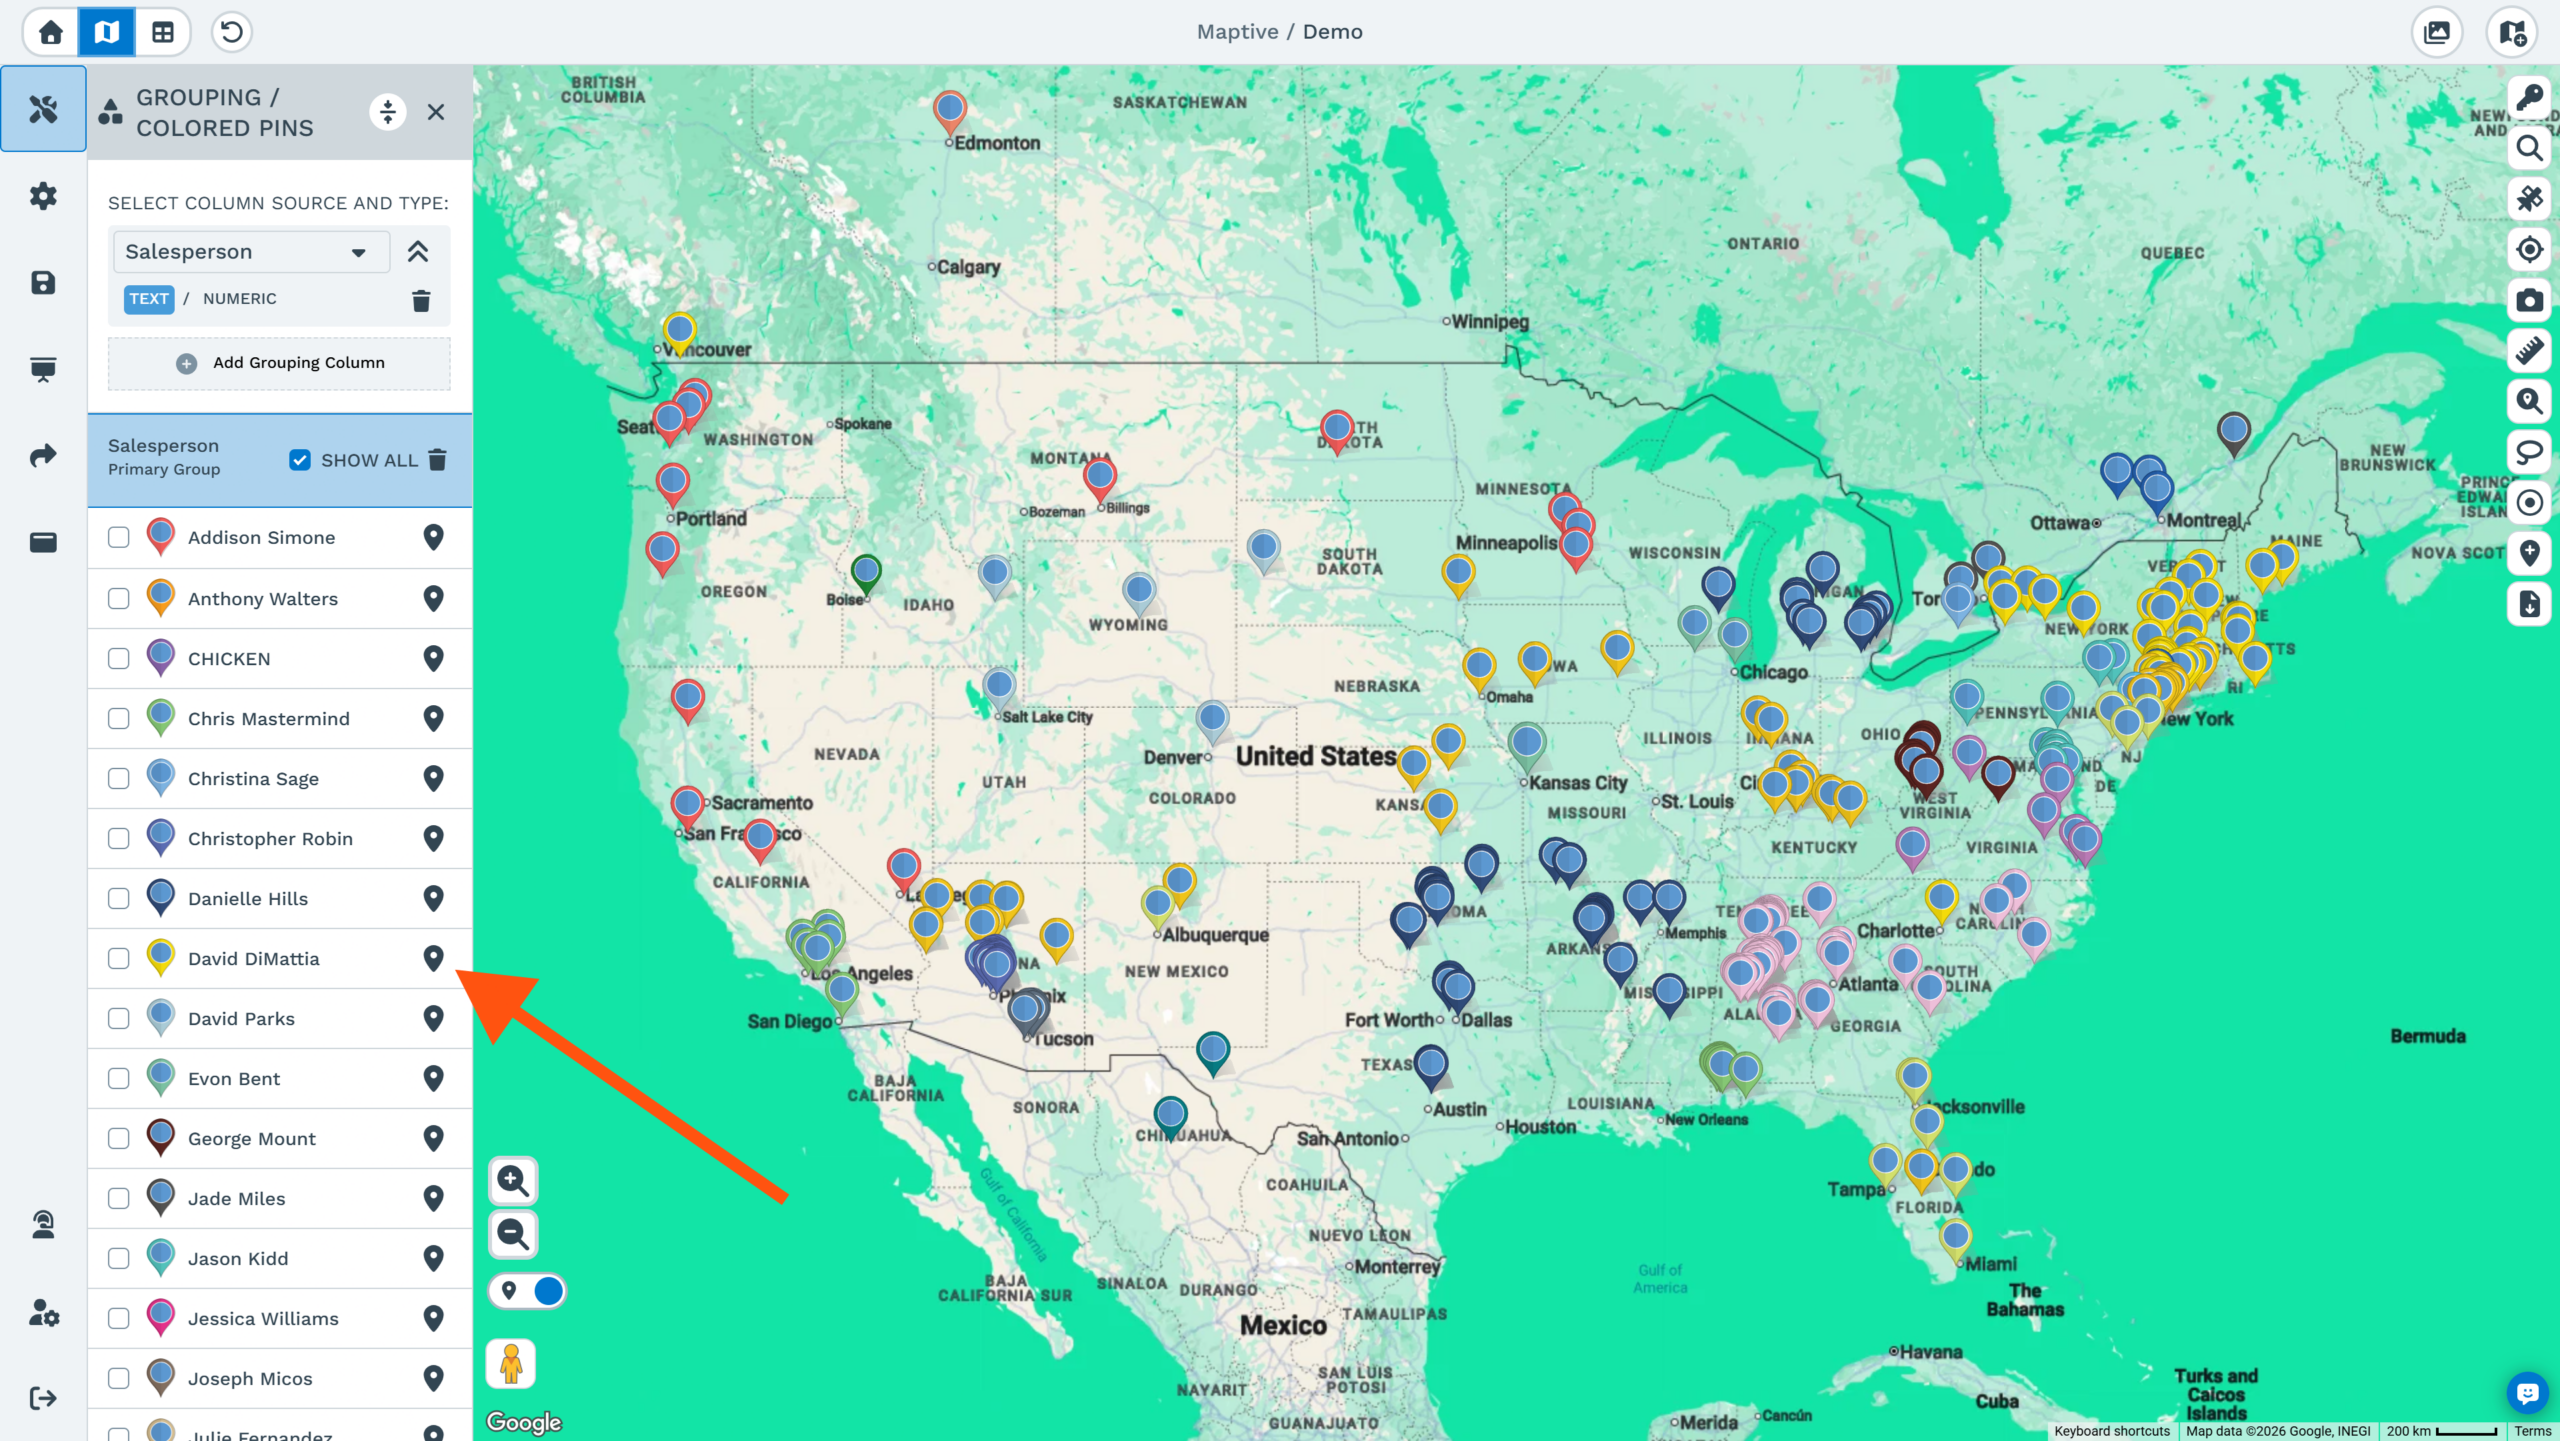
The small pin icon beside a group entry zooms the map to the extent of that group. On a national data set this saves scrolling to find where one rep, one franchisee, or one status actually sits. Combined with the checkboxes, it turns the panel into a way to move around a large grouped map without touching the underlying file.
Free Trial
Group Your First Map in Minutes
Upload your spreadsheet, pick a column, and every pin lands in its own group. The trial is free and a credit card is not required.
Marker Grouping Use Cases by Team
Grouping answers a category question: which pins belong together. Each example below names the column that drives the groups and the decision it supports.
Sales Ops
Plot Accounts Over Color-Coded Rep Zones
Group the account list by rep assignment and each rep's book takes its own color, so every rep can see the customers inside their own area. Where two colors share the same streets, the double coverage is visible without running a report, which is the check that precedes any reassignment.
Territory Management →Sales Ops
Build Account Books That Ignore Geography
Some ownership follows named accounts rather than a boundary. Group by the account-book column instead of a ZIP or region field and the map shows each book as its own set of pins, scattered or clustered as the business actually runs it. Ownership stays with the account, and the map still reflects it.
Territory Management →Field Service
Color-Code a Day's Routes by Technician
Group the day's stops by assigned technician and each route carries its own color on one map, so the whole day is visible together rather than one technician at a time. Switching a technician off in the panel leaves a single route on screen for a closer look.
Field Service →Field Service
Group Jobs by Skill Before Assigning Them
Territory balancing weighs job density, drive-time limits, and technician skills. Group open work orders by the skill or certification column first and the map shows which specialties cluster where, which is what decides whether a region needs a second qualified technician or a longer drive.
Field Service →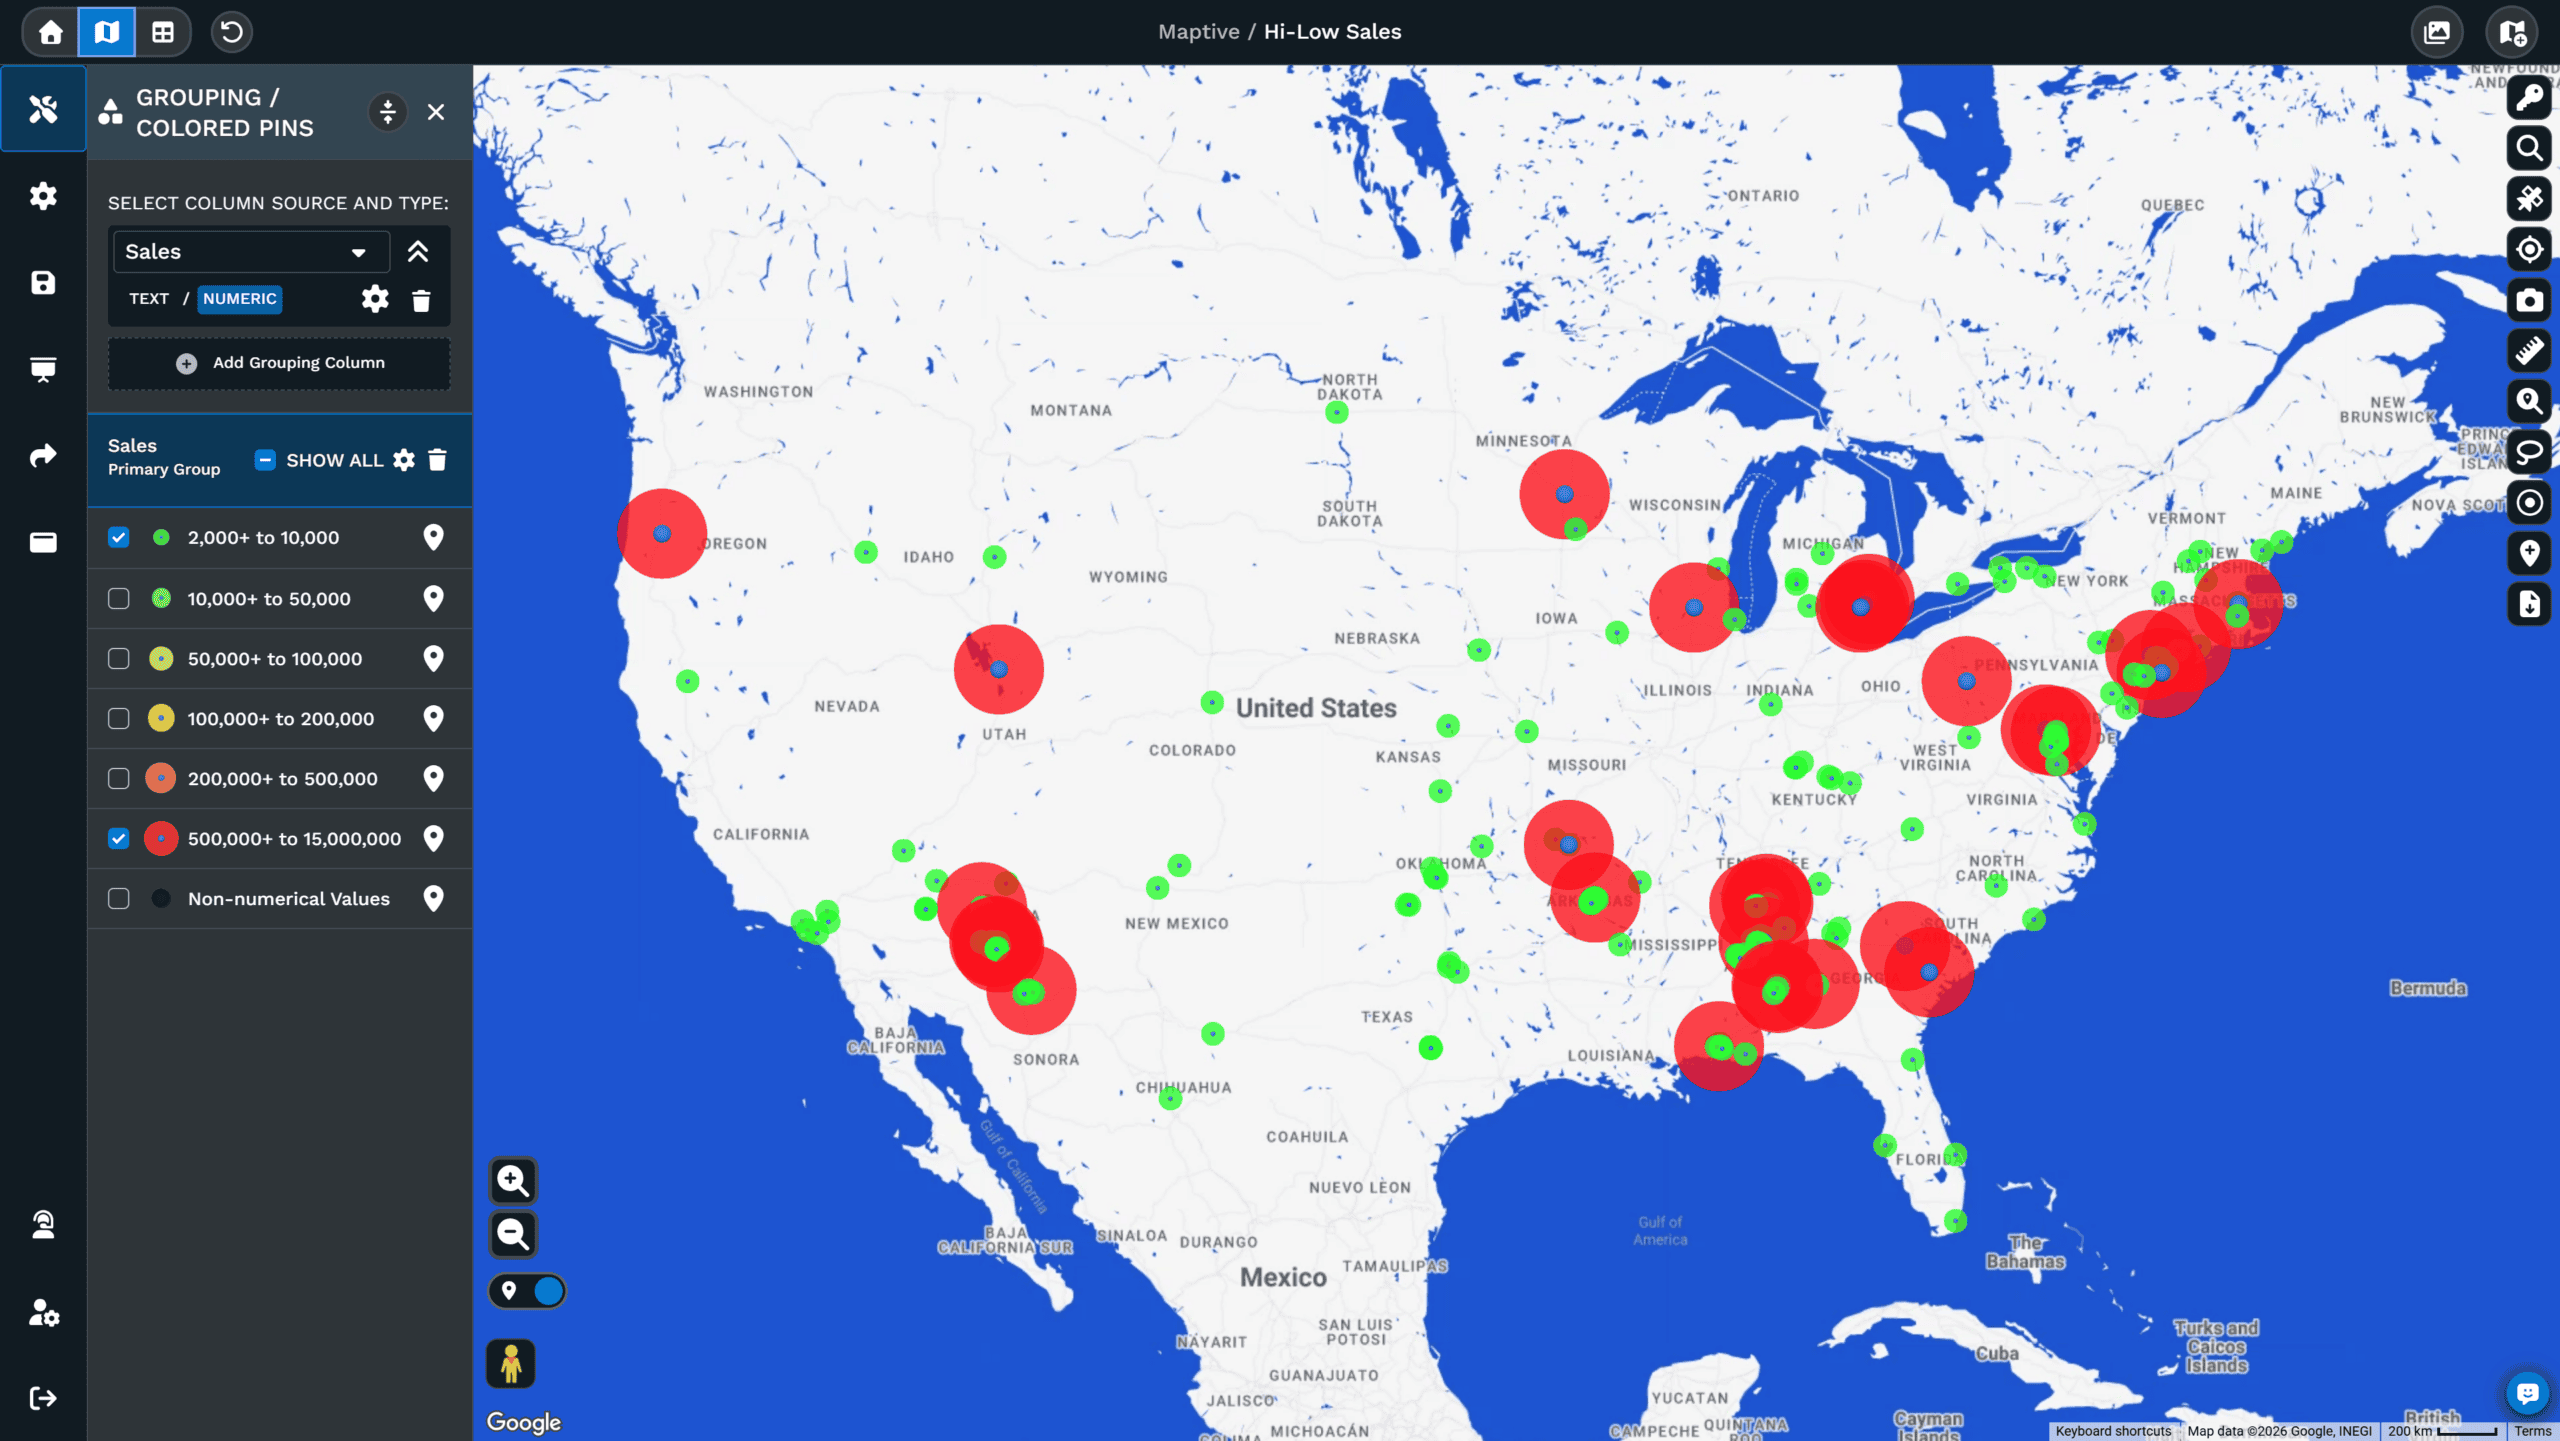
Franchise Development
Separate Existing Units, Competitors, and Proposed Sites
Development maps carry your locations, competitor sites, and proposed openings in one upload. Group by the location-type column and each of the three becomes its own marker, so a proposed site can be judged against what is already standing nearby before any capital is committed.
Franchise & Multi-Location →Multi-Location Operations
Slice a Service Network by Equipment Type and Account
The Hillman Group runs a nationwide network of self-service retail kiosks and segments it by machine type and by retail account in a few clicks, so the team sees the slice it needs without the rest of the map in the way. Territories there are defined by machine mix, revenue, and density, which is exactly the kind of grouping a ZIP boundary cannot express.
Read the Hillman Story →Insurance
Split a Book by Producer or by Geography
Producer territory balancing starts with seeing whose policies sit where. Group the book by the producing agent and each producer's business separates on the map. Regrouping the same file by ZIP, county, or census tract answers the exposure question instead, without touching the underlying data.
Insurance →Distribution & Dealers
Show Plants, Warehouses, Distributors, and Dealers Apart
Channel coverage mapping puts the whole network on one map, but a flat roster hides the tiers. Group by partner type and the plants, warehouses, distributors, and dealers each take their own marker, which is what exposes where reach overlaps and where open demand has no coverage at all.
Distribution & Dealer Networks →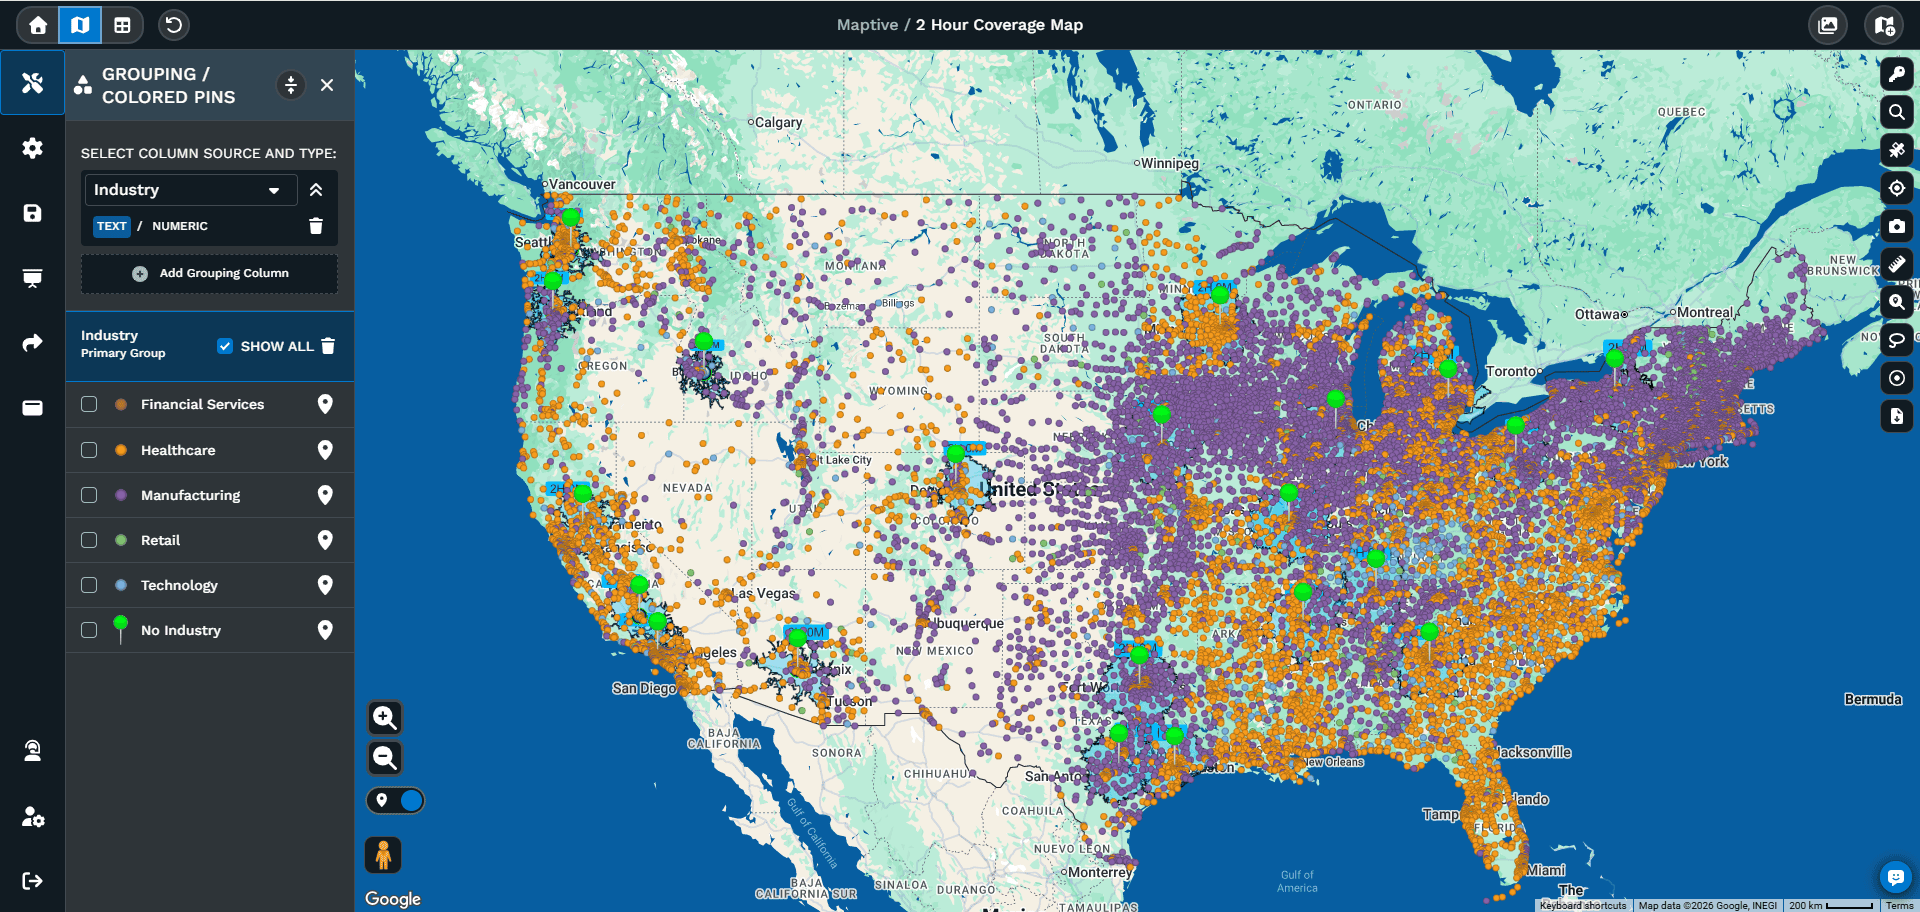
Retail Site Selection
Tell Candidate Sites From Stores and Competitors
A site-selection file mixes existing stores, competing locations, candidate sites, and prospects into one address list. Group by site status and the four separate immediately, so a cannibalization check compares the right pins and a committee sees the shortlist against the network it already owns.
Retail Store Planning →Regional Marketing
Compare Two Segments on a Single Map
Segments that look distinct in a report often overlap on the ground. Group customer pins by segment or lead source, then untick everything except the two you want, and the footprint of each sits beside the other. That comparison is what decides which areas deserve regional spend.
Teams →What Marker Grouping Adds to a Pin Map
A pin map with every row in the same marker style answers one question: where the rows fall. Grouping adds a second question to the same map, which is what value each row carries in a column of your choosing.
Grouping Runs Straight Off Your Spreadsheet Columns
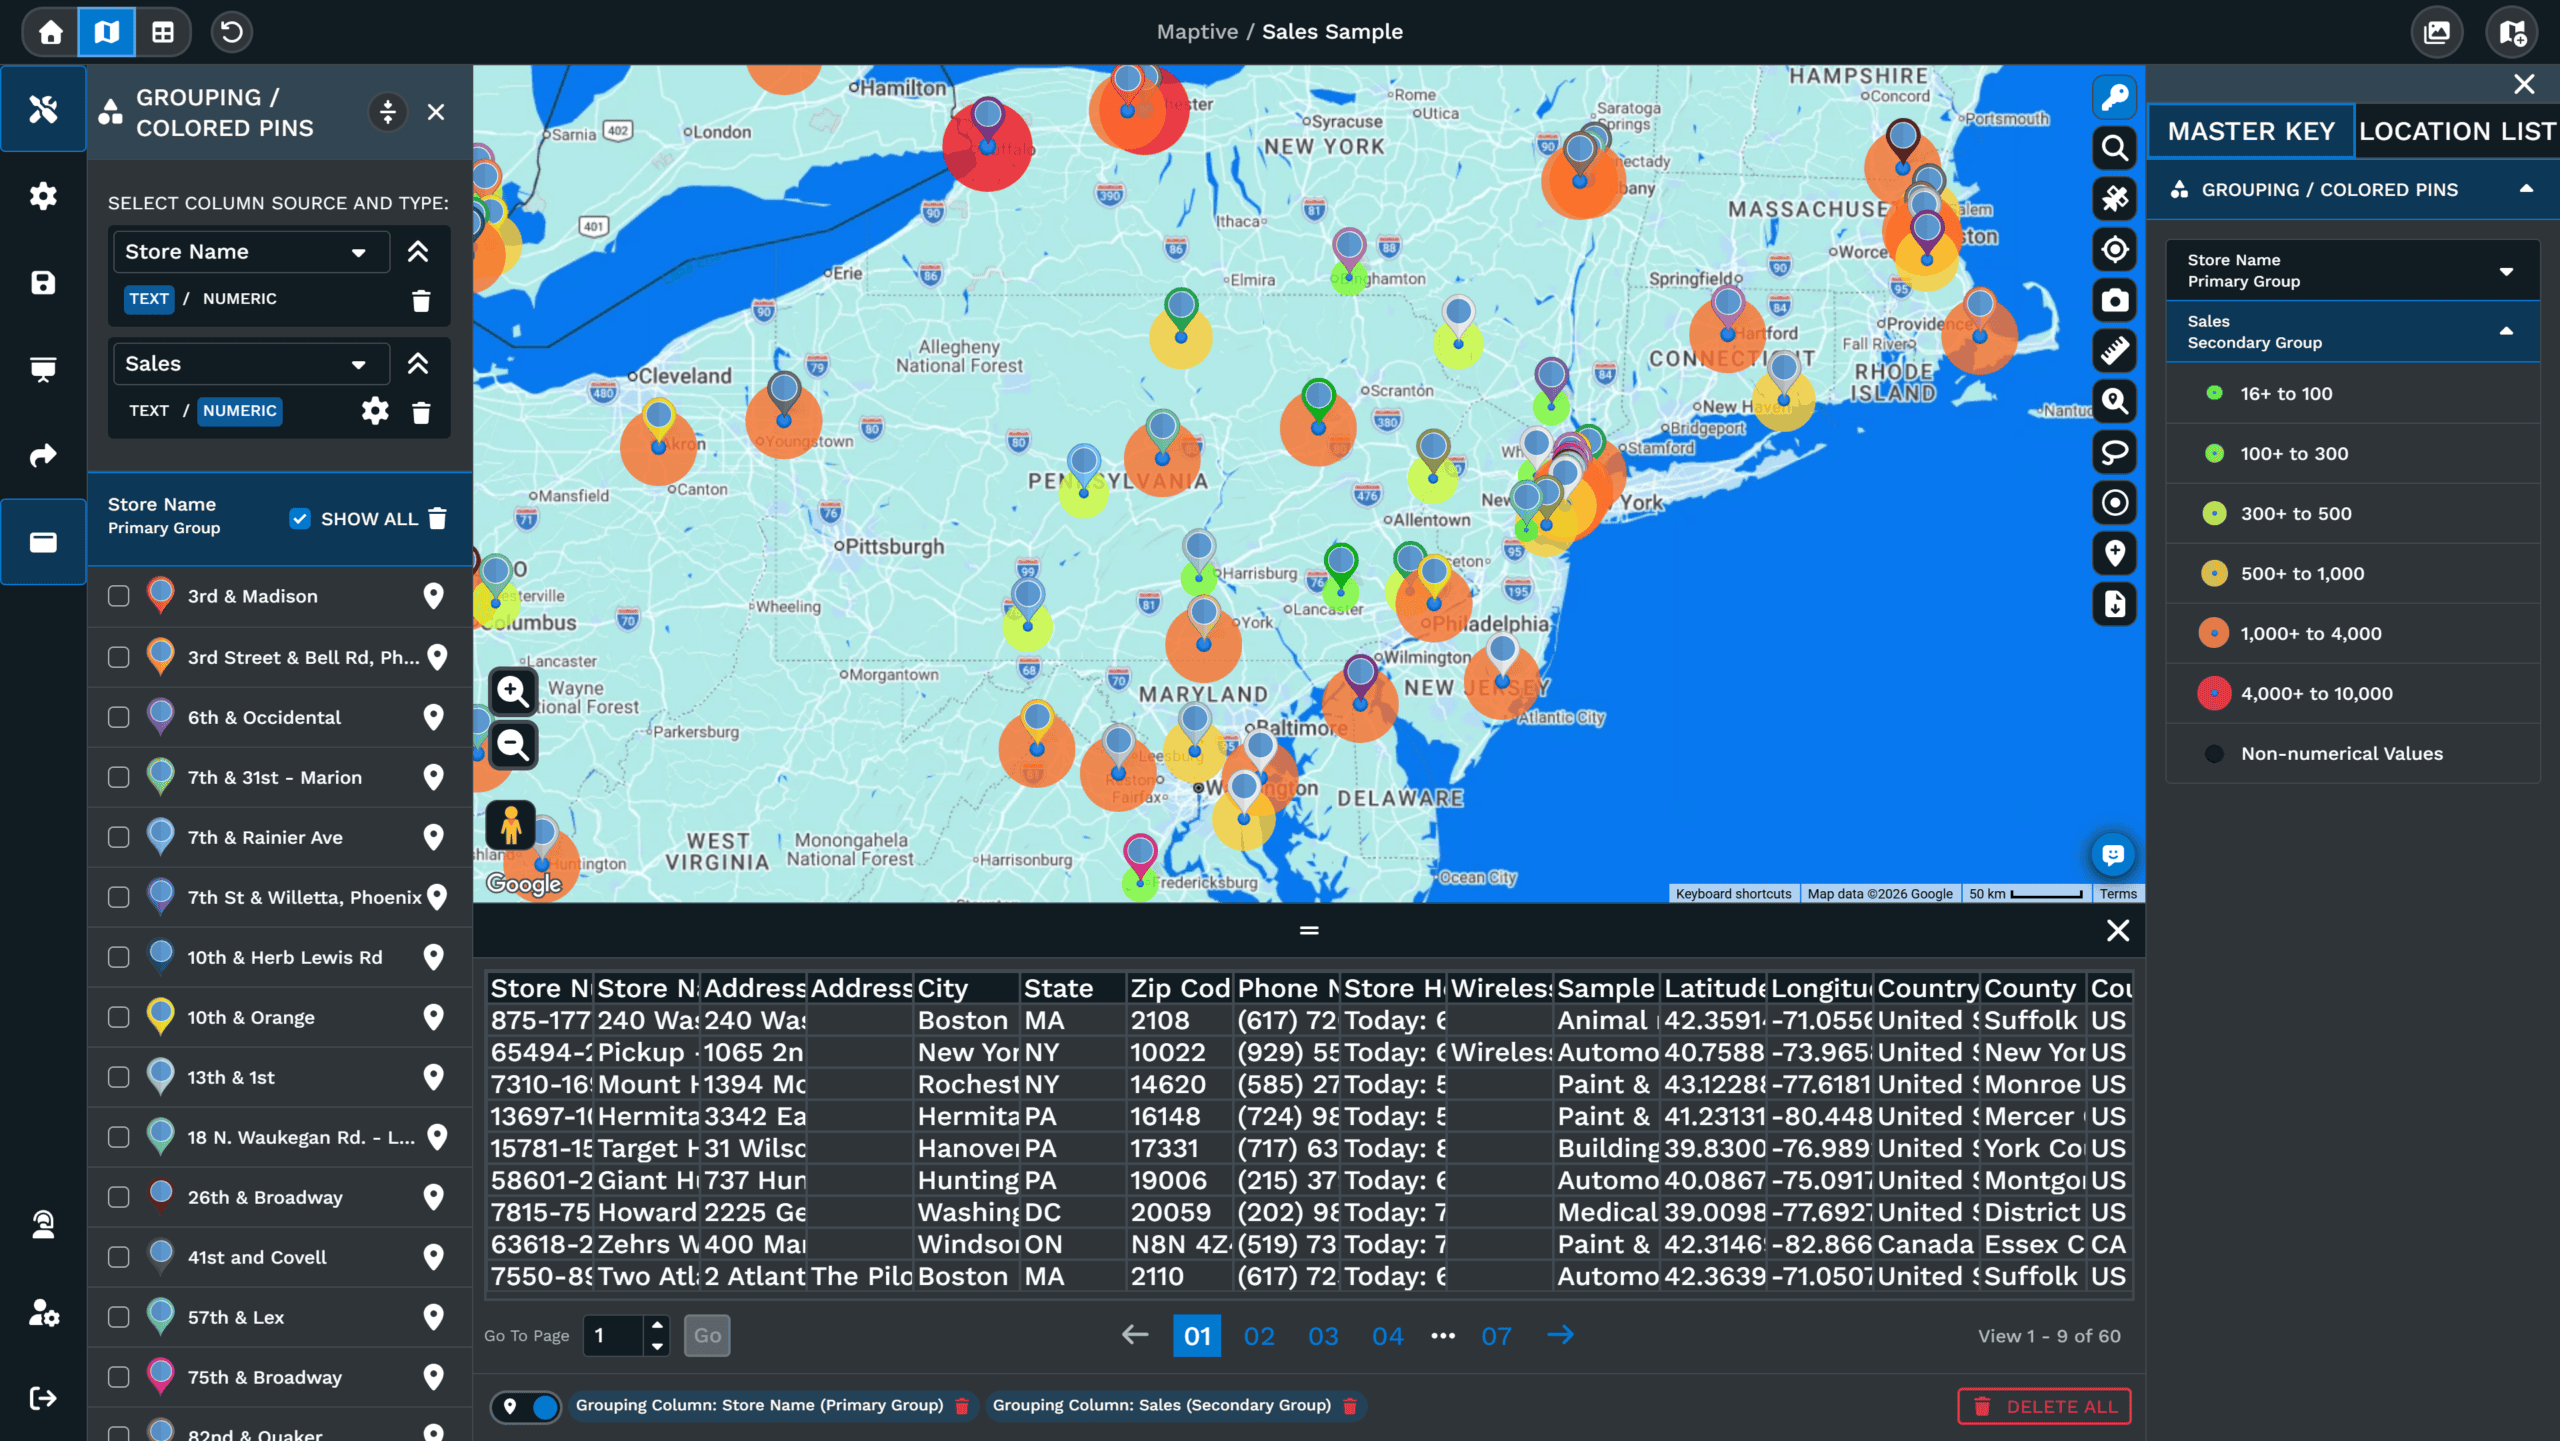
The mechanic is small. Pick a column, and each unique value in it becomes its own group. Every pin tied to a row with that value joins that group, and the panel lists each group beside the value it represents. The same map can be regrouped by switching the Primary Group column inside the panel at any time, with no re-upload of the underlying file. A column in your spreadsheet becomes a dimension on the map the moment you select it.
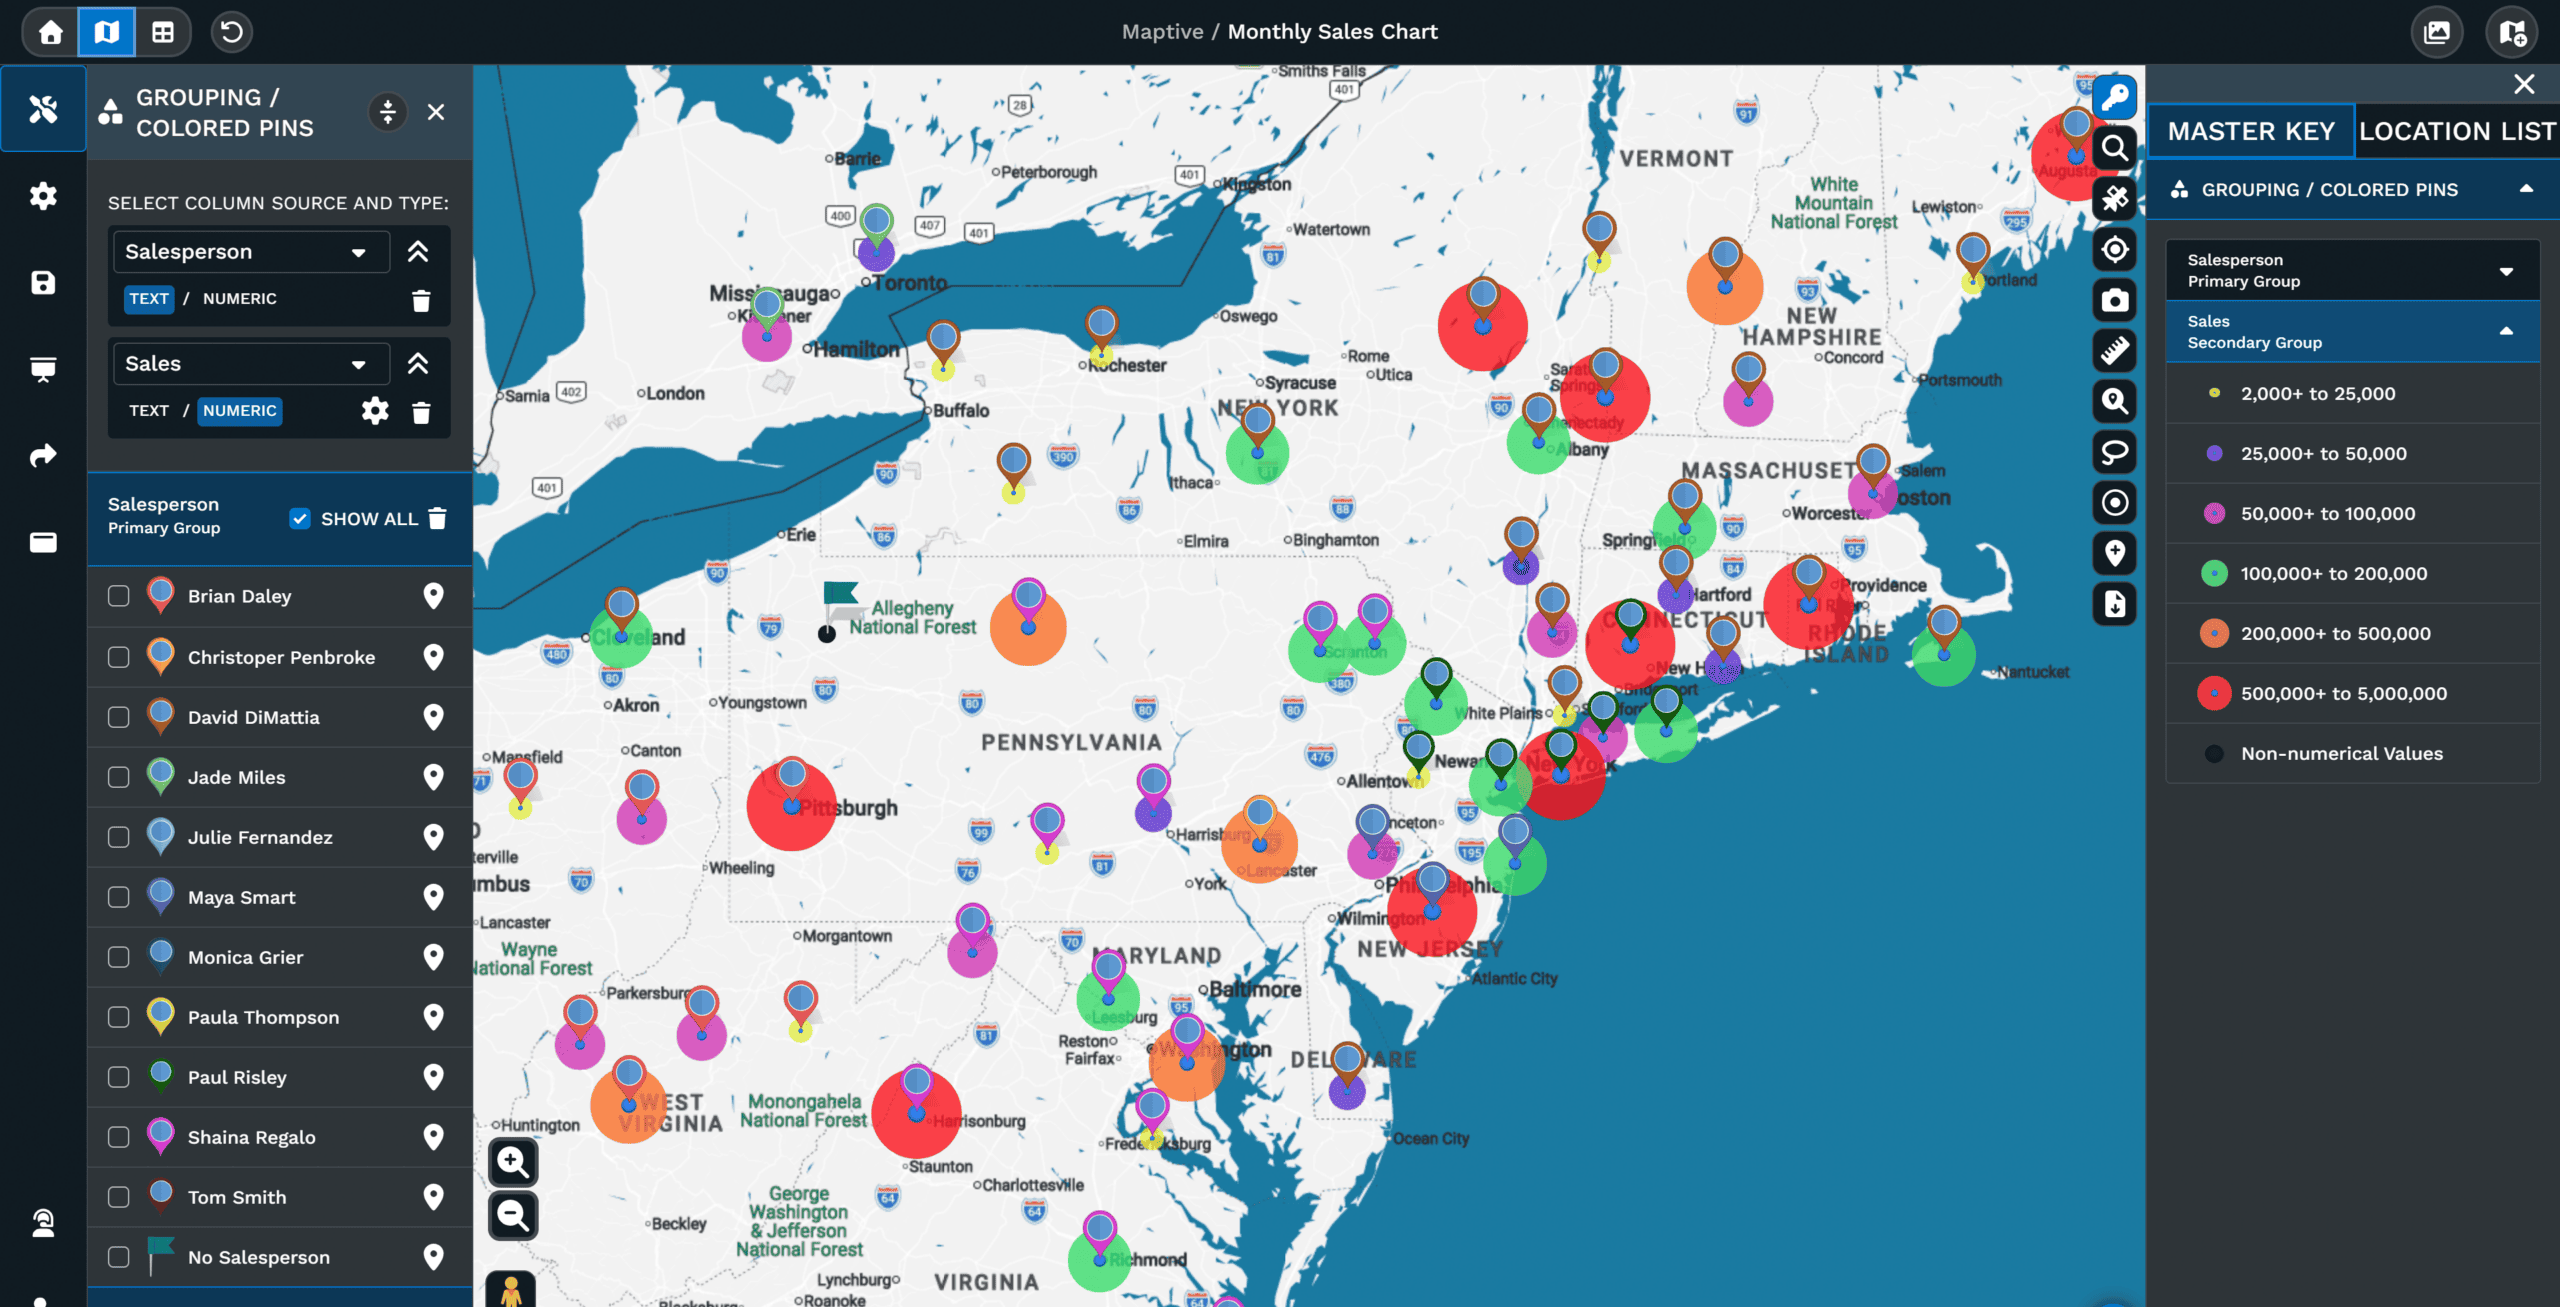
Primary and Secondary Groups Answer Two Questions at Once
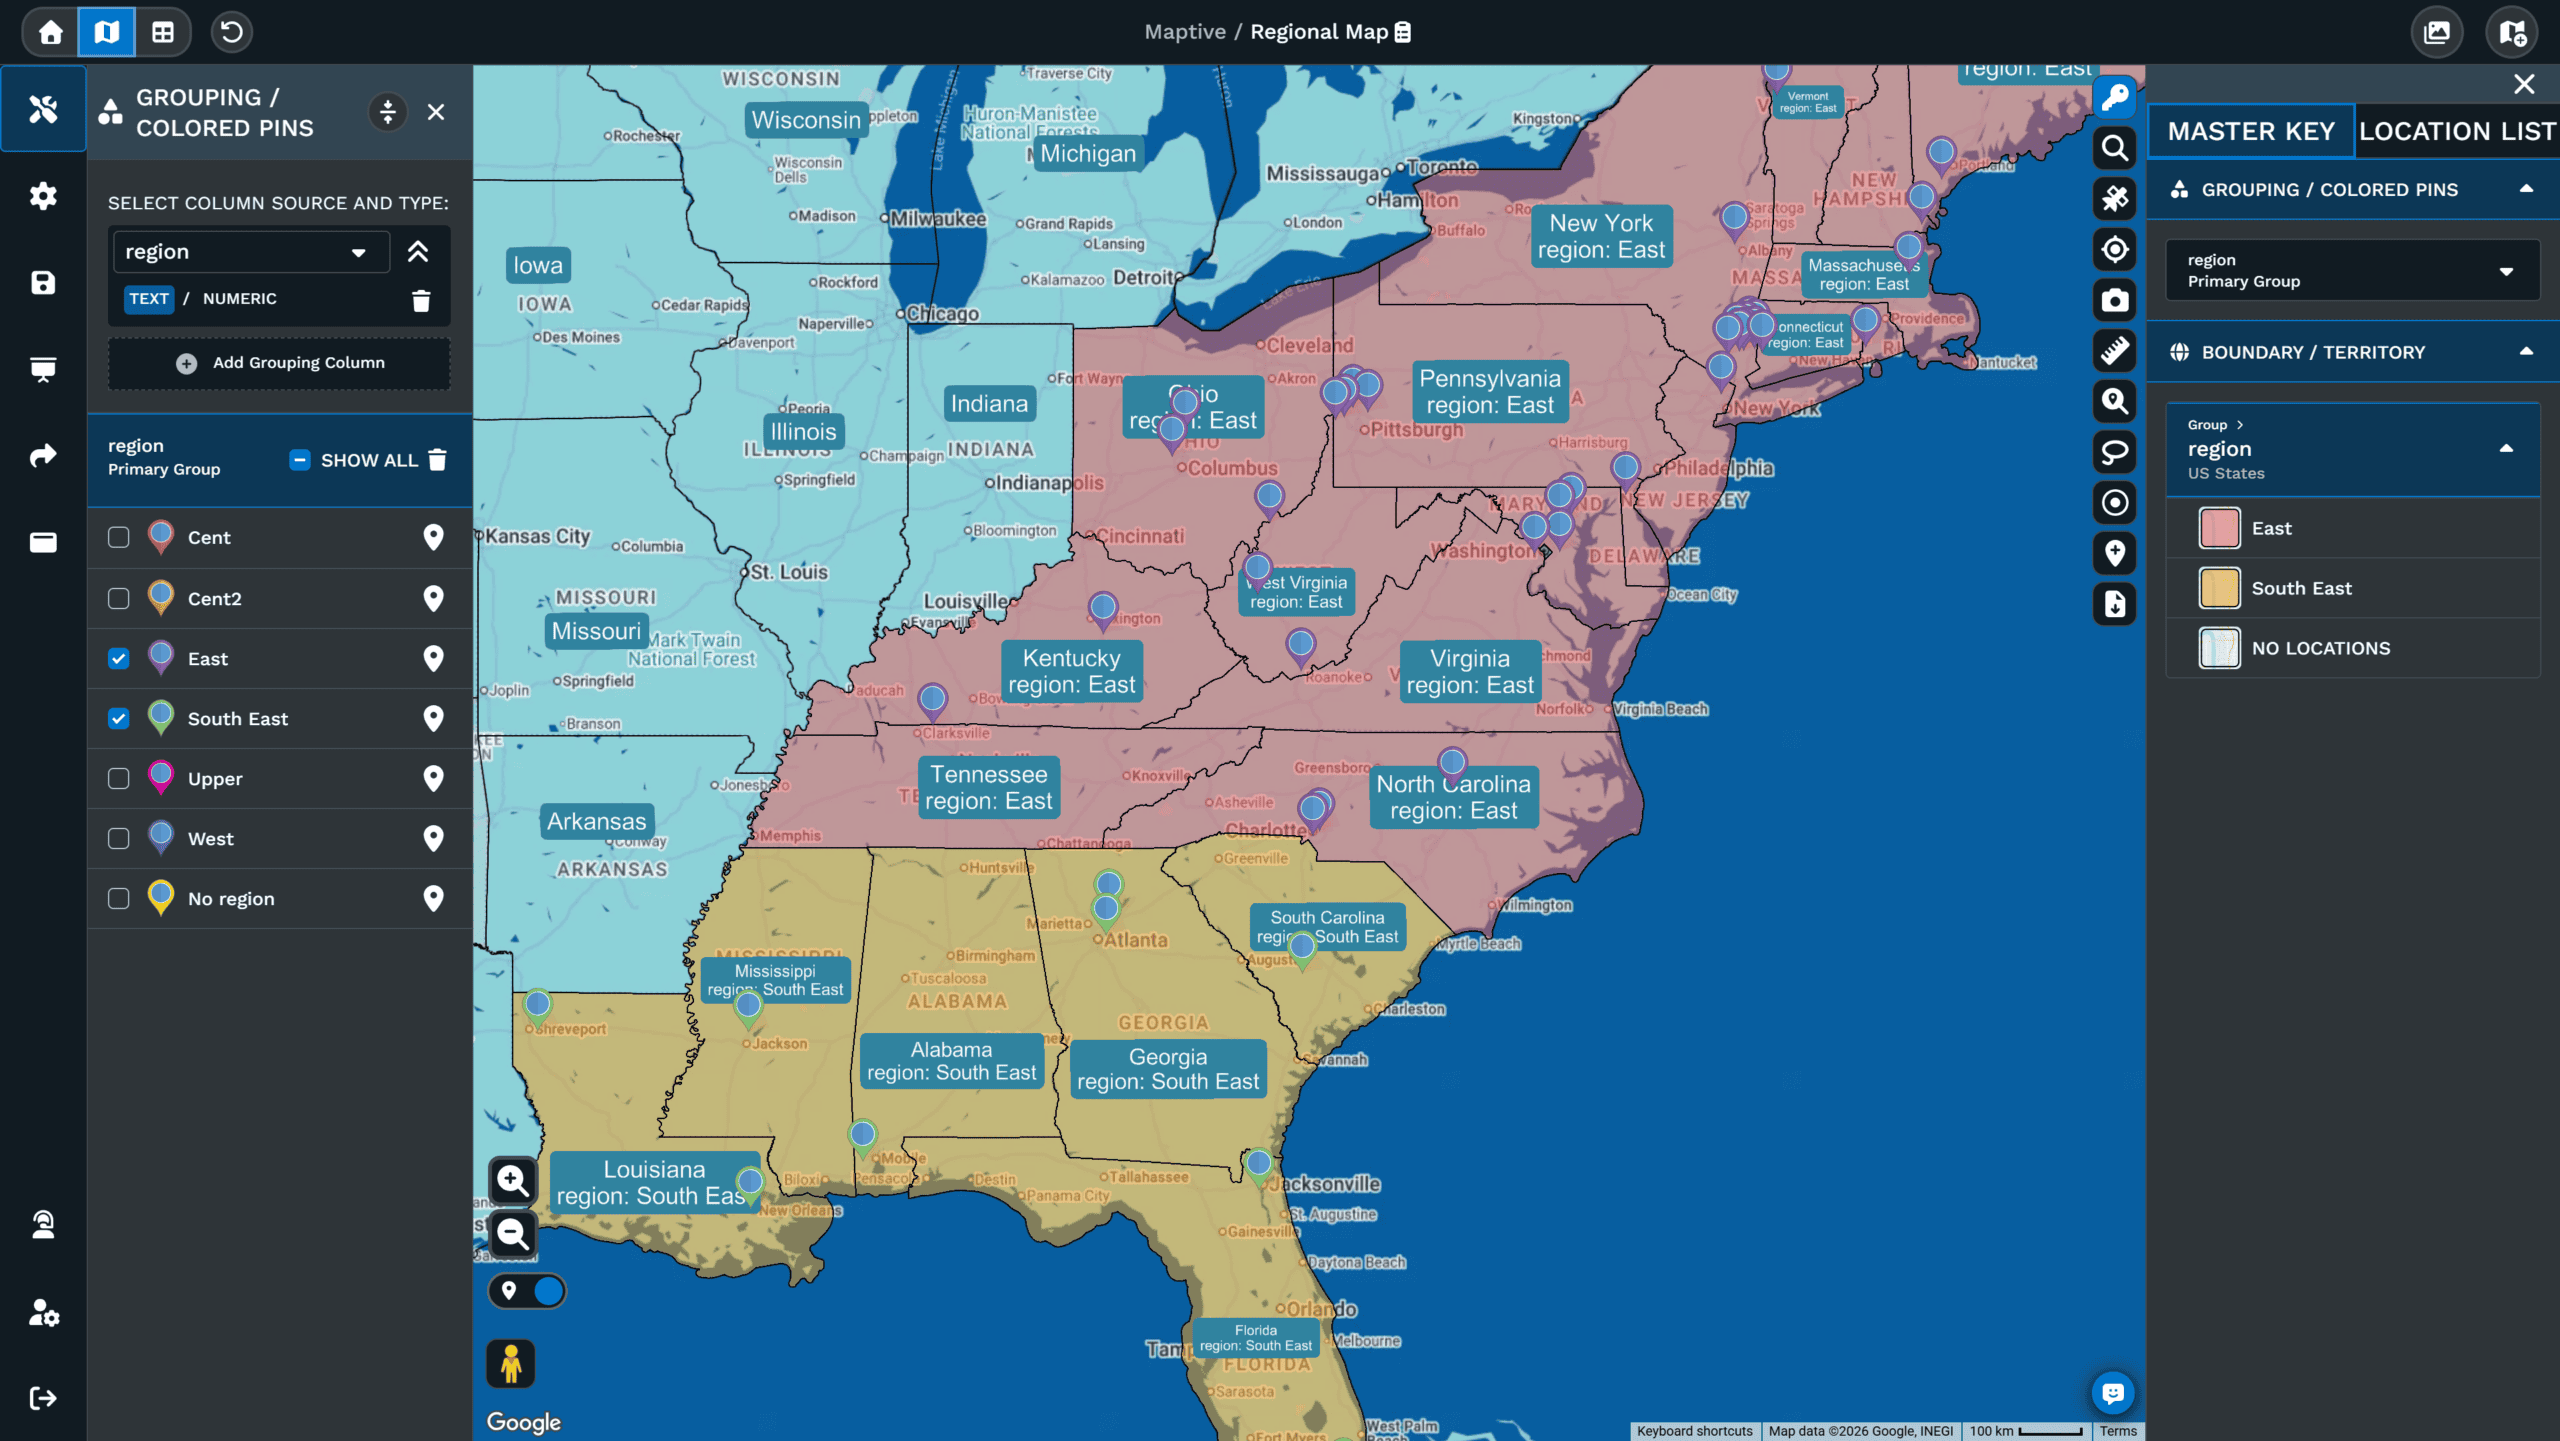
A second column adds a second signal to every pin. Pick another column as the Secondary Group in the same panel and Maptive layers a second marker tied to that column onto each pin. The Answer Center notes the secondary slot works well for numeric data, since it uses bubble markers that carry the magnitude or range of those values. A region column paired with a sales column shows which regions hold the larger values without building a second map, and either group can be switched off to leave the other on its own.
| Primary Group | Secondary Group | |
|---|---|---|
| Best column | Category values such as owner, status, or region | Numeric values such as sales or headcount |
| Marker | One color per distinct value | Bubble markers carrying magnitude |
| Answers | Which category does this pin belong to | How large is the value on this pin |
| Toggling | Select or deselect any group in the panel | Select or deselect independently of the primary |
Marker Grouping Tool FAQs
What does the Grouping Tool do?
How do I add a Secondary Group?
Can I group a number column by ranges?
How do I hide a group on the map?
Can I change the marker style per group?
Does the Grouping Tool work on any column?
Can I compare two groups on the same map?
How does Numeric grouping handle large columns?
Does my grouped map stay grouped after a reload?
Can I switch the grouping column without re-uploading?
More Ways to Visualize Your Data
Marker Grouping Tool
Start Mapping Your Data Today
Maptive includes over 60 mapping tools in one subscription, and the Marker Grouping Tool is one of them. The trial is free and a credit card is not required.








