We created this FAQ because accurate information matters when you’re evaluating Maptive. The answers below come directly from our technical documentation and reflect current platform capabilities. If you have questions that aren’t covered here, our support team is available by phone, email, or live chat.
Table of Contents
Maptive is a browser-based GIS software and location intelligence platform. It transforms data into interactive maps for territory management, route planning, and market analysis. Organizations like Amazon, General Electric, the US Department of Energy, and Coca-Cola use it for operational planning and sales territory optimization. The platform runs entirely in your browser, so there’s no software to install or IT infrastructure to set up.
Yes, Maptive includes 60+ mapping and analysis tools with no tiered restrictions, meaning every feature is available on every plan. The platform covers territory management with manual and automated boundary creation, route optimization for up to 73 stops per trip, choropleth and heat map visualizations, over 50 US Census variables, 100,000+ additional data layers, radius and drive time mapping, distance calculations, spatial joins, CRM integrations with Salesforce, HubSpot, Zoho, Pipedrive, and Keap, and high-resolution exports up to 5120×3200 pixels. You also get 12 drawing and annotation tools, custom marker uploads, base map styling options, and Google Street View integration.
Yes, Maptive performs geoprocessing operations that typically require desktop GIS software, but runs entirely in your browser with no installation. The platform handles buffers using radius and drive time polygons, overlays that layer demographic data over your own data, spatial joins that combine data across layers by geographic location, boundary aggregation that groups postal codes or counties and calculates combined statistics, and area dissolves that merge adjacent boundaries into unified territories. WebGL rendering processes over 200,000 markers simultaneously, and the platform supports up to 100,000 locations per map. Organizations including Amazon, General Electric, the US Department of Energy, and Stanford Hospital and Clinics use Maptive for operational planning and spatial analysis that would otherwise require dedicated GIS installations.
Yes, Maptive is used by enterprise organizations across government, healthcare, retail, finance, manufacturing, and technology sectors. The client list includes the U.S. Department of Energy, Amazon, General Electric, Volvo, Coca-Cola, Frito-Lay, Adobe, Harvard Business School, Siemens, UBS, Volkswagen, Capital One, Stanford Hospital & Clinics, Bridgestone, CBRE, Hilton, Cedars-Sinai, American Red Cross, Aetna, SC Johnson, Sonos, GM Financial, Chobani, S&D Coffee & Tea, RBC, Adidas, GoPro, and Nikon. The platform includes enterprise-grade security with 256-bit SSL encryption, two-factor authentication, single sign-on integration, role-based access controls, and audit logging. Maptive has also passed the Salesforce AppExchange security review, which demonstrates compliance with rigorous third-party security assessments required by Fortune 500 companies and government agencies.
Maptive is headquartered in San Francisco at 548 Market St, Suite 46873, San Francisco, CA 94104.
The company has a 30+ person team based in the United States and Canada, with development and support staff operating under American leadership. All customer inquiries are handled directly by the US-based support team.
Maptive provides 60+ mapping and analysis features with no tiered restrictions. Every feature is available across all plans, so you get full access to territory tools, route optimization, demographic overlays, drawing tools, and all visualization options regardless of which pricing tier you choose.
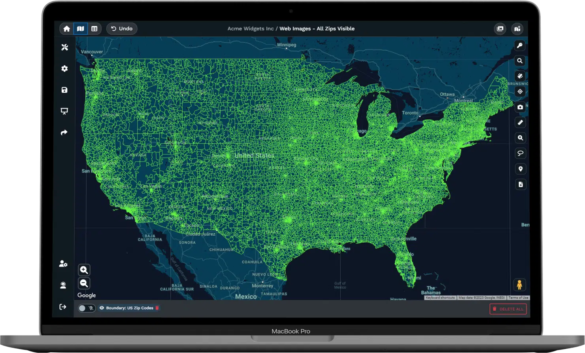
The platform supports up to 100,000 locations per map, with WebGL rendering capable of displaying over 200,000 markers simultaneously. Large datasets process quickly through cloud infrastructure without causing browser freezing or lockups. Batch processing handles approximately 50,000 rows in 30 seconds, and address plotting runs at about 10 addresses per second.
Maptive accepts Excel files in both .xlsx and .xls formats, CSV files, and direct Google Sheets integration. You can also copy and paste data or drag and drop files directly into the platform. The geocoding engine automatically corrects formatting issues during upload, including missing zip codes and abbreviated street names.
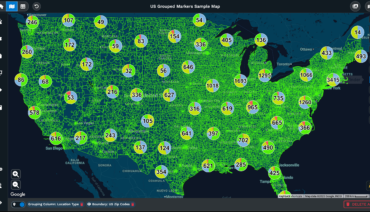
You can create choropleth maps that color regions based on data values, heat maps showing marker density or weighted data fields, bubble maps with proportional circles sized by numeric values, and pie chart clusters that display categorical breakdowns where markers overlap. The platform also supports multi-variable grouping where you can color markers by one data field while sizing them by another.
Maptive includes both manual and automated territory creation tools. You can draw custom boundaries, build territories from existing geographic boundaries like states, counties, or zip codes, or use the automated territory optimization engine. The algorithm balances territories across multiple metrics including sales volume, customer locations, revenue potential, and workload distribution. You can set parameters like maximum accounts per representative, drive time limits, and sales rep home locations.
Organizations report a 75% reduction in planning time, 15% revenue growth, and over $100,000 in quarterly fuel savings. One nationwide parts distributor compressed two weeks of territory redesign work into a single afternoon, and field teams saved 12% on routes using the constraint-based balancing algorithms.
Route optimization supports up to 73 stops per trip. The system uses Google’s Vehicle Routing Problem solver with algorithm-based sequencing that minimizes travel time. You can drag and drop to customize stop order, and the platform exports turn-by-turn directions to mobile devices. Organizations using this feature report an 18% reduction in fuel costs and a 22% increase in service calls.
Drive time polygons calculate using actual road networks and can extend up to 8 hours from any location. The platform uses 300% more calculation points than previous versions, creating more accurate service area boundaries. The calculations also incorporate live traffic conditions rather than static averages.
The platform includes over 50 US Census variables at state, county, zip code, census tract, and block group levels. Available data includes population density, median household income, age distribution, education levels, poverty rates, and ethnic composition. Canadian census data from Statistics Canada and UK postcode area statistics are also available. Through data partnerships, Maptive provides access to over 100,000 additional data layers covering consumer spending, healthcare utilization, financial characteristics, and real estate metrics.
Maptive integrates over 100,000 data layers through a partnership with an industry-leading data provider. These include consumer behavior data like credit scores and spending patterns, healthcare data such as hospital discharges and chronic disease prevalence rates, real estate metrics including property values and mortgage activity, and industry-specific data for automotive, solar, tourism, and retail sectors. Data updates quarterly at the zip code and census tract level.
Yes, direct integrations exist for Salesforce, HubSpot, Zoho, Pipedrive, and Keap. These integrations feature bidirectional sync that automatically updates territory maps when new data points are added. Salesforce users currently sync over 50,000 leads weekly with under 90 seconds of lag between CRM updates and map refresh. A REST API also enables automated address lookups and territory assignments, processing over 1 million addresses monthly.
Maps export as high-resolution PNG and PDF files at resolutions up to 5120×3200 pixels, which is suitable for poster-size printing. Interactive maps can be embedded on websites with HTML embed codes that include configurable features like search boxes, distance calculators, and filter controls. Data exports to CSV and clipboard formats. You can also add keys, legends, titles, and annotations to your exports.
The platform includes 256-bit SSL encryption for data in transit and at rest, role-based access controls with granular permissions, audit logging, and regional data storage selection for compliance requirements. Two-factor authentication and single sign-on integration provide enhanced account protection. Maptive has passed the Salesforce AppExchange security review, demonstrating compliance with rigorous third-party security assessments.
Maptive is fully mobile-accessible through modern web browsers on smartphones and tablets without requiring app downloads. The platform supports iOS, Android, and Windows mobile devices. Field teams can update routes during traffic changes, access turn-by-turn directions, use the distance calculator and radius mapping tools, and sync changes in real time to headquarters systems.
Pricing starts at $250 for a 45-day pass, $1,250 annually for individuals with up to 400,000 geocodes per month, and $2,500 annually for teams supporting up to 1,000,000 geocodes monthly. All features are included with every plan at no additional cost, with no tiered restrictions.
Support is handled by trained mapping experts, not bots or automated scripts. You can reach them through live chat, phone (888-788-2871), or email ([email protected]). Support hours run Monday through Friday, 8:00 AM to 8:00 PM Eastern Time. First response time is under 15 minutes, and most requests are resolved the same day. The support team also provides data import assistance and file cleanup at no extra cost.
Yes, Maptive provides hands-on support from trained mapping experts who understand spatial analysis and territory management. The support team helps with data import assistance, file cleanup, custom map configurations, formatting issues, and optimizing data structures for mapping workflows, all at no extra cost. There are no bots, AI assistants, or automated scripts involved.
Training sessions are available for teams adopting the platform. You can book one-on-one sessions for complex implementations, and the support team provides ongoing assistance with no artificial limits on requests. Every user receives the same level of expert support regardless of which plan they’re on.
First response time is under 15 minutes during business hours, and most requests are resolved the same day. Live chat connects you with an expert in minutes, phone support offers immediate response or same-day callback, and email inquiries receive same business day responses.
Yes, the support team provides data import assistance and file cleanup at no additional cost. They help configure custom map setups, resolve formatting issues in your spreadsheets, and optimize your data structure for mapping workflows. The geocoding engine also automatically corrects common formatting problems like missing zip codes and abbreviated street names during upload.
No, every user receives identical expert support regardless of plan level. The same trained mapping specialists assist all customers, from 45-day pass holders to annual team subscribers. There are no tiered support levels or premium support upsells.
Maptive maintains 99.9% uptime with zero major outages documented in 2025. The cloud infrastructure features hardware redundancy and automatic failover mechanisms. Browser-based architecture eliminates software installation requirements, and automatic data saving during processing prevents work loss from connection interruptions.
Maptive gives you full control over marker appearance. You can choose any color for your markers, upload custom images for branded markers, and adjust sizes individually. Data-driven labels pull directly from your spreadsheet columns and scale with zoom levels. You can also apply nested styling rules to create visual hierarchies, such as coloring markers by one data field while sizing them by another.
The platform offers satellite imagery with hybrid labels, terrain views with elevation contours, and street map views. You can customize water and land colors, control highway and road visibility, toggle administrative labels, points of interest, and transit labels on or off. Monochrome and custom color presets are available, and Google Street View integration lets you verify locations at ground level.
Maptive provides 12 drawing tools for annotating your maps. These include callout bubbles, arrows, numbered markers, polygons, circles, polylines, rectangles, labels, text, and icons. Each tool offers customizable stroke, fill, and font parameters, so you can match your brand or presentation requirements.
The radius mapping tool, also called buffer mapping, draws circles around locations at distances you specify. You can export the closest rows within a radius, export data outside the radii, and prevent duplicates across overlapping areas. This is useful for defining service areas, analyzing market coverage, or identifying which customers fall within a certain distance of your facilities.
The distance calculator computes distances between two or more locations instantly. For more complex scenarios, the distance matrix calculator handles multiple point comparisons, which is helpful for sales territory assignments or determining which facility is closest to each customer. Results can be exported to Excel or displayed as filtered subsets.
The filter tool lets you refine displayed data using categories, number ranges, dates, and custom criteria. When you apply filters, the map visualization updates in real time to show only the records that match your criteria. This helps you focus on specific segments of your data without creating separate maps for each subset.
The lasso tool lets you draw freeform selections around locations on your map. Once selected, you can edit the data for those points, plan routes through them, or export them as a segment. This is particularly useful for selecting irregular areas that circular radius tools or rectangular boundaries cannot capture.
The location finder generates a distance list from any address to all your mapped locations. If you enter a customer address, for example, the tool shows how far that address is from every store, facility, or service point on your map. This works well for customer service applications, store locator functionality, or field team dispatch.
Split-screen view displays your map and spreadsheet data side by side. You can edit data in the spreadsheet while watching the map update in real time. This is helpful when making territory adjustments or data corrections because you see the impact of your changes immediately without switching between views.
Public sharing generates URLs for your maps with optional password protection. Granular permission controls let you specify what viewers can access, including which tools they can use, which data columns they can see, and whether they have editing capabilities. This allows you to share maps externally while keeping sensitive data or features restricted.
Yes, interactive maps can be embedded on websites using HTML embed codes. You can configure which features appear on the embedded map, including search boxes, distance calculators, radius tools, and filter controls. This works well for store locators, service area displays, or customer-facing location tools.
Organizations across government, healthcare, retail, finance, manufacturing, and technology sectors rely on Maptive. The client list includes the US Department of Energy, Amazon, General Electric, Volvo, Coca-Cola, Frito-Lay, Adobe, Harvard Business School, Siemens, UBS, Volkswagen, Capital One, Stanford Hospital and Clinics, Bridgestone, CBRE, Hilton, Cedars-Sinai, American Red Cross, Aetna, Adidas, GoPro, and Nikon.
Maptive covers 112 countries globally with map data. Within the United States, the platform includes over 30,000 cities and towns, all state and county boundaries, and 43,000+ zip code tabulation areas. Pre-loaded boundaries also cover Canadian provinces with Statistics Canada data and UK postcode areas and districts.
The platform performs several geoprocessing operations through the browser without requiring desktop GIS software. These include buffers using radius and drive time polygons, overlays that layer demographic data over your own data, spatial joins that combine data across layers by geographic location, boundary aggregation that groups postal codes or counties and calculates combined statistics, and area dissolves that merge adjacent boundaries into unified territories.
Maptive connects directly to Google Sheets for real-time data synchronization. When your Google Sheet updates, the map refreshes automatically to reflect the changes. This two-way connection lets you manage your data in a familiar spreadsheet environment while keeping your maps current without manual re-uploads.
Yes, the platform saves your data automatically during processing, which prevents work loss from connection interruptions. Spreadsheet versioning tracks changes to your data over time, and undo/redo history lets you reverse edits if needed. Your saved map positions and zoom levels are also preserved between sessions.
Maptive accepts both latitude/longitude coordinates and standard street addresses. For address data, you can use columns for street, city, state, and zip code. The geocoding engine automatically converts addresses to coordinates and handles formatting issues like missing zip codes or abbreviated street names during upload.
Census data comes from official government sources including the US Census Bureau and Statistics Canada with regular updates. The 100,000+ additional data layers available through Maptive’s data partnership update quarterly at the zip code and census tract level. Maptive iQ demographic overlays also access mobile signals and purchasing behavior patterns for more current market intelligence.
Isochrone mapping shows all the areas reachable within a specific drive time from a location. Rather than drawing a simple circle, isochrone polygons follow actual road networks to display realistic service areas. Maptive calculates these polygons for drive times up to 8 hours and incorporates live traffic conditions. The platform uses 300% more calculation points than previous versions for greater accuracy.
The Maptive iQ release introduced WebGL rendering capable of handling 200,000+ markers, 300% more drive-time calculation points for greater accuracy, split-screen editing that shows maps and spreadsheets simultaneously, automated territory optimization, spreadsheet versioning to track data changes, and enhanced demographic overlays that access mobile signal data with up to 90% precision for market analysis.
Maptive aggregates statistical data across geographic regions using graduated color scales. For any numeric field within your territories, the platform calculates sum, average, count, minimum, or maximum values. This lets you visualize metrics like total sales by county, average income by zip code, or customer count by territory.
Yes, Maptive exports turn-by-turn navigation directions to mobile devices. After optimizing a route with up to 73 stops, you can send the directions to your phone for use in the field. The platform integrates with mobile devices running iOS, Android, and Windows, and changes sync in real time across all devices.
Yes, automated notification systems alert team members when their assignments change during market realignments. When you modify territory boundaries, the updates propagate across multiple maps simultaneously, and affected team members receive notifications about the changes.
Presentation mode optimizes your map display for meetings and demonstrations. It provides a cleaner view of your map without editing controls, making it suitable for presenting to clients, leadership, or team members who need to see the data without the full editing interface.
Bulk editing lets you update all markers within a territory in a single operation. You can reassign hundreds of accounts simultaneously rather than editing them one by one. Territory boundary modifications propagate across multiple maps in seconds through batch update tools, which is useful when restructuring sales territories or realigning market coverage.
Yes, Maptive provides granular controls over data visibility. You can hide or restrict data viewing by controlling which columns viewers can access, which tools they can use, and whether they have editing permissions. This lets you share maps with external partners or clients while keeping sensitive fields private.
Fred Metterhausen is a Chicago based computer programmer, and product owner of the current version of Maptive. He has over 15 years of experience developing mapping applications as a freelance developer, including 12 with Maptive. He has seen how thousands of companies have used mapping to optimize various aspects of their workflow.