


Roll Up Sales & Metrics by Territory
Tired of adding up a column to get each region's total? Maptive groups your accounts and hands you the number.
No credit card required
- Click a territory to see all its sales totals summed for you.
- Add up population or premium inside a whole region in one tap.
- Roll up each location's number into one clean territory total.
- Pick which metrics get summed, from sales to premium to units.
- Pop-ups show a whole territory's totals the second you click.
- Color each territory by its value, high totals to the lowest.
Trusted by teams at









Territory Totals, Added for You
If you're looking to do a geographic analysis of how well you're serving your market, that's where I always start.
The Source of Every Total
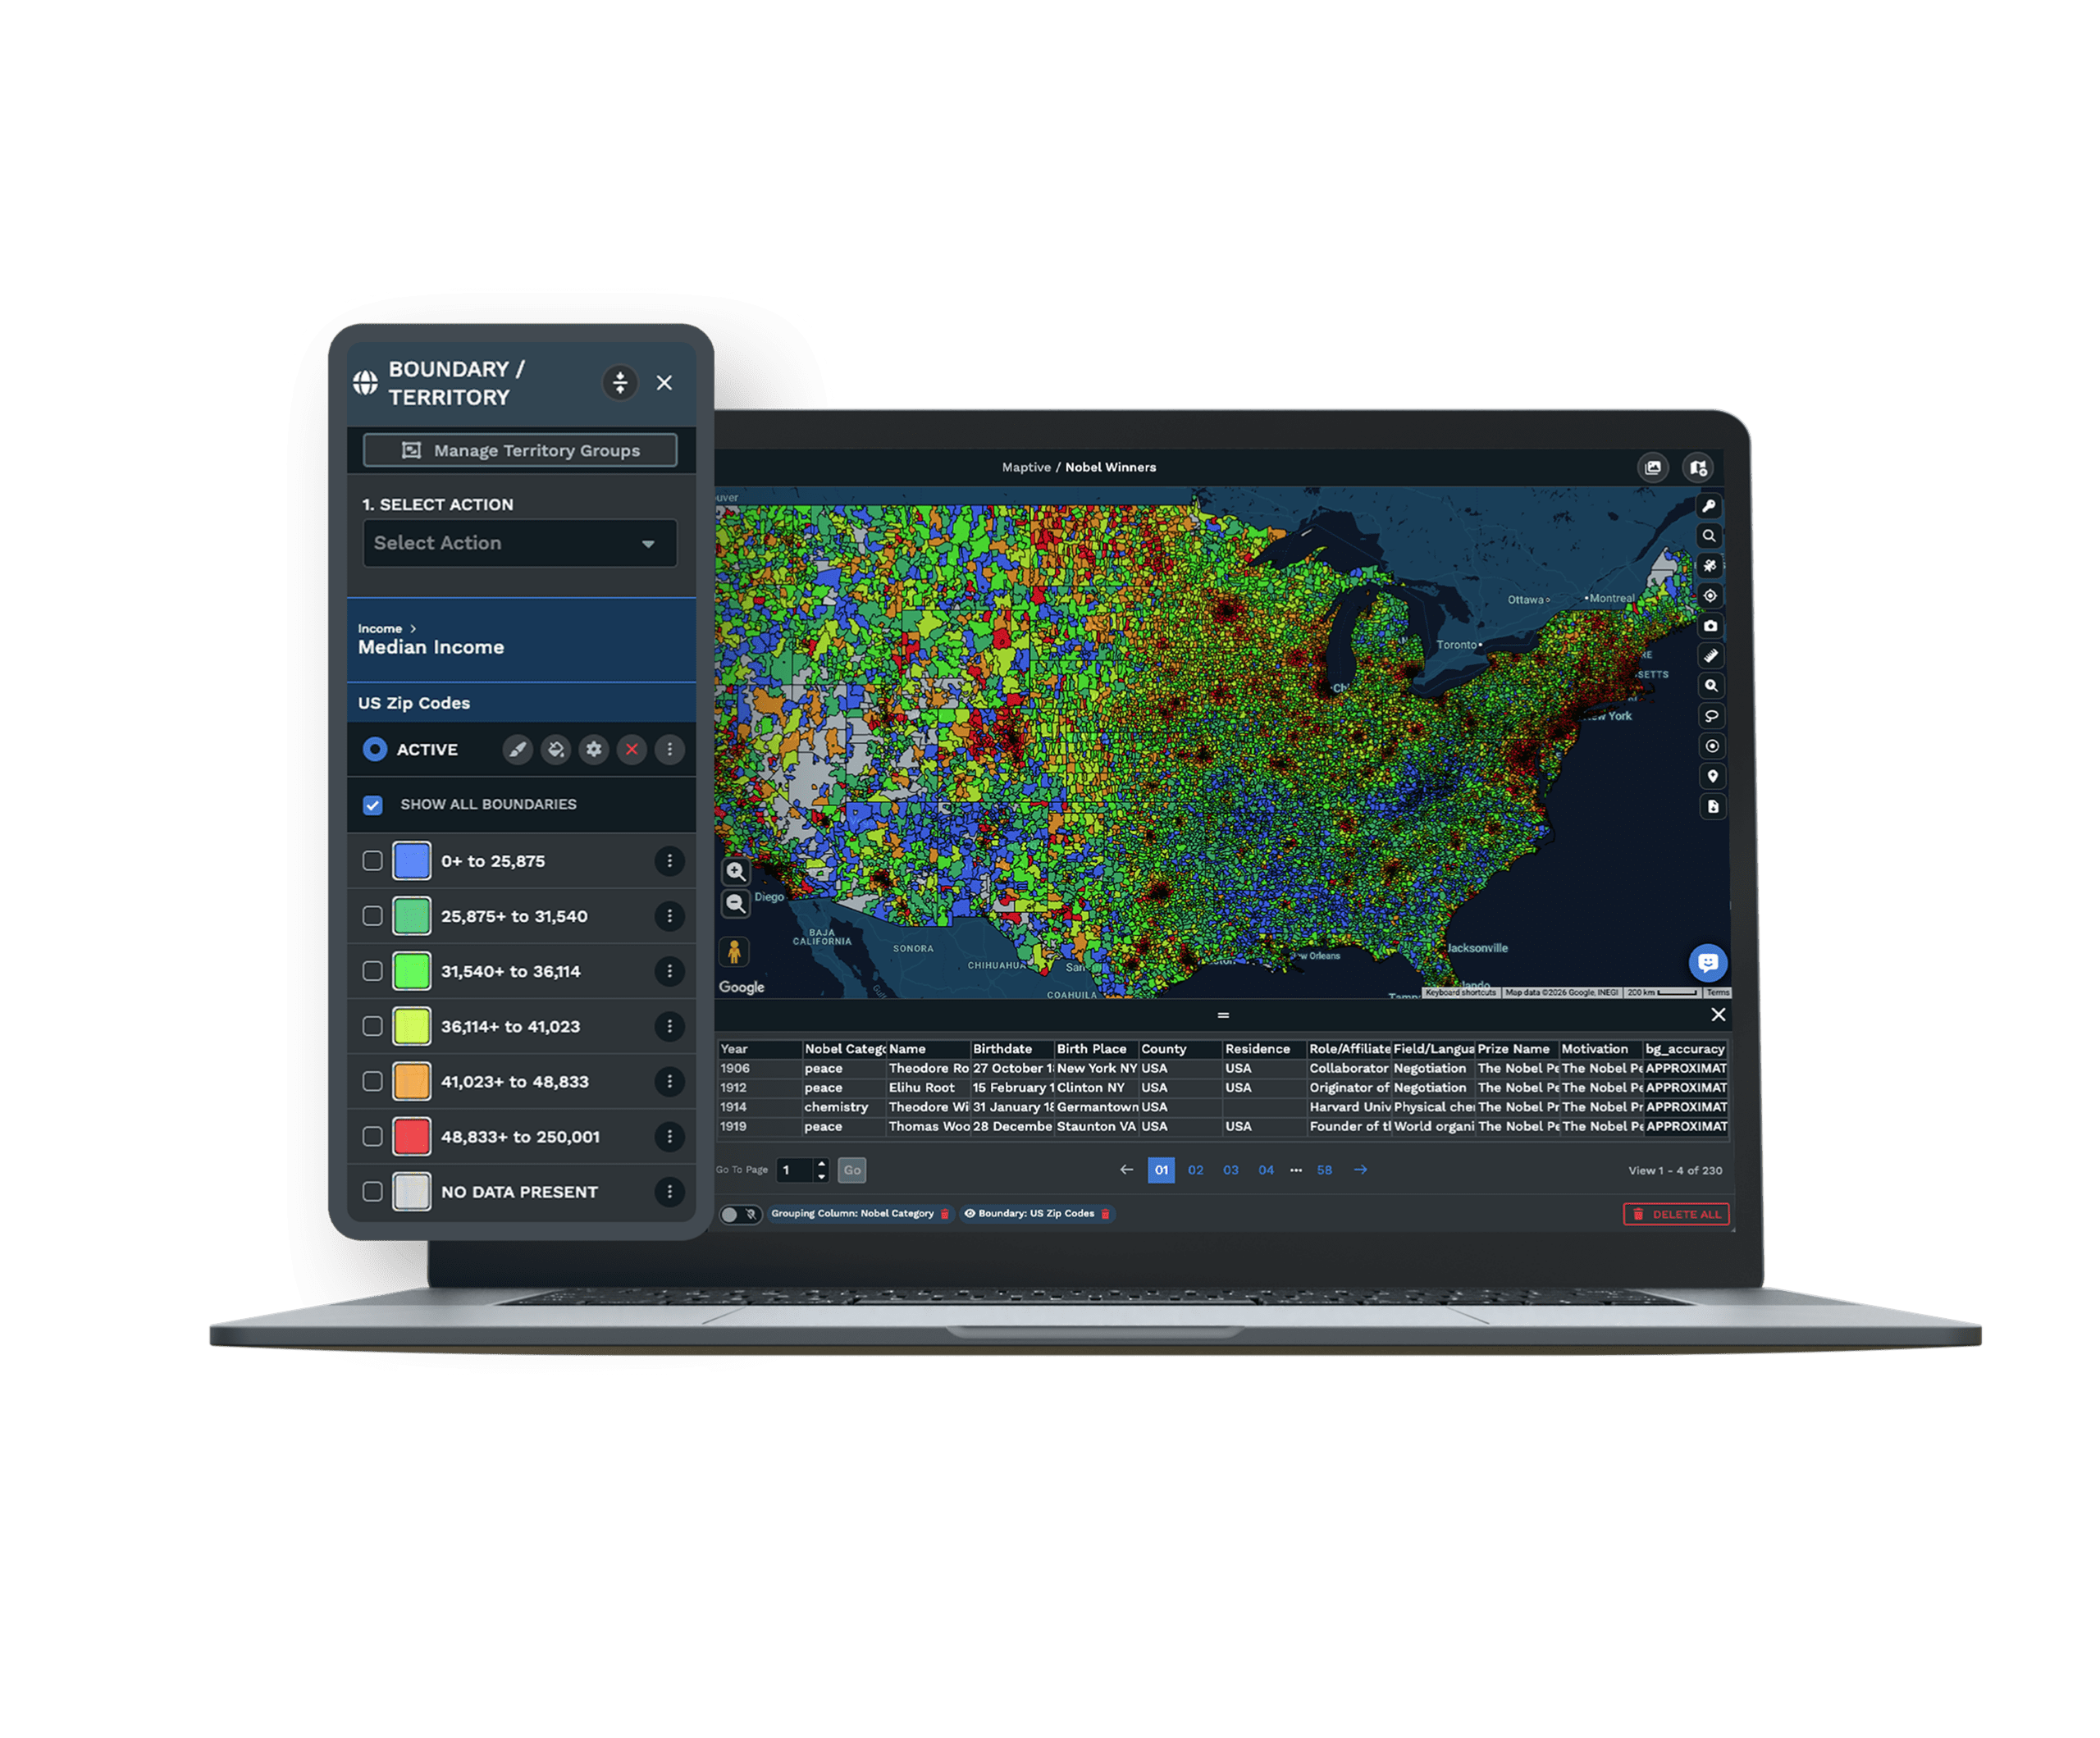
-
1
Import Your Sales Figures
Upload your spreadsheet of accounts and their numbers, and every one lands on the map with its figures attached.
-
2
Group Accounts Into a Territory
Select the locations that belong together and save them as one named area you can total.
-
3
Read the Pop-Up Total
Click the territory and its pop-up sums the sales, counts, or census figures inside it.
-
4
Color by the Value
Shade each territory by the metric you pick so the strongest region shows up in a bolder color.
See Your Own Numbers Roll Up
The 10-day free trial is the fastest way to try it, with no credit card. Import your account list and group it into a few territories. Watch the totals fill in on your own data. Want a hand? A Maptive specialist will walk your sheet with you and set up the first regions together.
No credit card required
Frequently Asked Questions
How do I see total sales per territory?
Click the territory on the map and its pop-up shows the total sales for every location inside it, added up for you. Maptive does the math the moment you group your accounts into an area, so you are reading one figure instead of adding a column by hand. You bring your own sales numbers in from a spreadsheet when you import, and the pop-up totals them by territory. If you move an account into a different area, the totals for both territories update right away, with no re-keying on your end.
Can I add up population or premium inside a region?
Yes. Alongside your own numbers like sales or premium, Maptive can bring in more than 50 census figures like population, household income, and housing unit counts, then total them for the region you draw. Group the locations into a territory and the pop-up gives you the summed value for that whole area. This is handy when you want to weigh one region against another, since you can see the people and the dollars side by side. You choose which figures to add up, so the total reflects the metric that matters to you.
Can I choose which metrics get summed for a territory?
You decide which column Maptive rolls up, from sales to premium to unit volume to a census figure like population. Point the map at the data you care about and the territory pop-up shows that total. You can also switch between a sum and an average, so you see either the full figure for the region or the typical value per location. Because the numbers come from your own import, the totals match what your team already tracks. Change the metric whenever your question changes, and the map reworks the totals for you.
How many locations does a single territory hold?
The pop-up shows a count of how many locations sit inside each territory, so you can see at a look which areas are dense and which are thin. A single map holds up to 200,000 locations, which means a national account list fits in one place without splitting the plan across files. Group the pins into an area and Maptive tallies them for you. If you add or move accounts later, the count follows along. That location count sits right next to your summed sales, so you read coverage and revenue together.
Can I color territories by their value?
Yes. The heat mapping and colored pin tools shade each territory by the number you choose, so a region carrying more sales or population shows up in a stronger color than a quieter one. Instead of reading a table row by row, you glance at the map and the busy areas jump right at you. You pick the metric that drives the color, from revenue to premium to a census figure. This makes it easy to spot the region carrying the most weight and the one that could take on more, without doing any sorting yourself.
Do I bring my own sales figures into the map?
Your sales numbers come from your own spreadsheet. Import an Excel file, a CSV, or a Google Sheet with your accounts and their figures, and Maptive plots each one and keeps the numbers attached. When you group those accounts into a territory, the pop-up sums the figures you brought in. There is no separate data entry step and nothing to reformat, since the sheet you already keep is usually all you need. If your numbers change, you re-import and the map and the territory totals refresh to match your latest file.
Can I see a sum or an average for a group?
Both are available. When you group locations into a territory, Maptive can show the total of a column, like all the sales added together, or the average across the locations in that area. The sum answers how much a whole region is worth, while the average tells you the typical account inside it. You switch between them without rebuilding anything, so one map answers two different questions. Many teams read the sum to size a territory and the average to sanity-check it, catching a region that looks big only because of one large account.
Does the pop-up total update when I move an account?
Yes. When you drag an account from one territory into another, both pop-ups recalculate on the spot. The area losing the account drops its total, and the area gaining it goes up, so you see the trade the moment you make it. Nothing has to be re-summed by hand and no spreadsheet needs editing. This makes it quick to test a change, since you can move a few large accounts between regions and watch the totals settle until the split looks right. When you are done, the map already reflects the new numbers.
Can I export the territory totals to a spreadsheet?
Once your territories and their summed figures are on the map, you can export the data to an .xlsx, .csv, or .tsv file. That gives you a clean table of each territory and its totals to drop into a report or share with someone who does not use the map. The export carries the numbers you grouped, so your sales and counts and census figures line up by territory. You can also share a view-only link if you would rather people read the totals right on the map instead of in a file.
Can the team view territory totals without editing the map?
You can share a view-only link so managers and reps open the map, then click a territory to read its totals without changing anything. You decide who can edit and who can only look, and you can password-protect the link when the numbers are sensitive. This keeps one master map with the sales ops owner while everyone else works from the same figures. There is no trail of emailed spreadsheets going stale a day after you send them, since the map always shows the current totals for every territory.








