


Franchise Territory Demographics & Brand-Standard Qualification
See if a franchise territory meets the brand’s numbers before you sign. Maptive reads the census population, income, and age inside any boundary you draw.
No credit card required
- Draw any trade area by radius, drive time, or ZIP codes
- Read population, median income, and age band inside the boundary
- Sum more than 50 US Census variables under any area
- Check the youth or daytime density behind a candidate site
- Set the census total next to the published brand minimum
- Open a marker or area pop-up to see the numbers behind it
Trusted by teams at









The Demographic Snapshot
Every number a brand standard asks for is already loaded under the boundary you draw, ready to read on your real market.
Reading census inside each boundary raises the share of territories that meet brand standards by 29%.
Checking demand before signing cuts openings that miss target by about 24%.
Pulling population, income, and age on the map speeds territory qualification by 36%.
The Numbers Inside a Candidate Boundary
Draw the catchment the brand uses and read the census population, income, and age inside that shape.
| 01 |
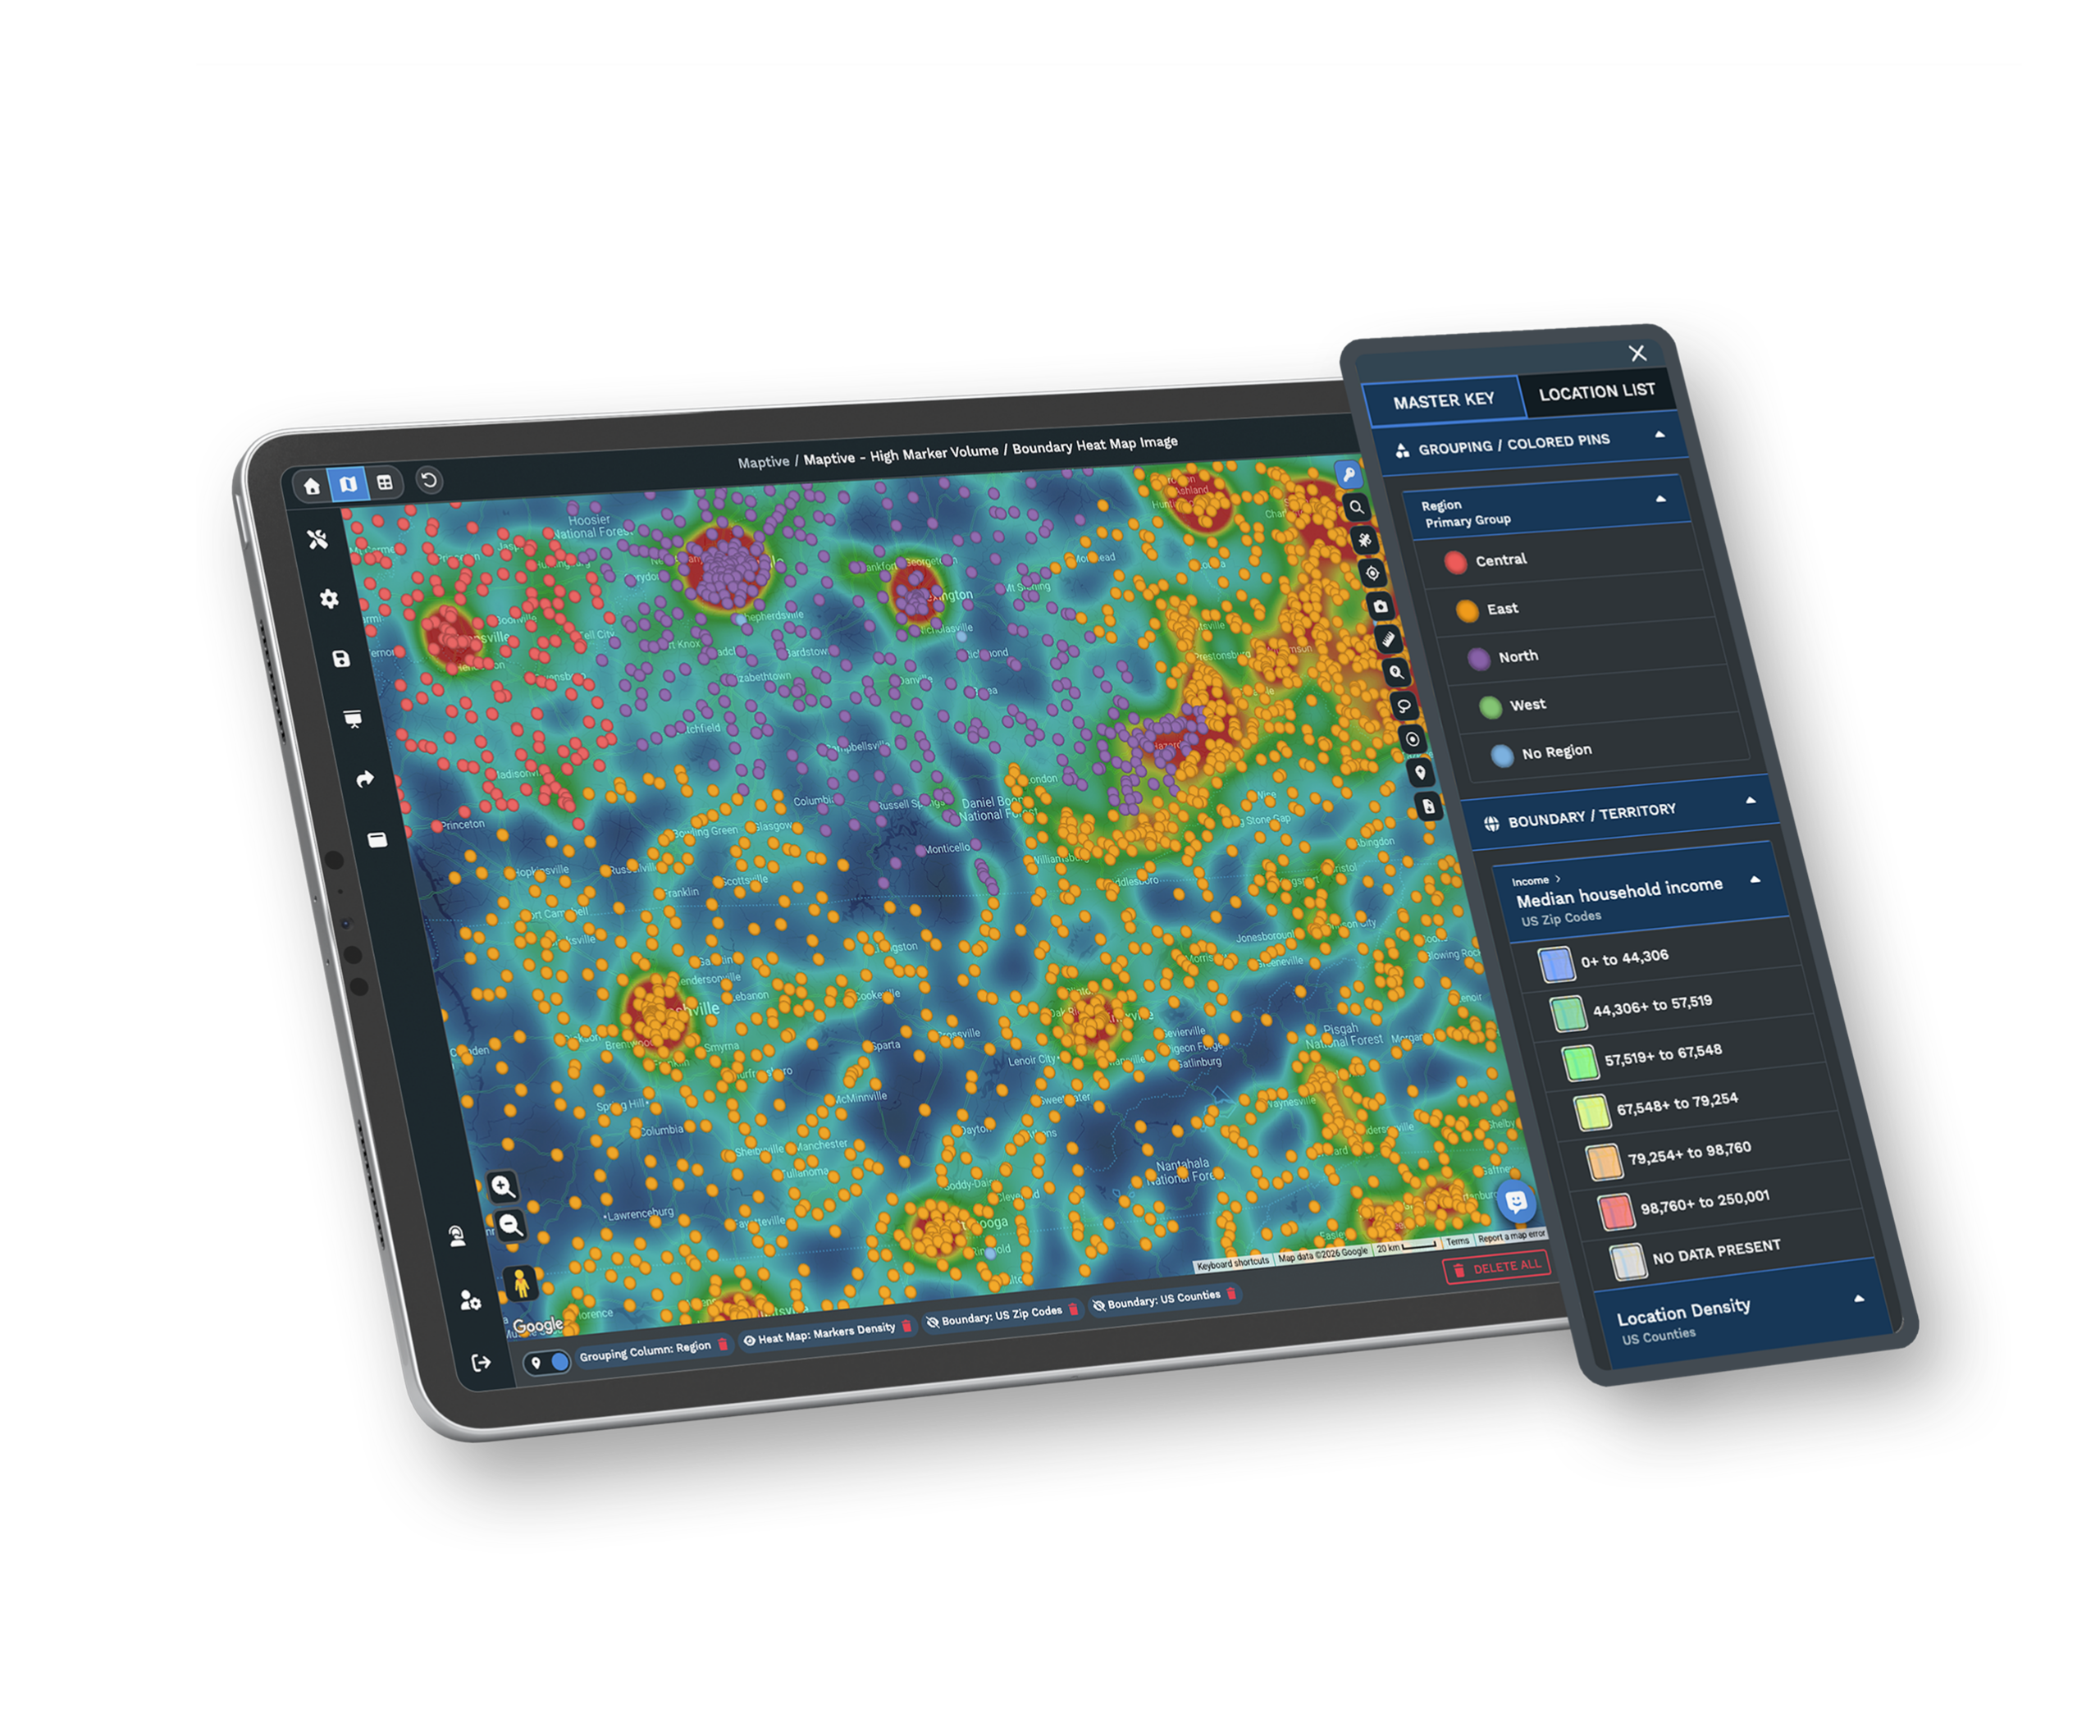
Population, Income, and Age Read From the US CensusDemographic Overlays sum US Census Bureau and American Community Survey figures inside your boundary, so you see the total population, median household income, and the count of people in a target age band without pulling a single ACS table by hand. Explore demographic overlays → |
| 02 |
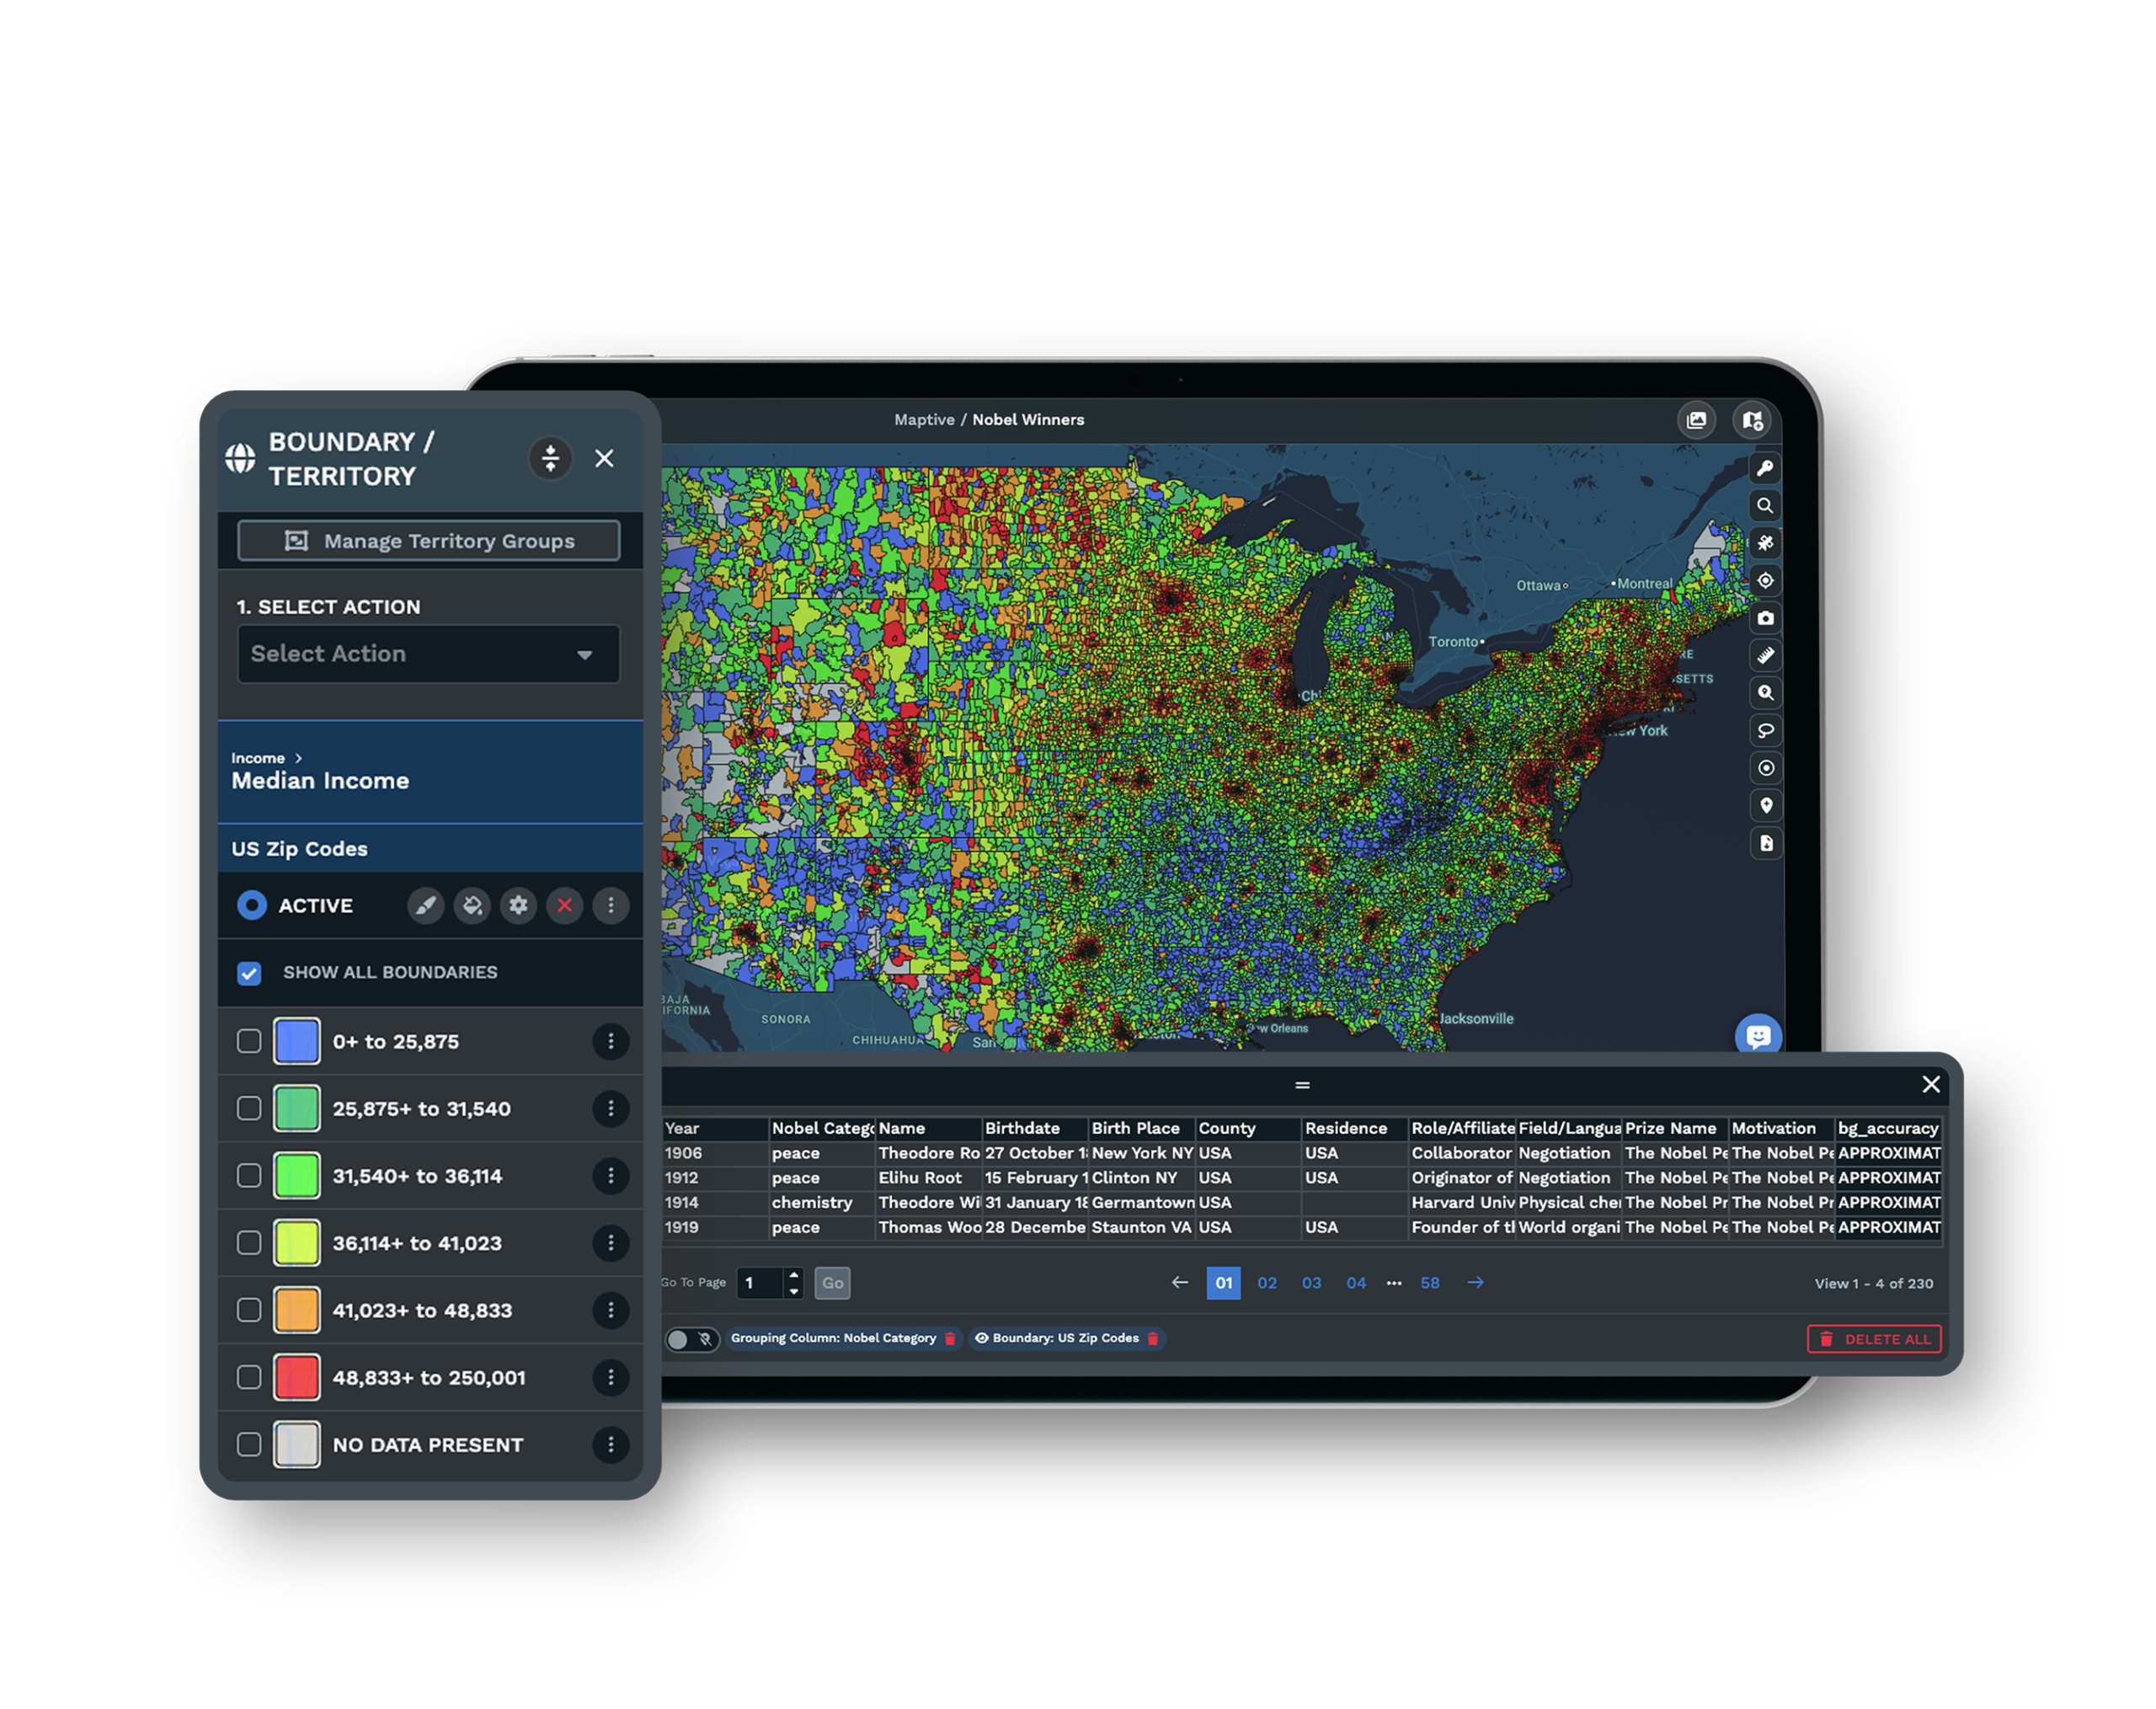
A Trade Area Drawn by Radius or Drive TimeDraw the catchment as a fixed-mileage Distance Radius or a Drive Time Polygon along real roads, then read the demographics inside that shape. A five-minute drive covers different ground in a dense grid than along a suburban highway, so the boundary you choose changes the count. Explore the boundary tool → |
| 03 |
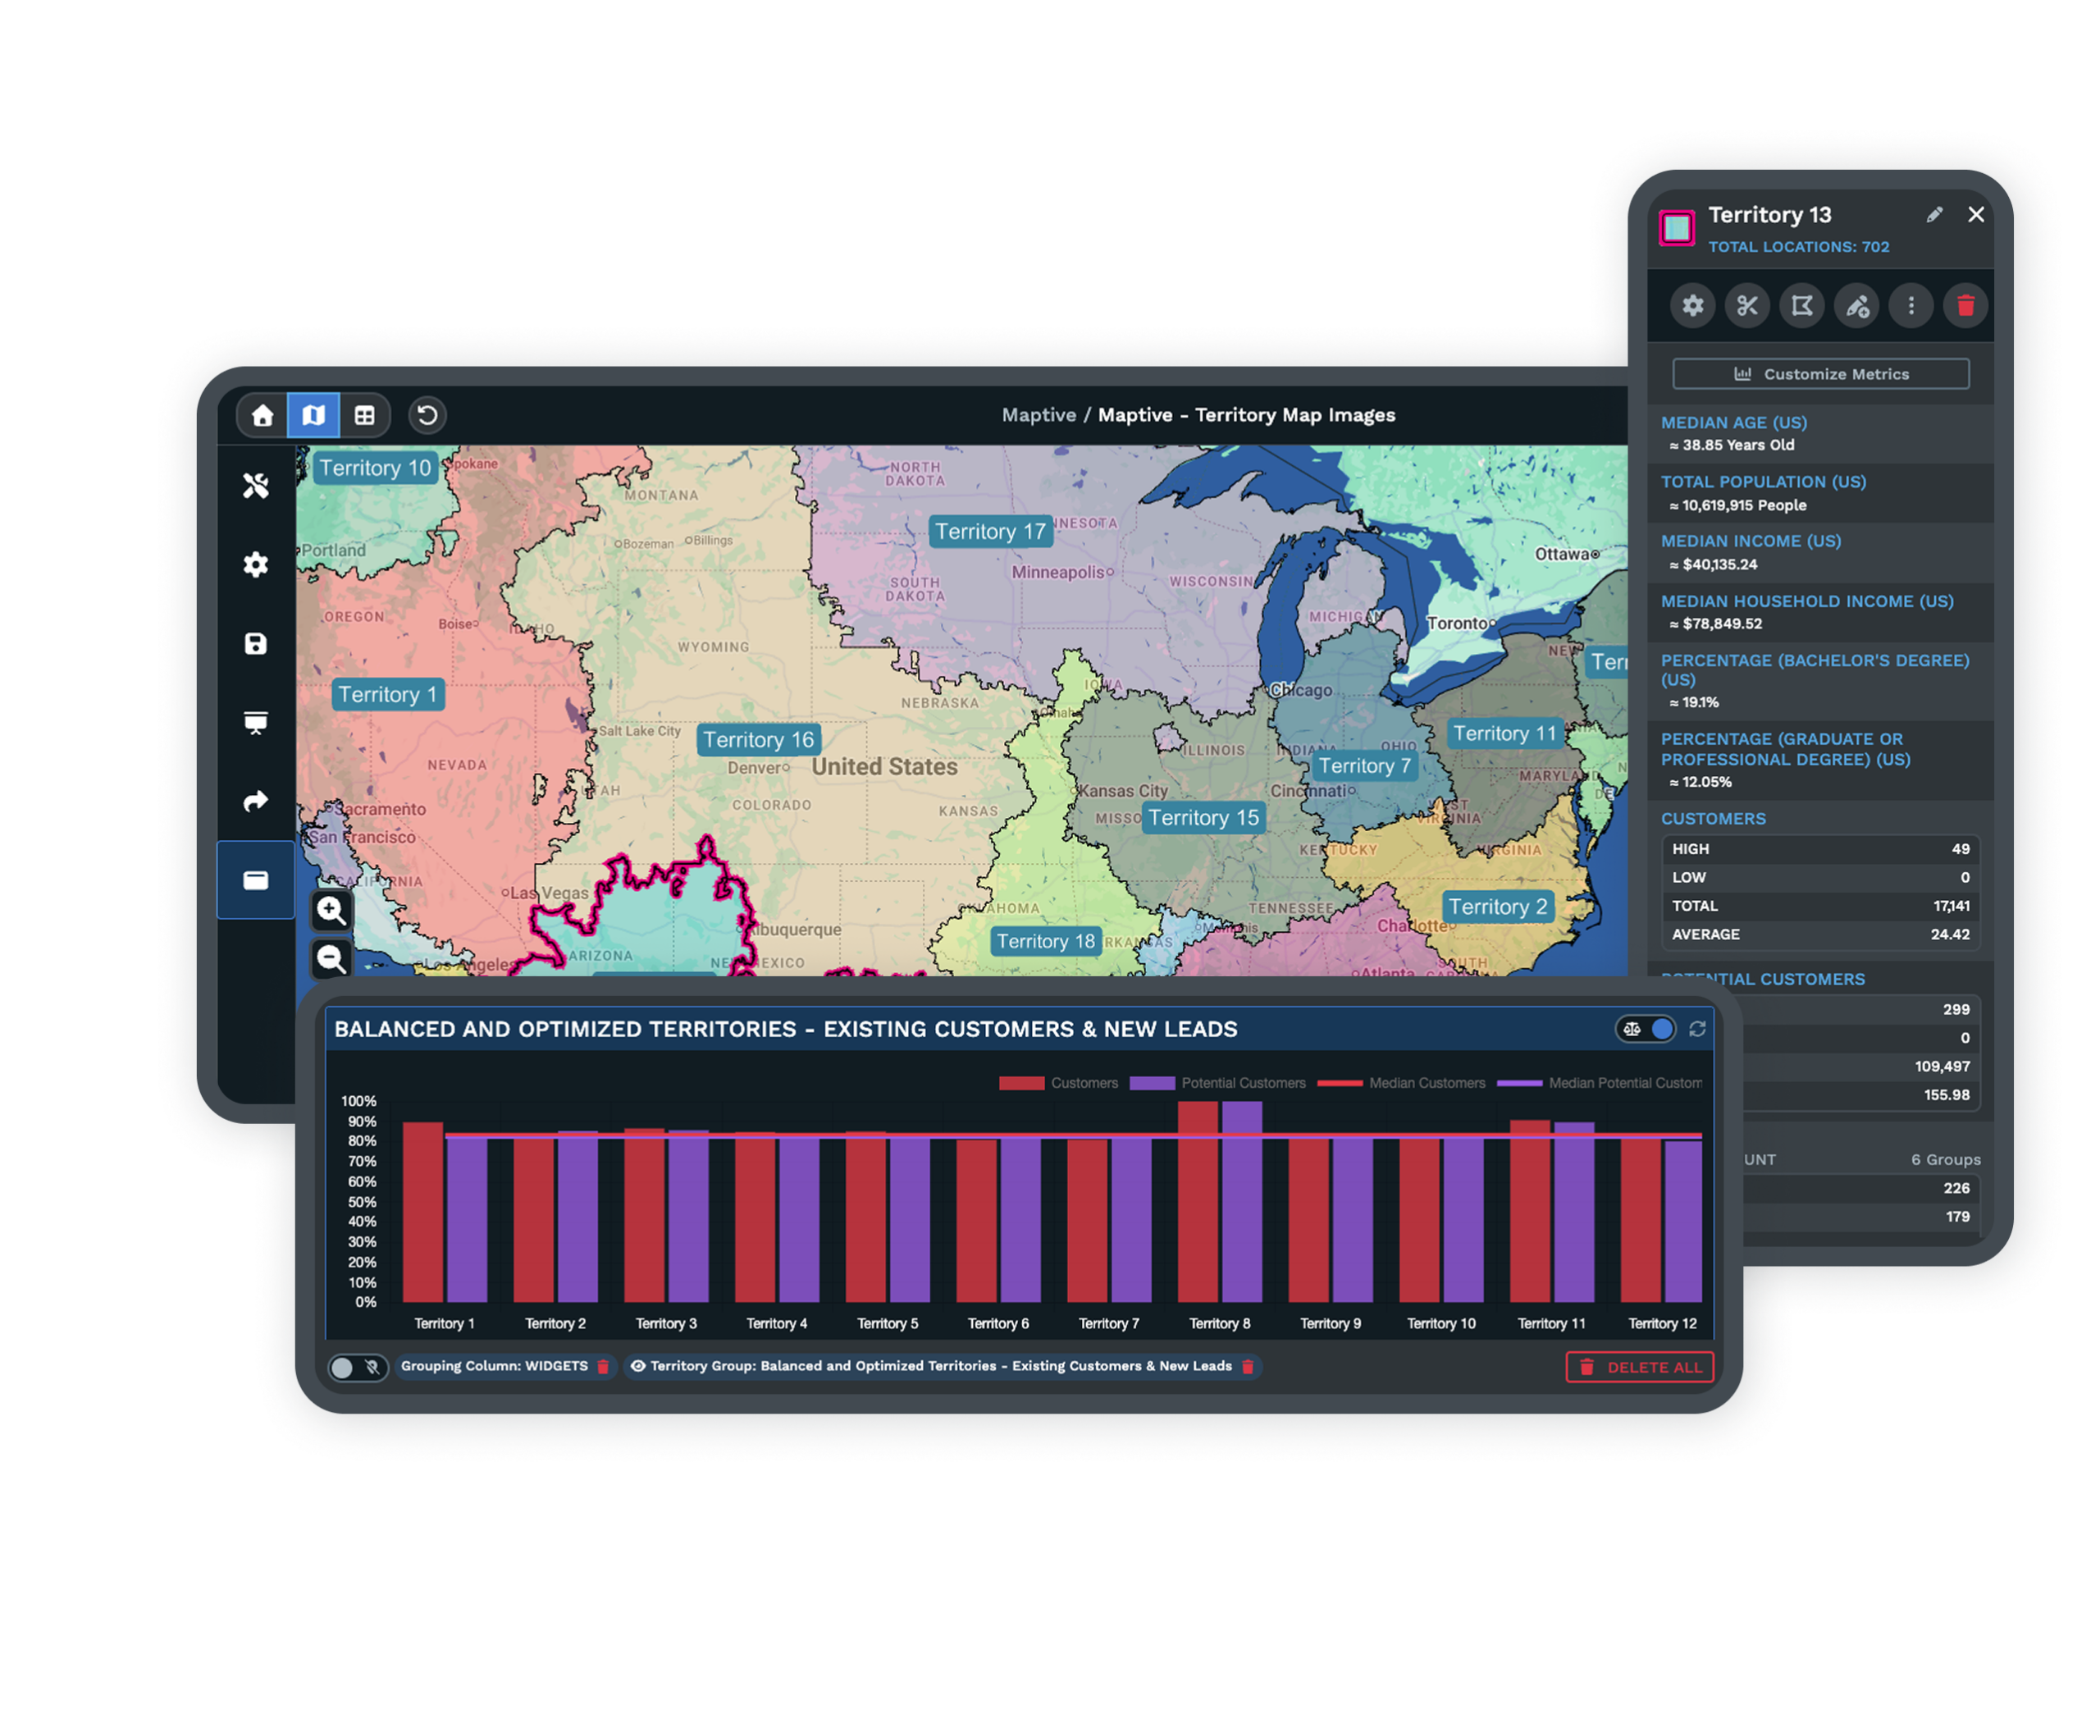
Youth and Daytime Density for the Right ConceptsRead the youth population for a children’s concept or the working-age density near an employment center, so a food or tutoring brand qualifies on the people who show up during the day, not only the residents on the census roll. Explore the heat mapping tool → |
| 04 |
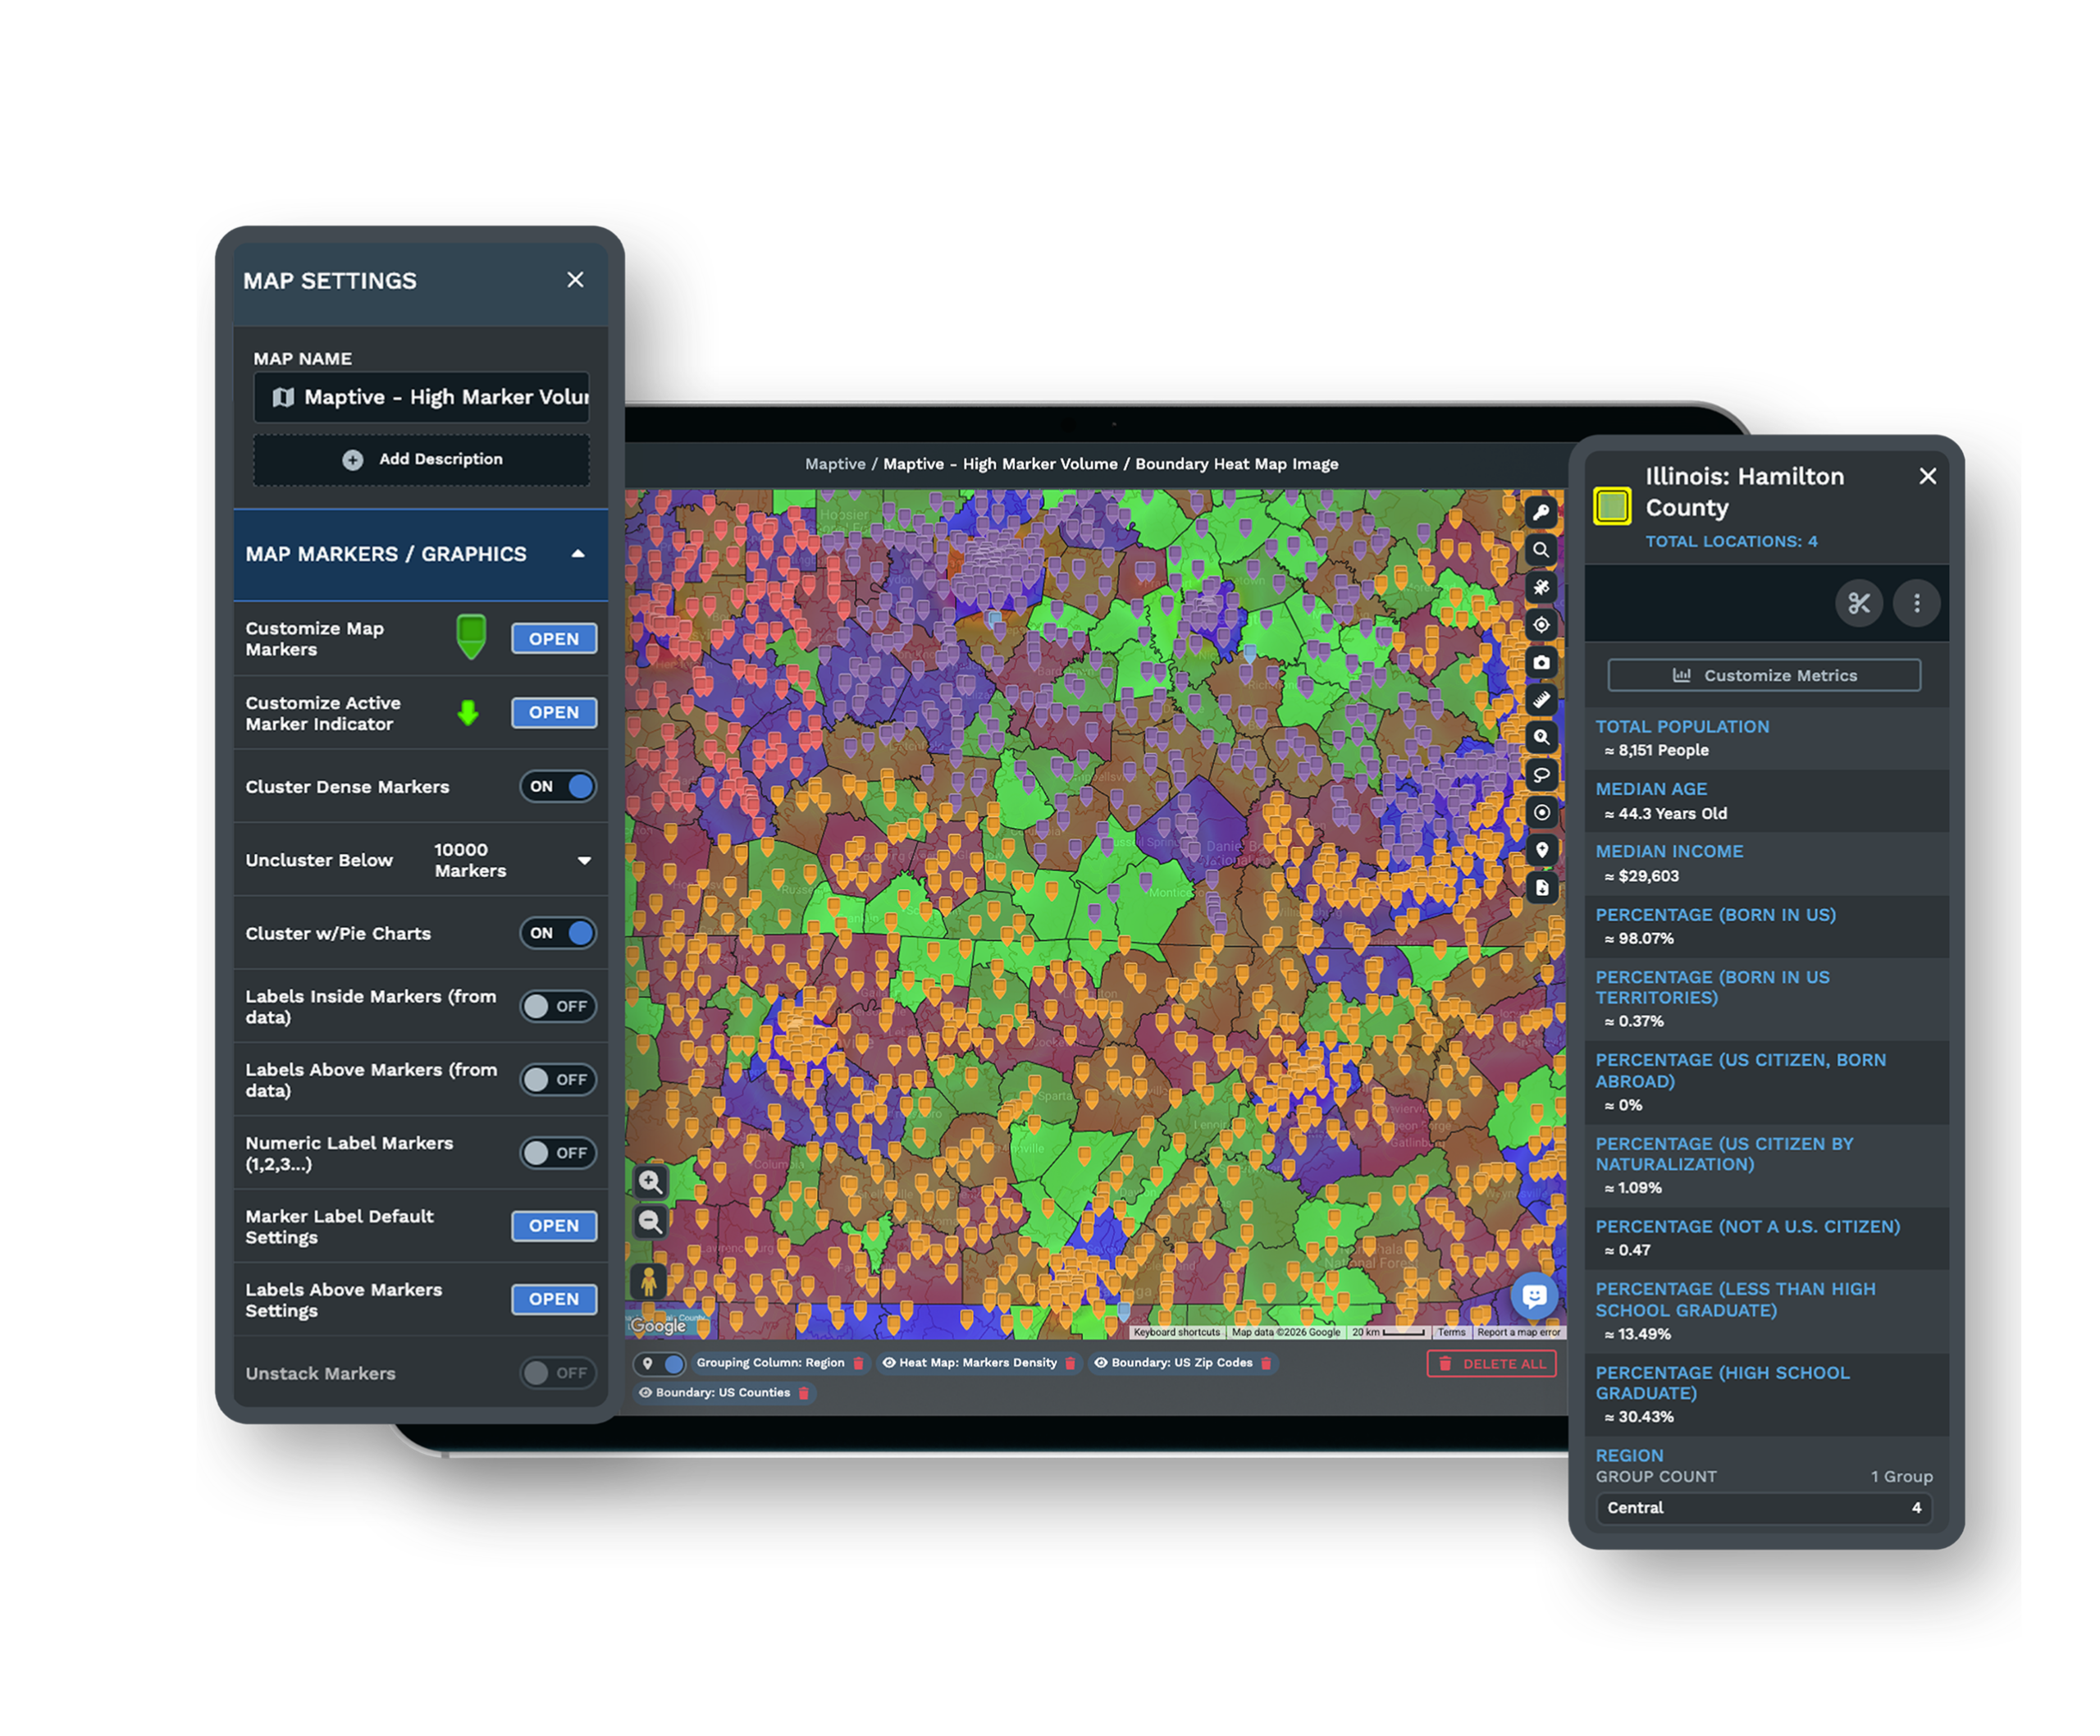
Numbers on the Marker and the Area Pop-UpClick a marker or an area to open a pop-up that carries its census fields, so the median income and population behind a candidate site sit one click away while you compare two territories. |
Reducing a Brand Standard to a Single Figure
Most brand standards come down to one figure inside a boundary. A children’s-enrichment brand wants a count of kids in an age band and a household-income floor. A fitness concept wants working-age adults above an income line. A quick-service unit wants daytime workers within five miles. The job is the same each time. Draw the trade area the brand uses, sum the census variable that matters, and set the total next to the published minimum.
Maptive produces that figure from the population, income, and age already loaded under the boundary, so the answer is a number you can defend rather than a guess about how the area looks on paper.
A Territory Strong on Paper but Short in Reality
A candidate site can look right on foot traffic and rent, then miss on the numbers that decide if the concept survives. Population alone is a trap. A high-population area can lack the income a premium brand needs, and a wealthy pocket can lack the volume a value concept runs on. Overlay median household income and the target age band on a territory that seemed obvious, and the fit often shifts.
Running the demographics also gives you evidence to weigh the franchisor’s sales targets against the boundary you were assigned.
Accurate Census Data and a Team Behind It
White-Glove Setup for Your First Run
The onboarding team cleans your candidate list, sets up the map, and walks you through reading demographics inside a boundary, so your first qualification runs correctly.
Trusted by National Multi-Location Brands
Coca-Cola, Hilton, and CBRE run their location analysis on the platform, the same census-backed boundaries a franchise buyer uses to qualify a single trade area.
Reliable Access to the Data You Rely On
A 99.9% uptime record keeps the census layer and your saved territories available when a discovery-day deadline or a lease review lands on a short clock.
Free trial with the full platform and no credit card
Run the Numbers on One Territory
Start a 10-day free trial with no credit card and every tool unlocked. Draw the boundary the brand uses, read the population, median income, and age band inside it, and set the total against the minimum, all on the real market you are weighing.
Review the Numbers Together
If the decision runs through a franchisor packet or a lease committee, a Maptive specialist will read the territory with you. Bring the boundary and the brand standard you have to meet, and the session reads the census figures inside the area in front of the people signing off.
Frequently Asked Questions
What’s the population and income inside this franchise territory?
Draw the territory as a radius, a drive-time area, or a set of ZIP codes, and the platform sums the US Census population and median household income inside that boundary. You read the total for the whole trade area in one figure rather than adding ZIP-level tables by hand, and you can open a pop-up on any point to see the numbers behind it.
Does this area meet our demographic minimums?
Draw the boundary the brand uses, sum the census variable the standard names, such as households above an income floor or people in a target age band, and set that total next to the published minimum. Most brand standards reduce to a single figure inside a boundary, so qualification is reading that one number and checking it against the threshold.
What demographics matter for a franchise location?
Franchisors weight total population, household income, age distribution, population density, daytime population, and household size most heavily. A common coaching rule puts about 70 percent of the analysis on demographics and 30 percent on competition, because the demographic fit predicts long-term performance more reliably than the current competitor picture.
Where does franchise demographic data come from?
US figures come from the US Census Bureau and the American Community Survey, which carry population, income, age, education, and housing for every geography. The platform reads those variables directly inside your boundary. For Canadian markets the equivalent geographies are Forward Sortation Areas and postal codes against Statistics Canada data.
Should I use a radius or drive time to define a franchise trade area?
A drive-time area usually reflects the real catchment better than a plain circle, because five minutes of driving reaches different ground in a dense city than on a suburban highway. A radius is simpler to state and explain, but it can over- or under-count the reachable population. Draw both inside the platform and compare the census totals each one returns.
How much population does a franchise territory need?
It depends on the concept. Service franchises are often described needing 25,000 or more people within about ten miles, and retail concepts often need 50,000 or more for profitability. One cited territory clause requires no fewer than 75,000 people and 20,000 qualified households within a three-mile radius, a figure you can read straight from the boundary.
Why does daytime population matter for a franchise?
Daytime population counts the workers present during business hours, which resident counts miss, so it decides sites for food, coffee, and quick-service concepts near employment centers. Cited benchmarks include targeting 10,000 or more daytime workers within walking distance or 100,000 within five miles, both readable inside a drawn trade area.
Can a franchise buyer choose their own territory?
Usually not. The franchisor assigns the territory, and the buyer holds contractual rights to operate inside defined boundaries for the term rather than owning the area. Running the demographics still matters, since it shows if the franchisor’s sales targets are realistic for the boundary and gives you evidence to negotiate encroachment protections or size.
How do I verify the demographics a franchisor gives me?
Request the franchisor’s demographic packet, then independently sum population, median household income, the target age band, and competition inside the territory boundary against census data. Cross-read that against the Item 19 figures for existing units.








