


Score & Price Franchise Territories for Sale
Rank every metro you plan to sell, attach an opportunity score, and set a fair territory price. Maptive maps the census, competition, and drive-time reach behind each number.
No credit card required
- Plot every candidate metro at once and compare them on the same scale
- Overlay census income, population, and growth behind each market
- Draw drive-time reach around each likely site with the polygon tool
- Read competition density against the census layer on one canvas
- Attach an opportunity score and set a price in every marker pop-up
- Color the metros into A, B, and C tiers and share the scored map
Trusted by teams at









Opportunity Scoring Across Every Metro
Scoring each metro on the same data makes territory pricing about 27% more consistent.
Mapping census, competition, and reach behind each price speeds deal prep by 24%.
Ranking opportunity before you sell raises fairly-priced territories by 31%.
Building the Inputs Behind Each Territory Score
| 01 |
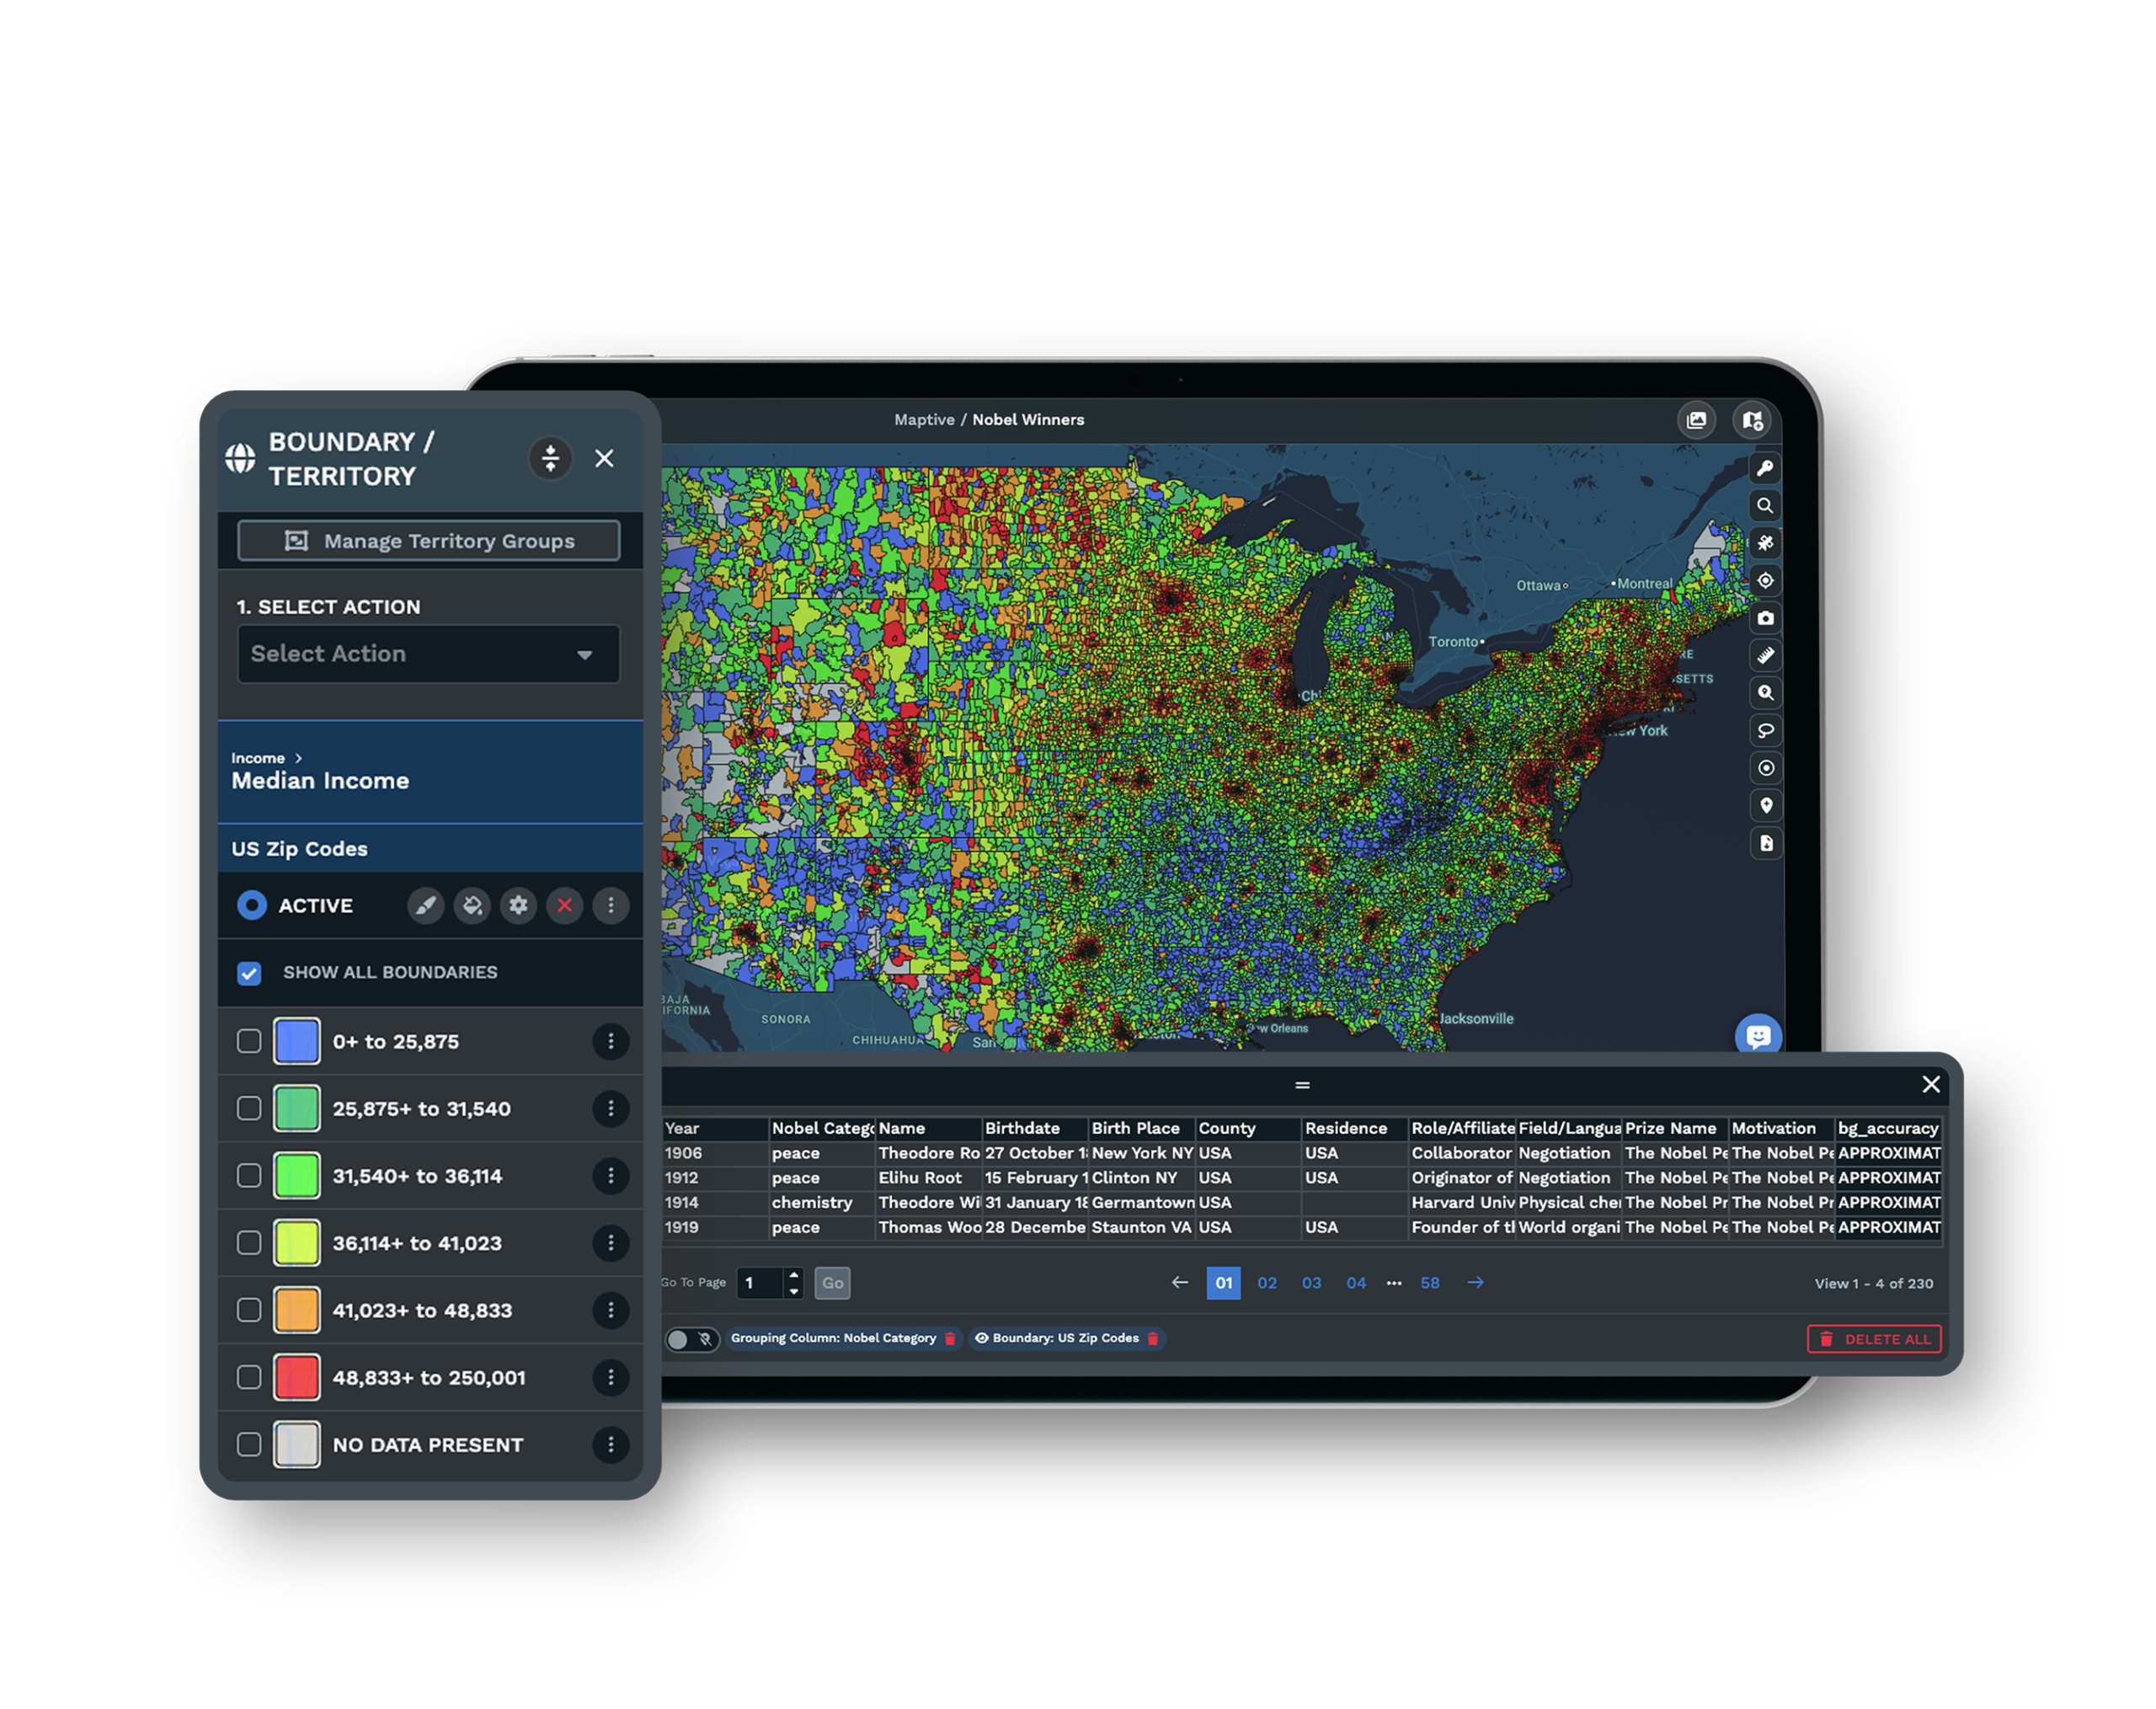
Census Demand Read Per MetroDemographic Overlays read US and Canada census income, population, and age into each metro boundary, so the score rests on who lives in the market and what they can spend rather than headcount alone. Explore demographic overlays → |
| 02 |
Earnable Reach by Drive TimeDistance Radius and Drive Time Polygon tools measure the customers a location can realistically reach, since a wide ZIP list can hold people 40 minutes away that a franchisee will never serve. Explore drive-time polygons → |
| 03 |
Competition Density on the Same CanvasLoad competitor and existing-unit locations, then read saturation against the census layer, so a crowded metro scores lower than an open one with the same population. |
| 04 |
Scored Fields in the Marker Pop-UpClick any metro to open its pop-up and read the fields you carried in, population, income, your score, and the price you set, so the whole rubric stays visible on the map you share. |
The Limits of Population as a Price Signal
Pricing a territory by raw population is the move most franchise consultants now warn against, since paying per thousand people prices airspace rather than earnable revenue. A metro with a large ZIP footprint can still be split by a river, thick with competitors, or full of households that rarely buy your product.
The stronger method scores each market on a consistent set of inputs, population and income from the census, competitive density, growth, and the drive-time reach around a likely site. Maptive builds those inputs on the map. It shows the demand, competition, and reach behind a market so you can defend the number, rather than outputting a price on its own.
Sorting Metros Into A, B, and C Bands
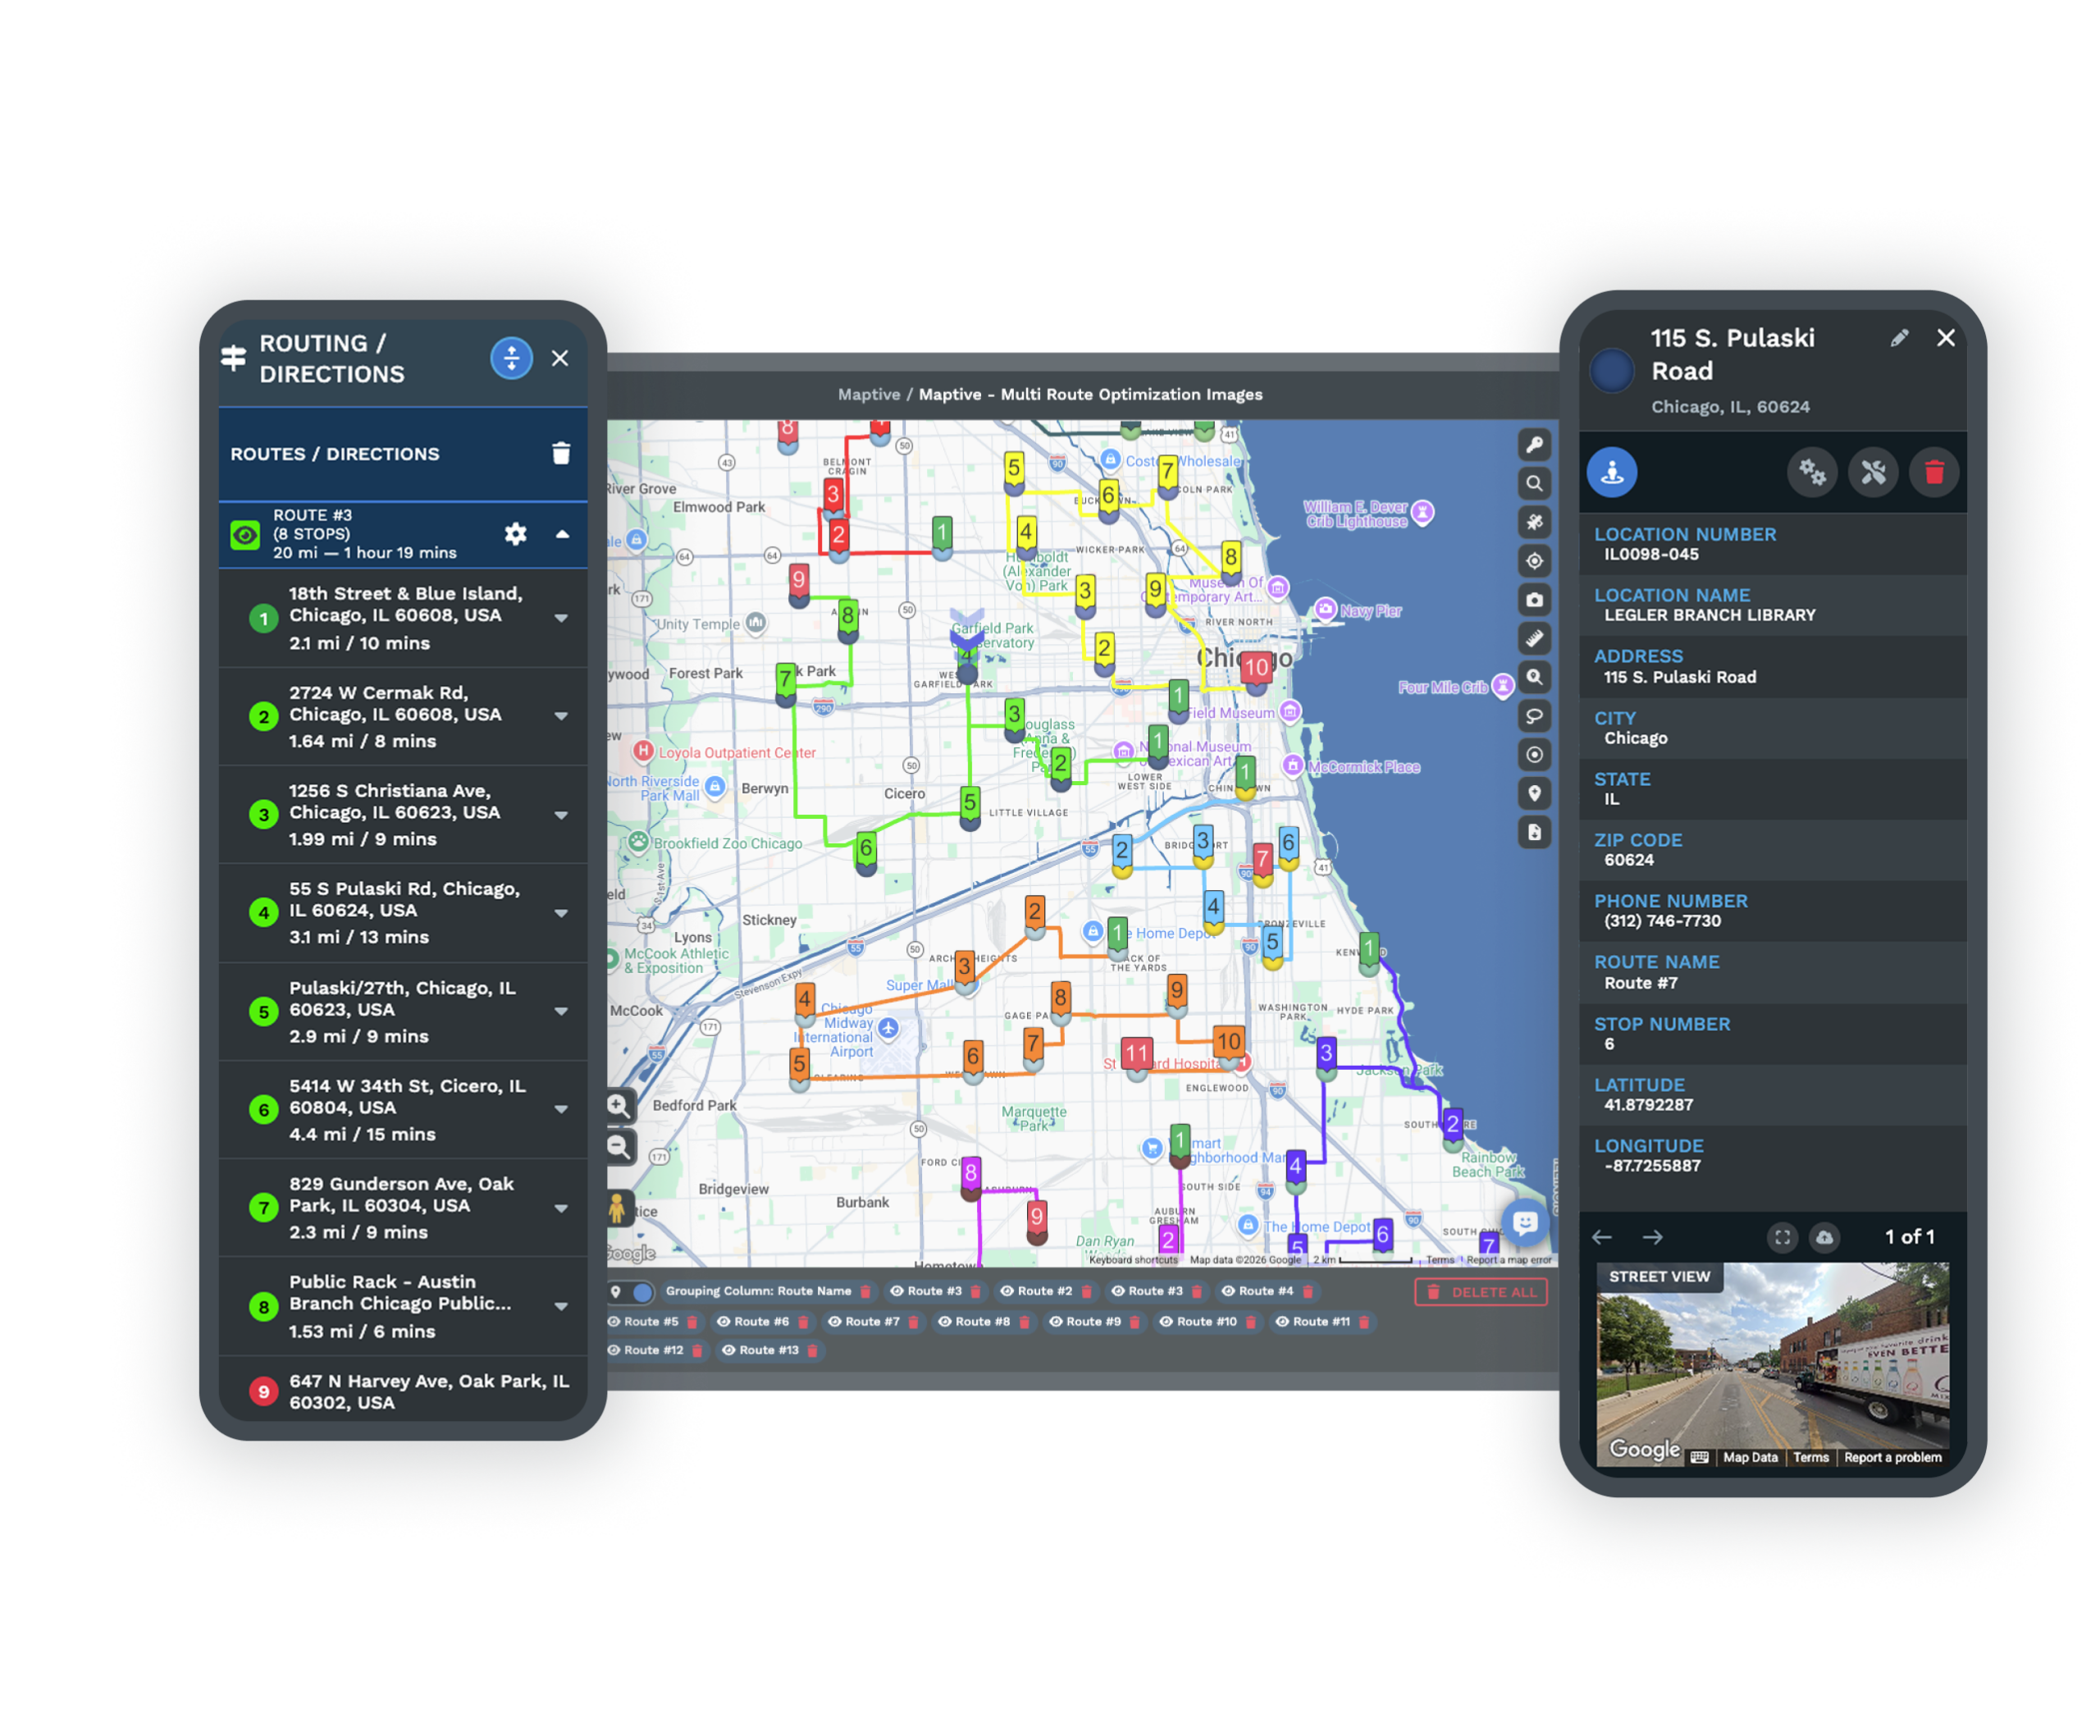
Once every metro carries a score, you group and color the markers into tiers, an A band for the strongest markets, a B band for the solid middle, and a C band for the marginal ones. The colored map makes the ranking legible to a development committee at a glance.
From there, pricing follows the tier rather than the population count. Superior markets are commonly reflected through the royalty structure or the development fee rather than a larger flat franchise fee, and a market released to an area developer often prices near the full fee for the first unit and lower for each unit after. The tier sets the terms, and the map shows why each metro sits where it does.
Accurate Data and a Team Behind the Score
Census Figures From the Bureau
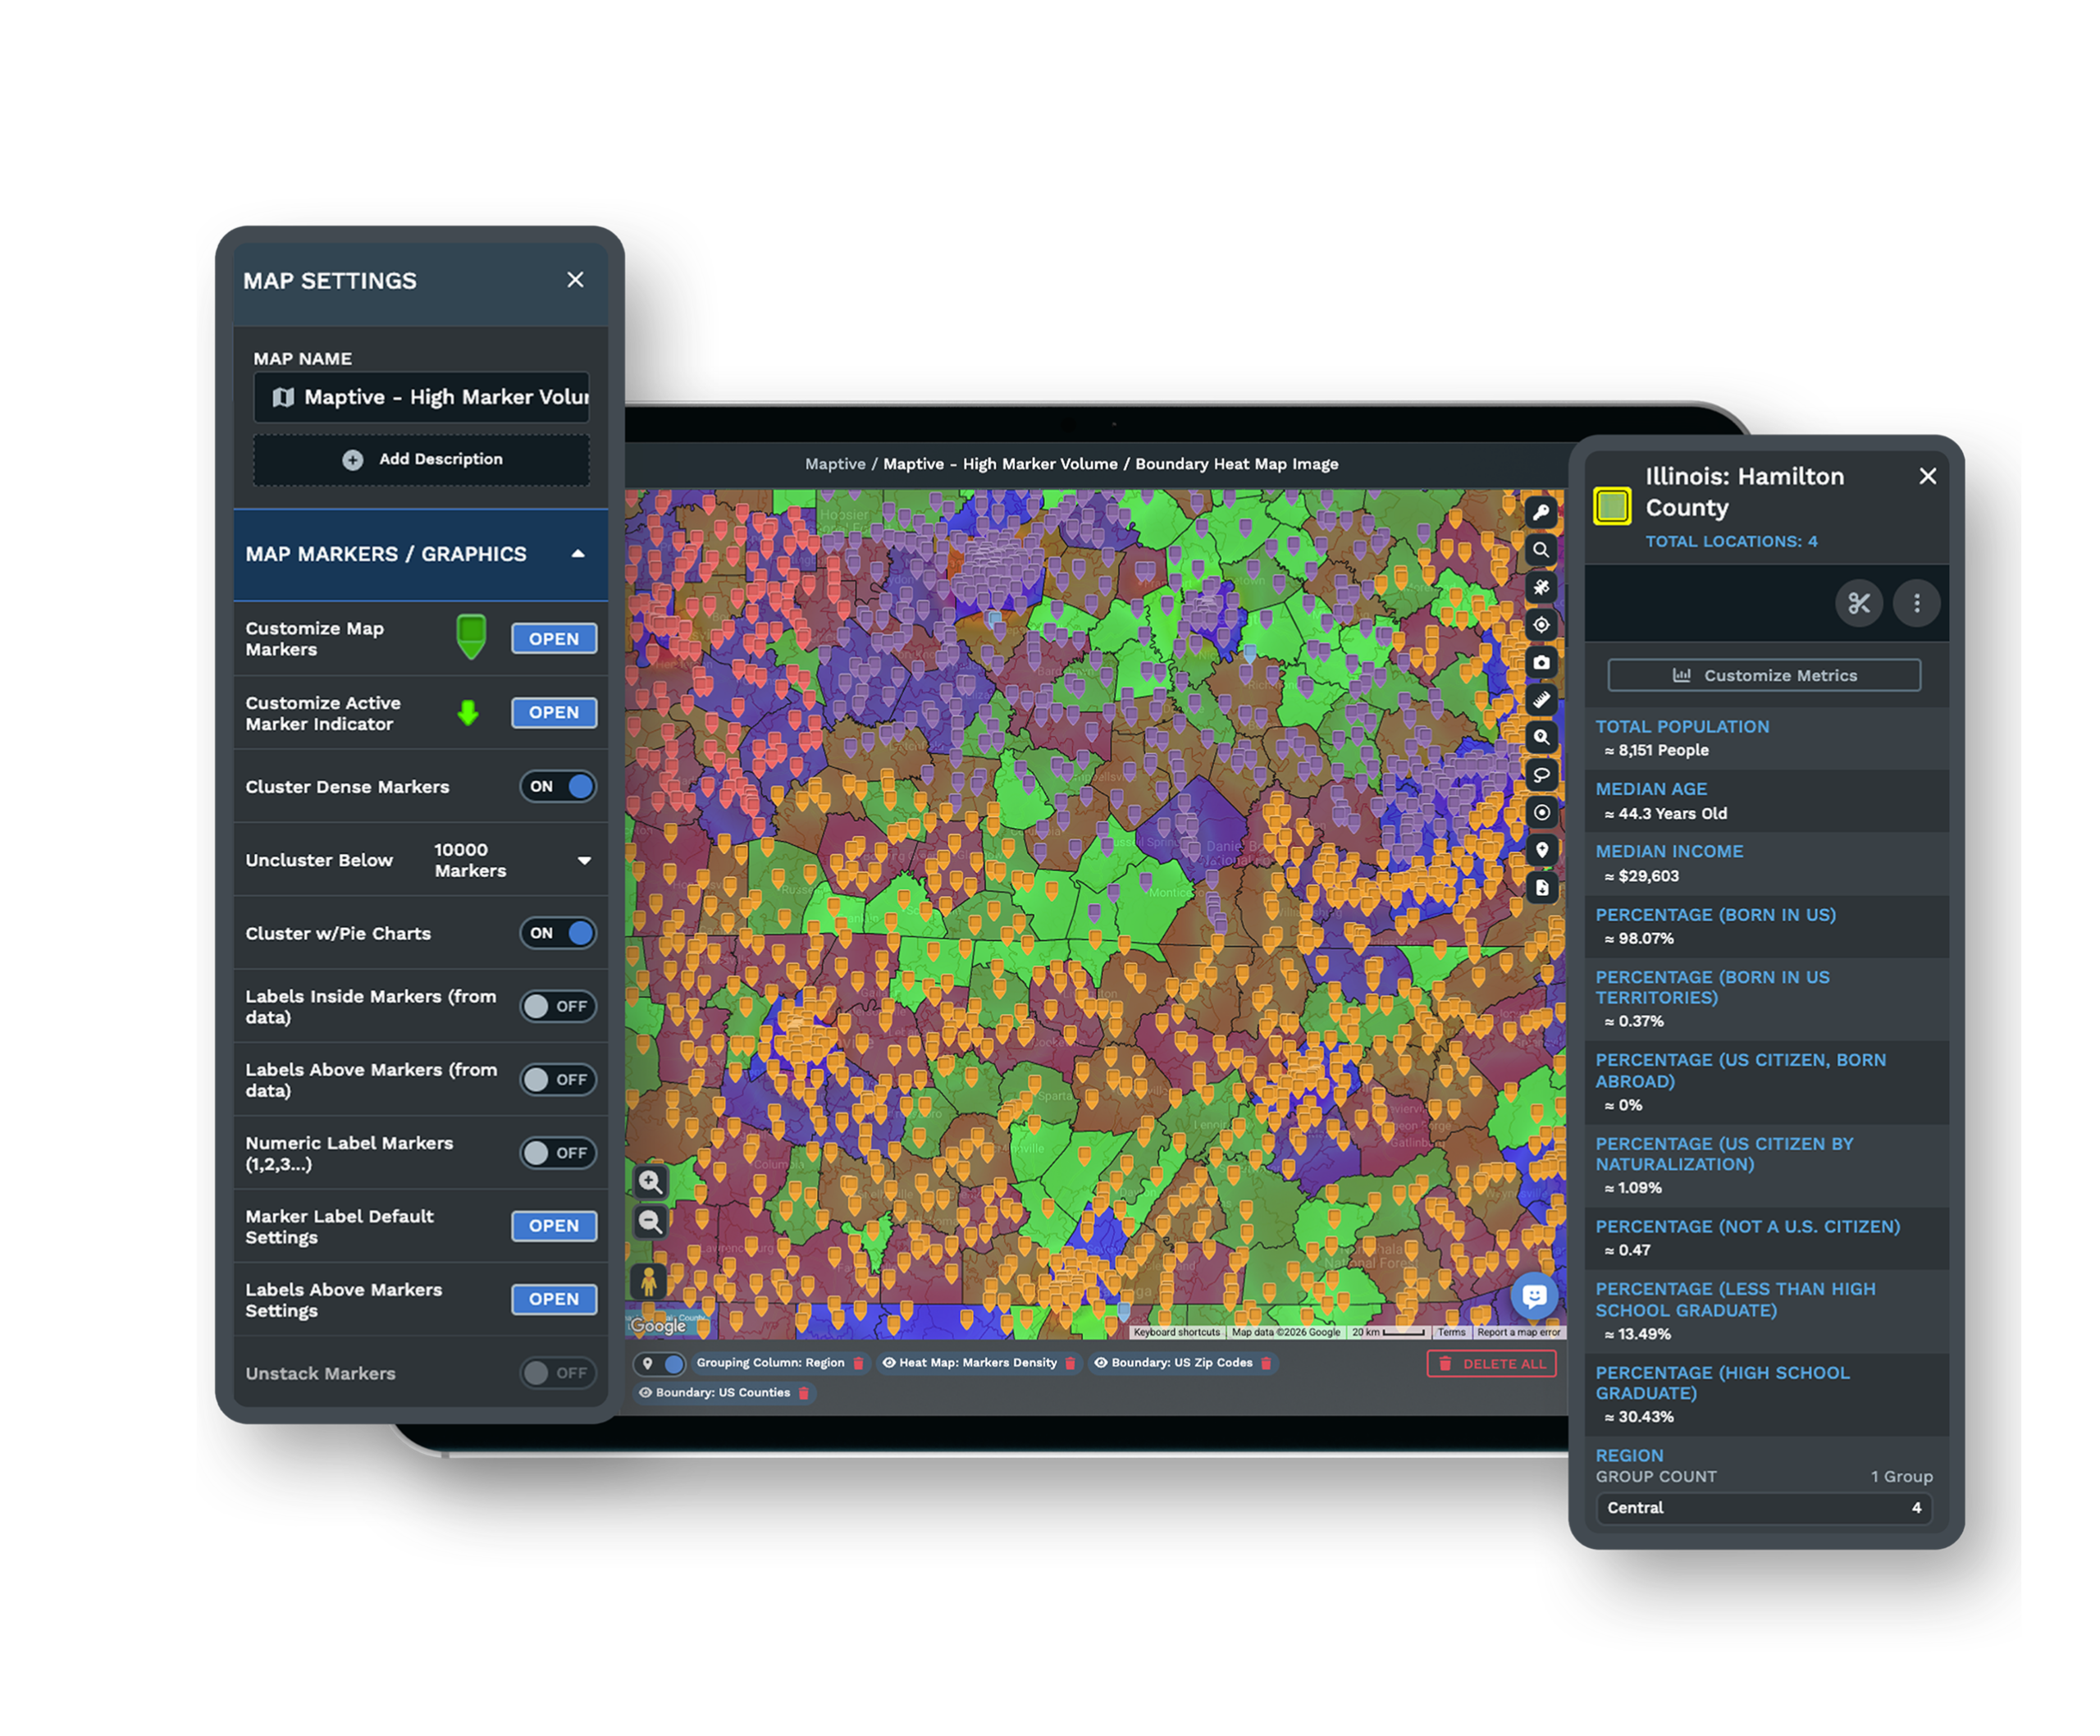
The demographic layer draws on US Census Bureau data across US and Canada markets, so the income and population feeding each score come from a source a prospect and their attorney can check.
A Map You Can Share for Sign-Off
Send a shared map link to your development team or a prospect, set each viewer to view-only or edit, and password-protect the version that leaves the building, so the scored map stays controlled while it travels.
Support and Uptime While You Price
A US and Canada support team answers in under 15 minutes at a 9.7 out of 10 rating, and 99.9% uptime keeps the scored map open when a committee is reviewing the pricing.
Free trial with the full platform and no credit card
Score Your Markets for 10 Days
Start a 10-day free trial with no credit card and every tool unlocked. Import your MSA list, overlay census income and population, draw drive-time reach around each candidate site, color the metros into tiers, and set a price against each one on your real market data.

Price Your Territories Alongside a Specialist
If your pricing goes before a development committee or an area-development negotiation, a Maptive specialist will build the scored map with you. Bring the metros you plan to sell, and the session lays out the census, the competition, and the drive-time reach behind each tier for the people signing off.
Frequently Asked Questions
How do I price franchise territories for sale?
There is no single industry formula. Franchisors model the unit economics for the market, weigh population, household income, demand, and competition, then set a development or franchise fee against the franchisee’s acceptable return. Superior markets are usually reflected through royalty structure or development terms rather than a larger flat fee, so a defensible score matters more than a population multiplier.
Can I score metros by income and population?
Yes. You overlay US Census and American Community Survey figures on each metro, population density, household income, age, and growth, then compare markets on the same scale. Working at the MSA or CBSA level lets you rank markets like for like, and the score improves when you add competitive density and drive-time reach to the raw census numbers.
How much is a franchise territory worth?
A territory’s worth comes from earnable opportunity, the target customers, their spending power, the competition, and the drive-time reach around a likely site, not from headcount alone. The credible way to show worth is to tie real sales performance to the geography rather than borrow another territory’s figures, which a mapped set of inputs makes far easier to defend.
How do I rank markets for franchise expansion?
Score each market on a consistent set of inputs, population, household income, demand, competitive density, growth, and drive-time reach, then sort the results into tiers such as A, B, and C. Heat mapping surfaces the white space, and releasing markets from strongest tier to weakest keeps your best territories from being sold cheaply early.
Should a bigger territory cost more?
Not automatically. Charging by population is widely viewed as an unsubstantiated fee that fell out of favor, because a large ZIP count can overstate real opportunity once drive-time reach and competition are accounted for. A compact, dense metro can out-earn a sprawling one, so the score, not the acreage, should drive the price.
What is an area development fee and how is it calculated?
A multi-unit developer pays a development fee for the right and obligation to build out a defined market. A common rule of thumb is 100% of the initial fee for the first unit and 50% for each additional unit, applied pro-rata as each location’s agreement is signed. Tiered structures often reduce the per-unit fee further as the count rises.
How many metro areas are there in the US?
As of the July 2023 delineations there are 387 Metropolitan Statistical Areas. Together with micropolitan areas they form 925 Core-Based Statistical Areas that cover about 94.7% of the US population. Each MSA gives you a standard unit for comparing population, income, and job growth from one market to the next.
What data do I need to score a franchise territory?
You need census and American Community Survey demographics, population density, household income, age, and housing, plus your own customer or sales data, competitor locations, and a drive-time or trade-area boundary for each candidate market. The demographic overlays supply the census side, and you import the rest from a spreadsheet.
What is the difference between qualifying a territory and scoring it?
Qualifying asks if a single area clears your brand’s minimum thresholds, a pass or fail on demographics. Scoring ranks many markets against each other and attaches a comparative opportunity score and a price to each. Qualifying tells you a metro is acceptable, while scoring tells you where it belongs among all the markets you plan to sell.








