


Competitor Location Overlay for Territory Saturation & White Space
Plot your own list of competitors on top of your territories to see where a market is crowded and where the open ground is. Maptive layers both on one map.
No credit card required
- Layer your own units and full competitor list on one map, up to 200,000 pins
- Read more than 50 US and Canada census variables beneath the pins
- Color-code brands with the Grouping Tool and upload a logo as a marker
- Add a Heat Mapping pass so density reads against real demand
- Draw a Distance Radius or Drive Time Polygon to find the white space
- Share the saturation map as a view-only or password-protected link
Trusted by teams at









Market Saturation at a First Read
Everything you need to read a crowded market and find the open ground sits inside one platform, on your real markets.
Overlaying competitors surfaces about 34% more open-market opportunities.
Reading saturation before you commit cuts units placed in crowded markets by 26%.
Ranking markets by open ground improves site-priority accuracy by 22%.
The Layers Behind a Competitor Map
Bring your own competitor list, tag it by brand, read it against real demand, and draw the trade areas that reveal the gaps.
| 01 |
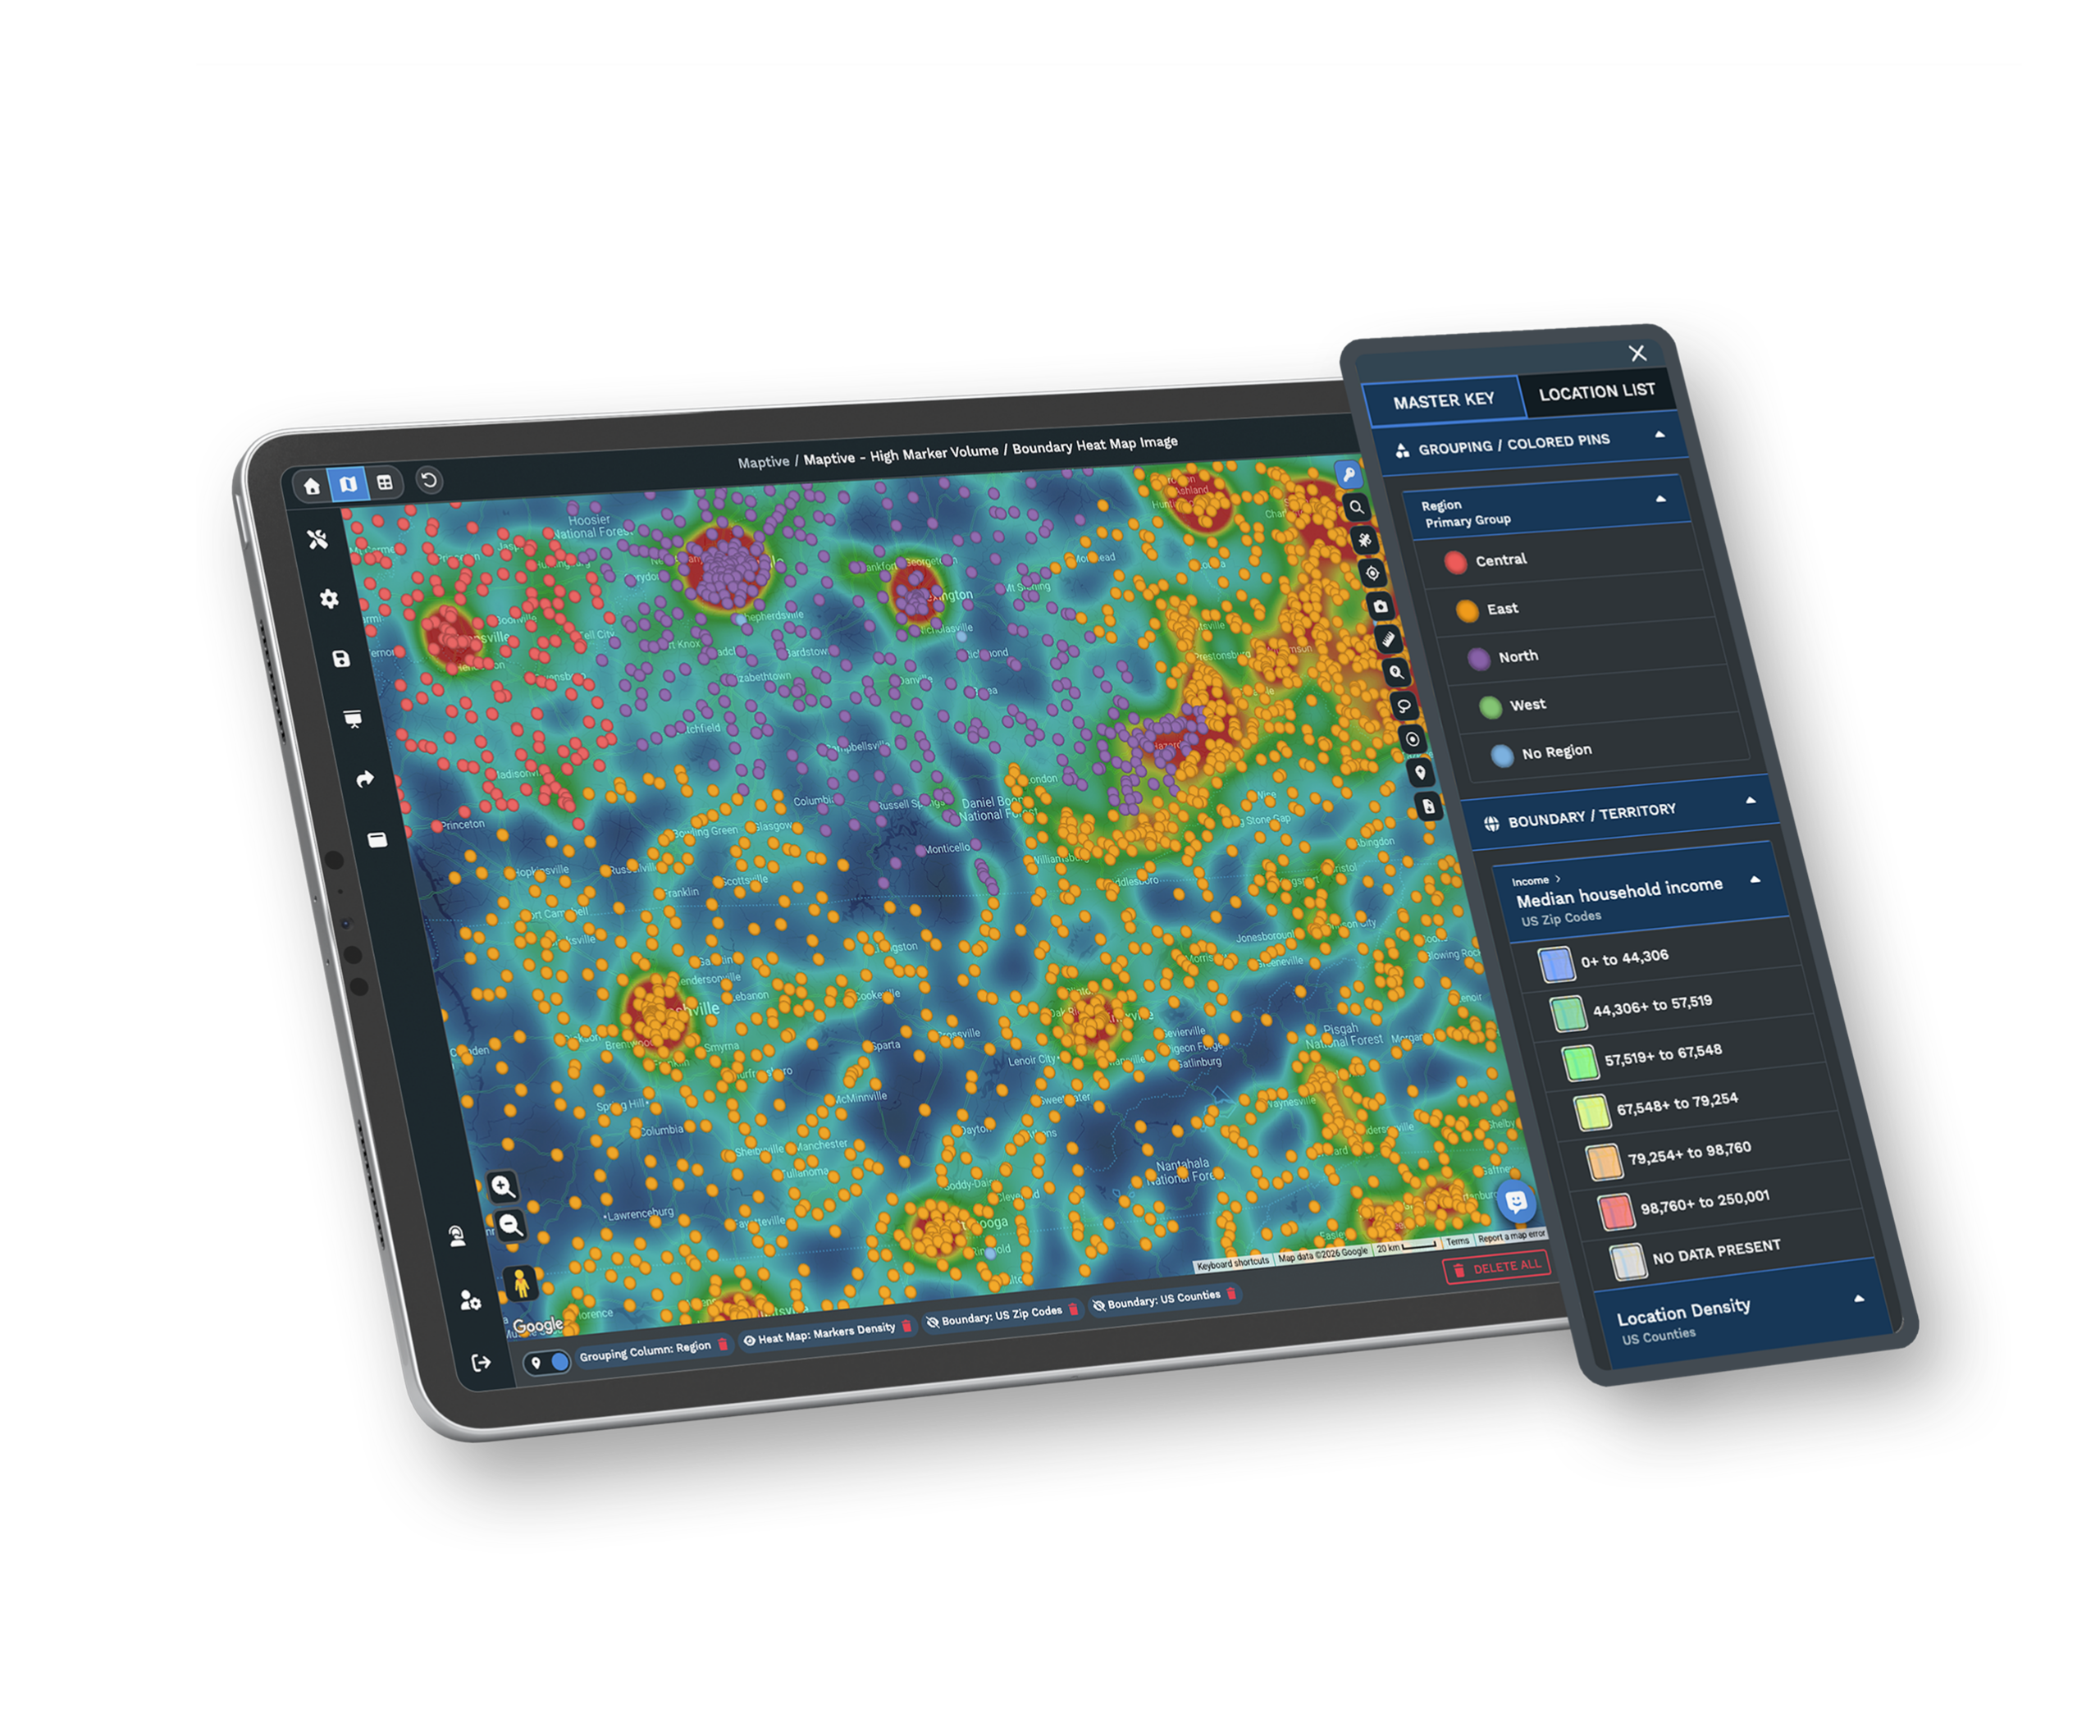
Your Own Competitor List as a Map LayerImport your list of competing businesses from Excel, CSV, TSV, or Google Sheets, and each row plots as a pin. You map the rivals in your industry, the food and service brands nearby, rather than a generic data set someone else chose. |
| 02 |
Tagged Pins for Separate BrandsColor-code the layer with the Grouping Tool so each competitor brand, store type, or segment reads in its own shade, and upload a logo as a custom marker when you want a brand to read at a glance. A dense corner tells you which names are crowding it. Explore the grouping tool → |
| 03 |
Saturation Measured Against Real DemandAdd a demographic overlay and a Heat Mapping Tool pass, and the competitor density reads against the population it serves. One brand per 4,000 residents and one per 50,000 look nothing alike, and the map shows which you are looking at. Explore heat mapping → |
| 04 |
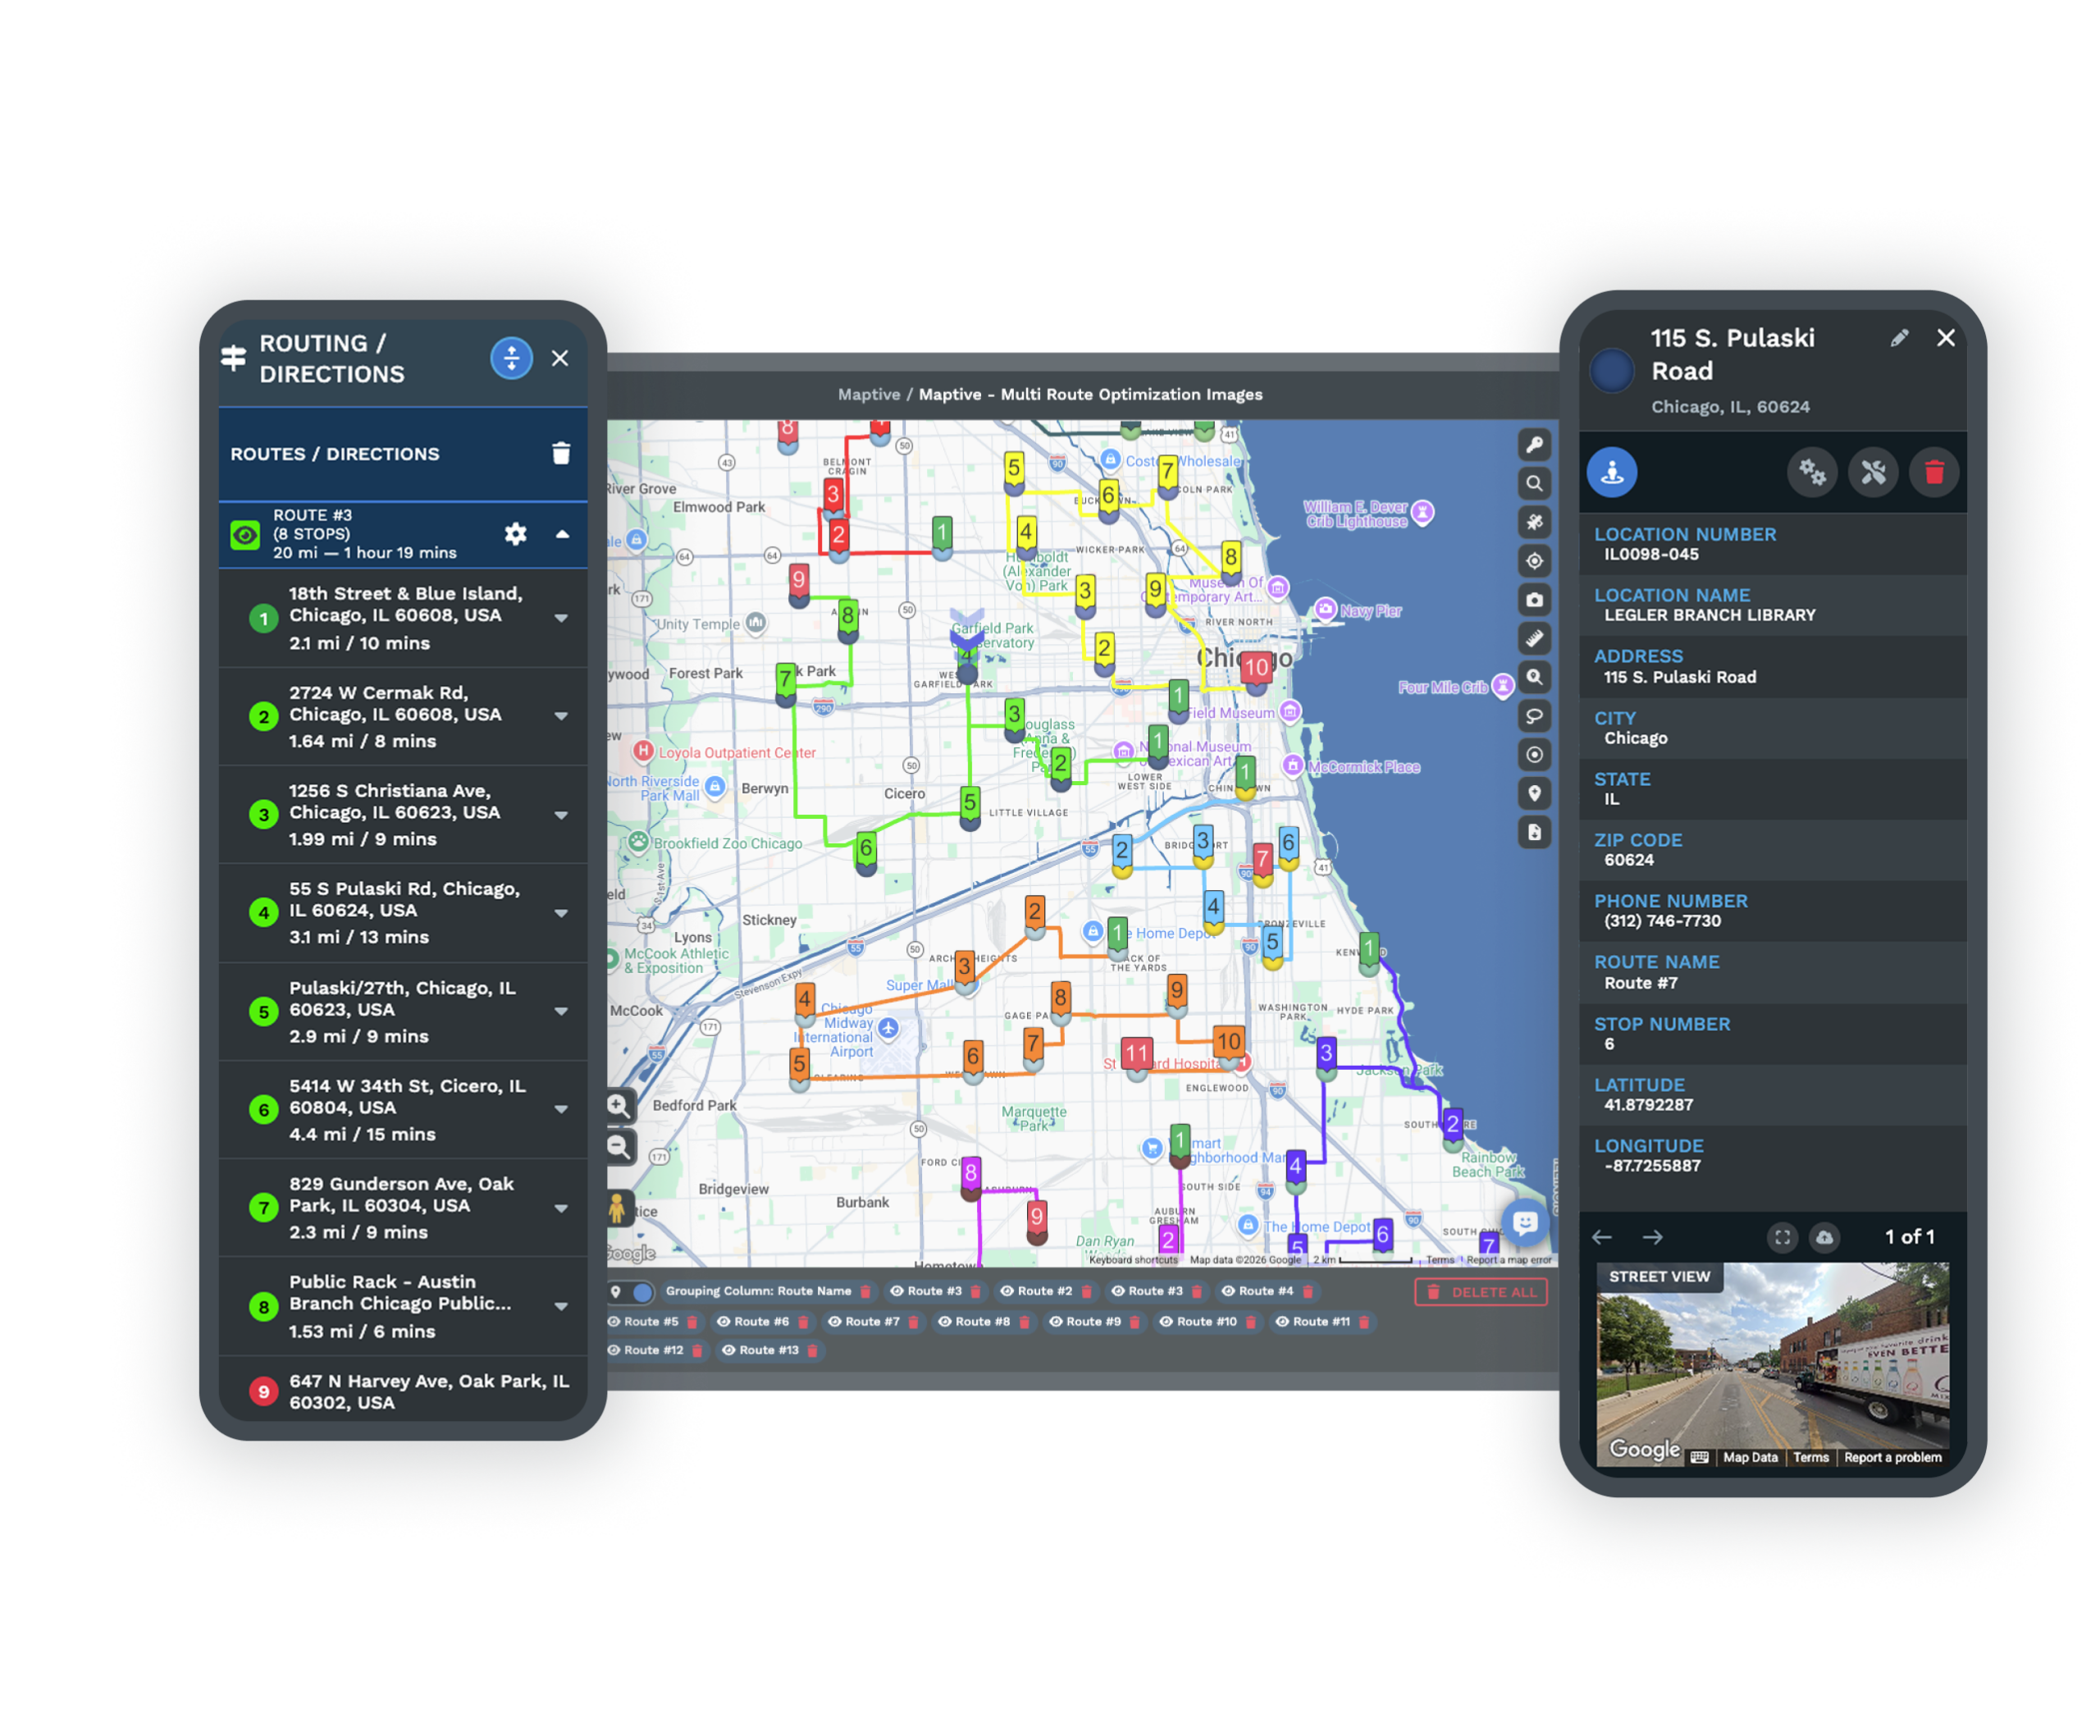
Trade Areas Around the Coverage GapsDraw a Distance Radius or a Drive Time Polygon around every unit and competitor, then look at the parts of the map no ring reaches. Those uncovered stretches are the white space, sized by drive time on real roads rather than a flat circle. Explore drive-time polygons → |
Density Per Capita Before You Trust an Empty Corner
The first read on any market is competitor density against the people who live there, since a metro with one rival per 4,000 residents behaves nothing like one with a single brand per 50,000. Service concepts commonly plan around 25,000 to 50,000 people per unit and food concepts around 15,000 to 25,000, so you compare the count inside each trade area to the population under it rather than to a national feel for the category.
The map turns that comparison into something you can point at, which is why a 30-minute manual count of every competitor in a proposed area still beats many longer studies. What it cannot do alone is separate an open corner that is real opportunity from one where a market never formed.
White Space as a Trap or a Real Opening
An empty stretch of map is the part buyers most want to believe, and the part that most often misleads them. Established competitors are proof that demand exists, so a corner with no presence can mean the market simply never supported the concept, not that you found untapped ground.
You read white space by looking for population and spending power under it first, then checking that no nearby unit, yours or a competitor's, already draws that catchment through its drive-time area. The same layer that flags a saturated pocket flags a false opening, which is why the competitor pins and the demographics belong on one canvas and get read together rather than in turn.
Confidence in the Competitor Layer You Built
Accurate Census Behind the Density
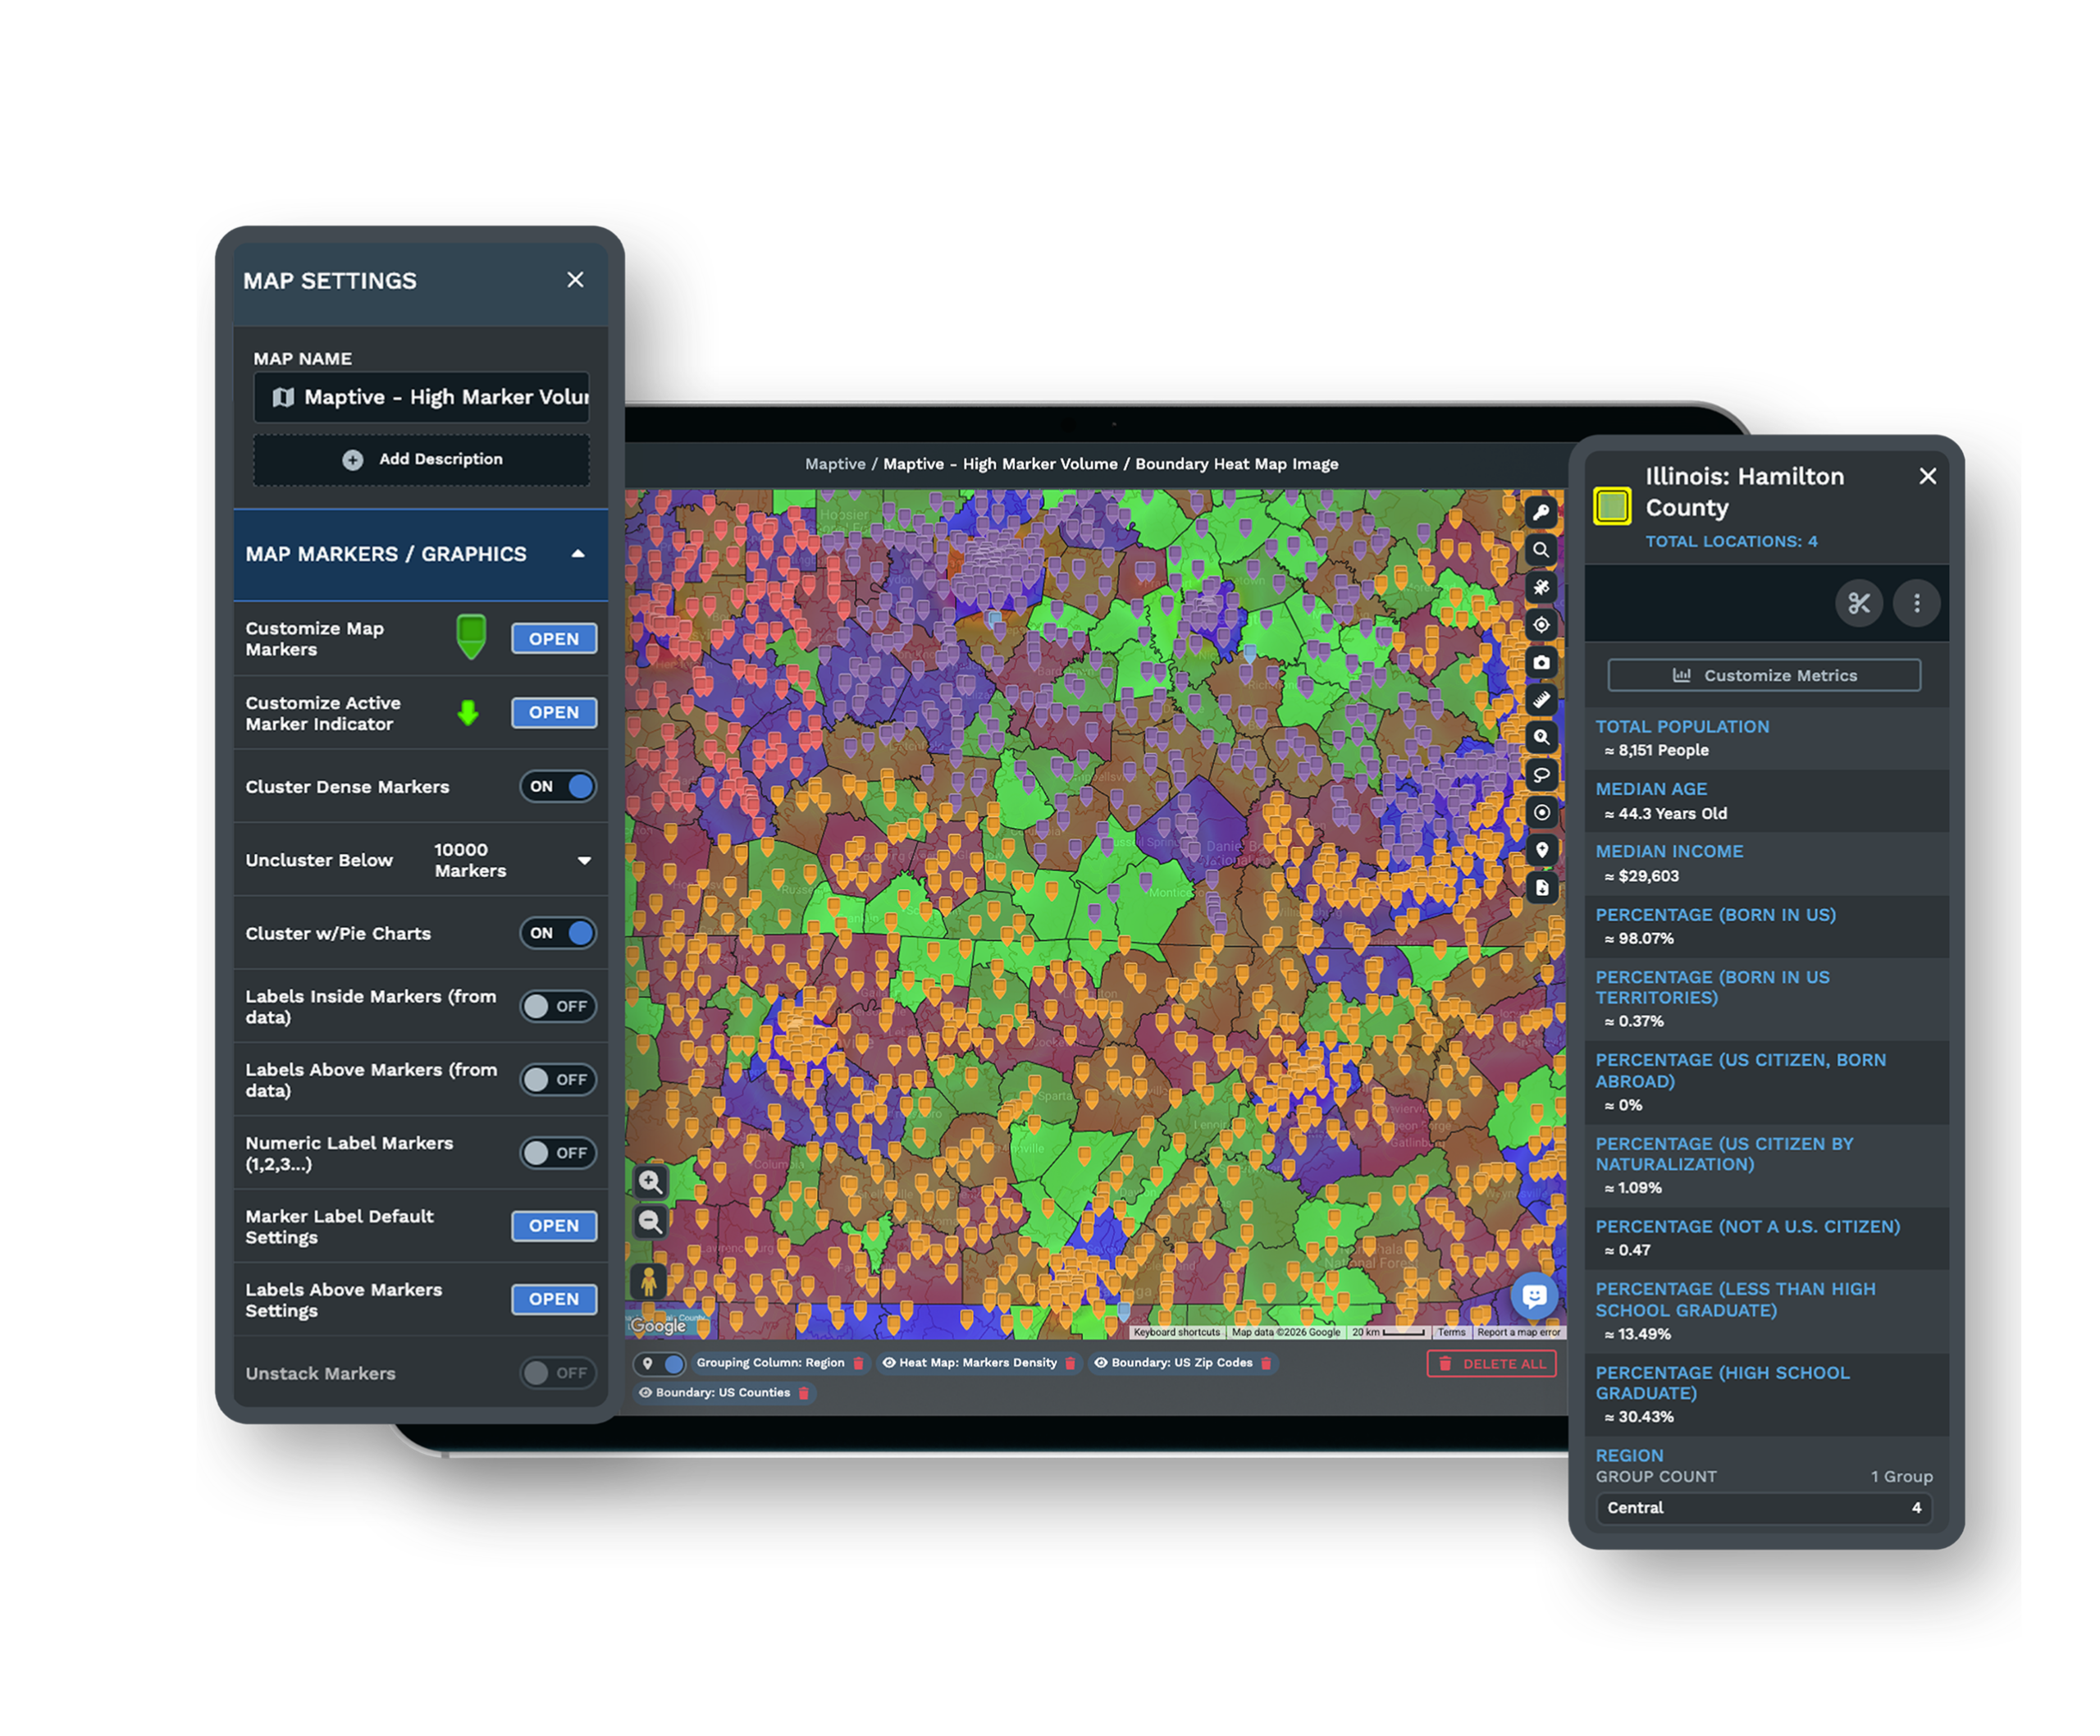
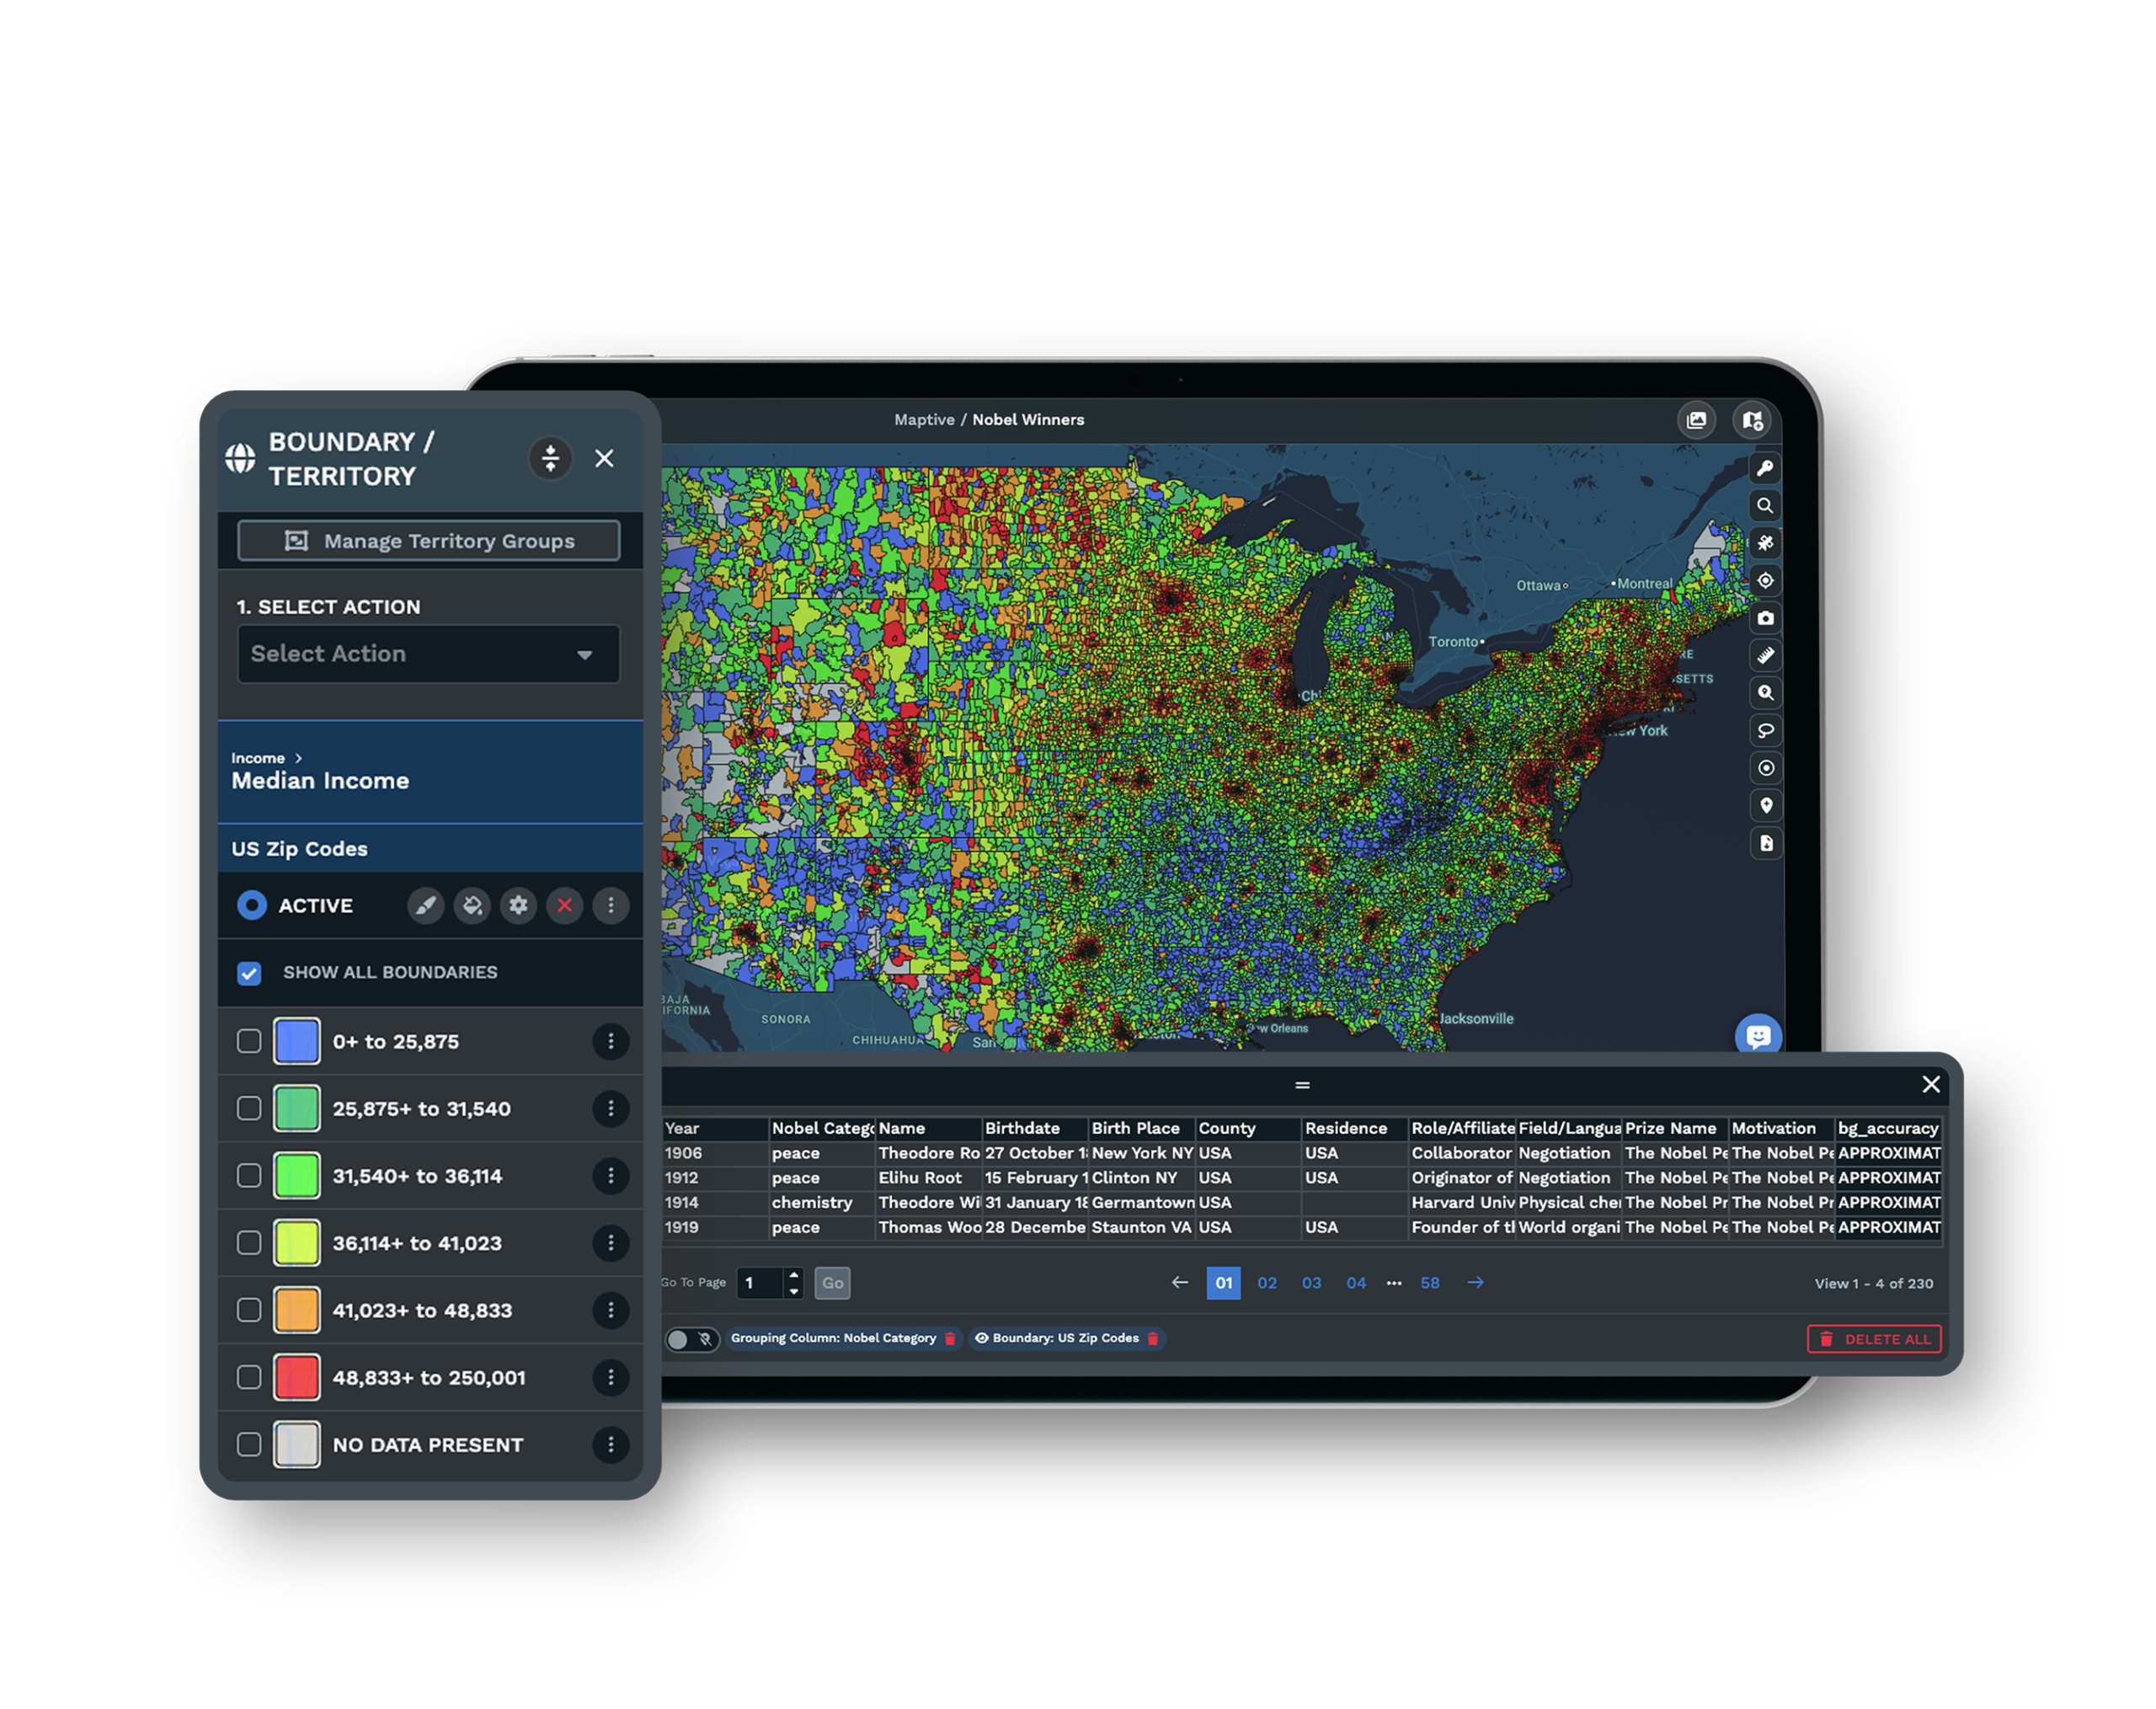
The demographic overlay draws on US Census Bureau data across the US and Canada, so the demand you weigh against competitor density comes from a documented source. You read saturation against real population and income rather than an estimate you cannot defend to a development committee.
A Map You Share Without Handing Over Access
Send the saturation map as a shared link, public or password-protected, and set each teammate to view-only or edit. The development team reads the same white space you do, and the underlying list of competitors and demographics stays under your control.
Security Around Your Market Data
The platform runs on 256-bit SSL encryption with two-factor authentication, single sign-on, role-based access, and audit logging, and it has passed the Salesforce AppExchange security review. Your competitor research and expansion map stay inside the account you control.
See enterprise security →Free trial with the full platform and no credit card
Map Your Saturation and White Space
Start a 10-day free trial with no credit card and all 60+ tools unlocked. Upload your competitor list, plot it against your own units, draw trade areas around each, and add a demographic overlay, so the crowded pockets and the open ground both show up on your real markets.
Review a Crowded Market With a Specialist
When an expansion call turns on how full a market already is, a Maptive specialist will build the competitor layer with you. Bring the metro you are weighing and the list you have, and the session plots the pins, draws the trade areas, and reads the density and the gaps in front of the people making the call.
Frequently Asked Questions
How do I map competitors against my franchise territories?
Import your own list of competitor locations, plot each as a tagged pin by brand, store type, or segment, then overlay your units and territories on the same map. Where the pins cluster you are looking at saturation, and where your trade areas reach ground no competitor covers you are looking at the gaps.
Where's the white space with no competition?
White space is an area with population and spending power but no nearby stores, yours or a competitor's. You find it by drawing trade areas, drive-time or radius, around every existing and competing location, then looking at the parts of the map no coverage reaches while real demand still sits underneath.
Can I upload my own list of competitor locations to a map?
Yes. Competitor locations come from your own spreadsheet in Excel, CSV, TSV, or Google Sheets, and each row plots as a distinct, taggable pin. You are mapping the actual competitors in your industry, so the layer reflects your market rather than a canned data set chosen for you.
How do I combine demographics and competitor locations on one map?
Plot competitor pins as one layer, then add a demographic overlay for population, income, and target profile as another, and read them together. The competitor layer shows supply and where it is dense, and the demographics show demand, so a crowded market with real spending power reads differently from a crowded one without it.
How do I know if a franchise market is saturated?
Compare the density of competing locations to the population they serve, a per-capita read, and watch the gap between unit growth and revenue growth. When a category adds units at 6 to 10 percent a year while industry revenue grows only 2 to 3 percent, each new location is pulling sales from the ones already there.
Does zero competition mean a good franchise opportunity?
Not necessarily. Established competitors are proof that demand exists, so an empty area can mean no viable market formed rather than untapped white space. Read a clean map skeptically, and check that population and spending power really sit under the open ground before you treat it as an opening.
How do I avoid opening a new franchise too close to an existing one?
Model the trade-area overlap between the proposed site and your existing units before you commit. When two drive-time areas share more than roughly 20 to 25 percent, revenue transfer between them is nearly certain, so you hold a buffer and pick a site where the new catchment reaches demand the others do not.
What data should a competitor density map include?
Effective analysis layers demand as population and spending, supply as your locations plus competitor locations with their trade-area overlaps, accessibility as drive time and road network, and competitive saturation as the density of competing brands. Read together, those four layers show open territory, overlap, and white space in one view.
How do franchisors gap-analyze a whole market at once?
Plot every existing unit, add the competitor layer, draw a trade area around each location, and add demographics underneath. Open territory, overlap, and white space then all appear in a single shareable view of the market, so a development team can weigh dozens of candidate areas against one another instead of one at a time.








