Your sales team works from three states. A field manager checks routes from a tablet between stops. Someone in operations needs to pull territory data during a client call. The mapping software you chose 5 years ago still works, but you find yourself building workarounds for tasks that should be simple.
Maptive was built for the way teams actually operate now. We run entirely in the cloud, integrate with Google Maps at the enterprise level, and connect to the tools your organization already uses.
This article walks through 9 reasons that make Maptive worth considering over Maptitude for businesses that want mapping software designed around flexibility, speed, power, and practical results.
Table of Contents
Maptive runs in your browser. There are no downloads, no installation files, and no waiting for IT to push updates to your machine. You open a tab, log in, and your maps are there. This works the same on a Windows laptop, a Mac, an iPad, or a phone.
Desktop software requires a specific operating system. Mac users often need virtualization software like VMWare Fusion or Parallels Desktop to run Windows-native applications. Some resort to Apple’s Boot Camp to boot their machines natively in Windows. That adds friction. It means more steps before you can actually do your work.
Cloud tools remove that friction. Your team uses whatever hardware they prefer, and the mapping software works the same across all of them. Updates happen on our end. When we add a feature or improve performance, you see it the next time you log in. There is no patch to install, no version conflict to troubleshoot.
For distributed teams, this matters. A regional manager in Denver and a route planner in Atlanta can look at the same map at the same time. Changes sync automatically. No one emails export files back and forth wondering which version is current.
Maptive is powered by Google’s enterprise-level mapping technology. That means you get global coverage, satellite imagery, street views, and real-time traffic data without paying extra for map updates or route calculations.
Google maintains some of the most current road data available. When a new highway opens or a street becomes one-way, that information appears in your maps. You do not wait for an annual data release. You do not pay for a supplemental update package.
Street View lets your team see actual locations before they arrive. A delivery driver can preview a loading dock entrance. A field sales rep can confirm which door leads to the main office. Real-time traffic helps route planners avoid congestion and give more accurate arrival estimates.
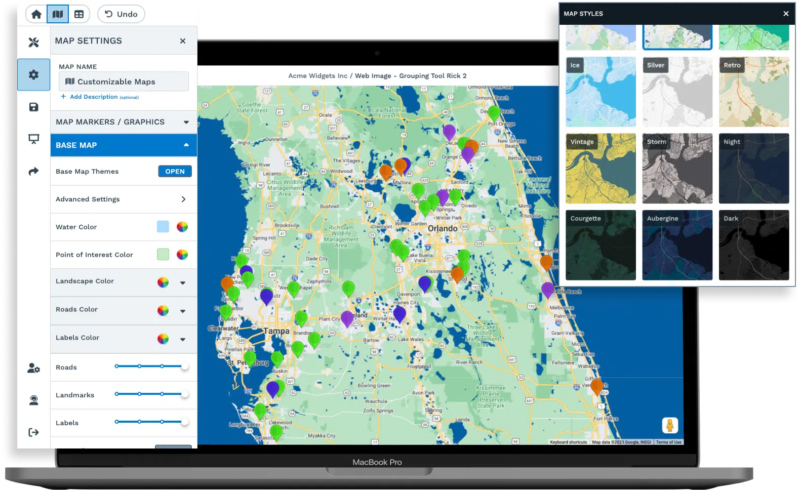
Multiple map styles come built in. You can switch between road views, satellite imagery, and terrain maps depending on what you need to show. For client presentations, satellite views often communicate more than abstract polygons. For internal planning, road maps keep things clean and readable.
Manual route planning wastes time and money. Someone looks at a list of addresses, guesses at the best order, and sends drivers out hoping for the best. Automated route optimization uses your destination list and live traffic data to calculate the fastest path through every stop.
Maptive’s route planner handles up to 73 locations per route. It exports turn-by-turn navigation for field sales representatives, delivery drivers, and service technicians. Tests show that switching from manual to automated planning results in routes that average 35% shorter. Many teams report 15% to 30% savings on total route distance.
Shorter routes mean less fuel, less wear on vehicles, and more stops completed per day. A field service company that adopted Maptive iQ, our latest platform update, saw an 18% drop in fuel costs and a 22% increase in completed service calls.
The Maptive iQ routing engine checks possible delivery routes and selects the fastest, least costly option. It accounts for traffic delays, standard closures, one-way streets, and time of day. Pilot studies showed routing errors decreased by roughly 22% while fuel costs fell as much as 15%.
A logistics firm used Maptive to process thousands of routes in seconds during peak season. That speed reduced their holiday shipping delays by over 40%.
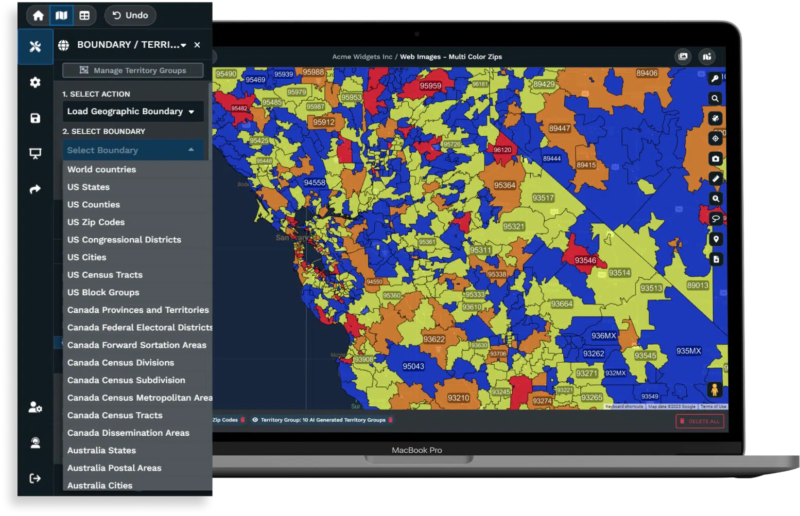
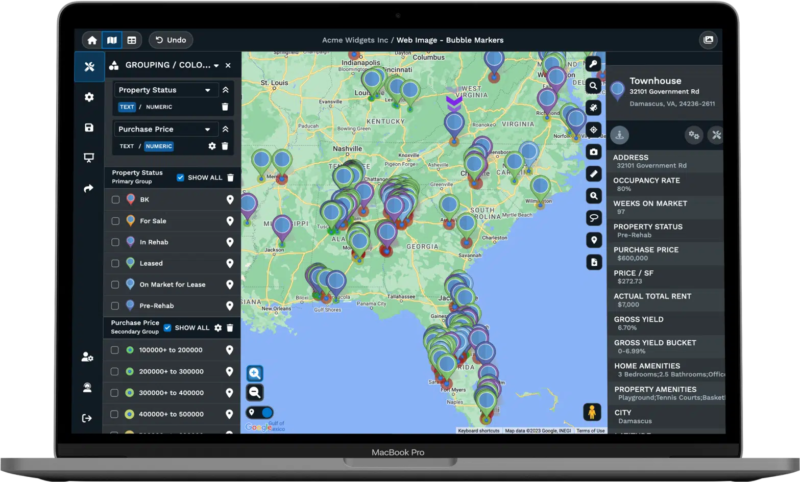
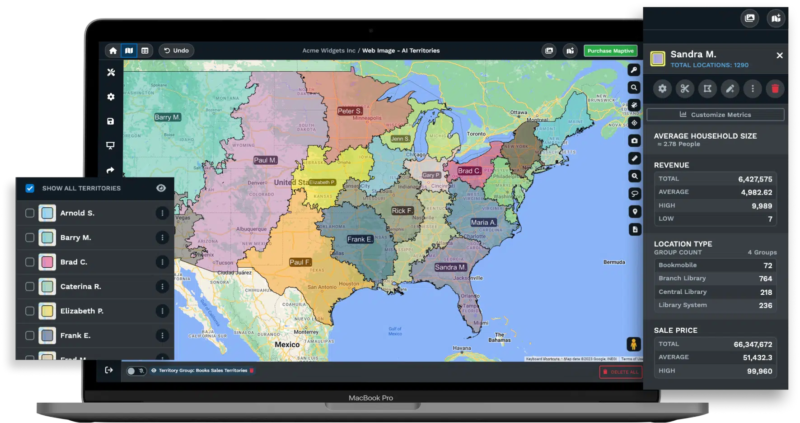
Sales teams spend too much time adjusting territories. Someone leaves, accounts shift, and suddenly half a day disappears into spreadsheets and manual boundary drawing.
Maptive’s territory tools let you build regions from preset boundaries like zip codes, cities, or states. You can also draw custom territories when the standard shapes do not fit your needs. Add secondary criteria such as population, income levels, or demographic data to balance workloads and spot opportunities.
Our automated territory creation feature generates balanced territories with minimal effort. The tool factors in salesperson locations, existing territories, and multiple data fields to create optimized regions. Territory realignments that once needed half a day now happen in under an hour.
We unified our boundary and territory tools so you can convert territories created from boundaries into editable polygons. If a region needs adjustment, you reshape it directly instead of starting over.
Later this year, we are releasing automated territory optimization powered by WeMapSales technology. Early results show a 75% reduction in territory planning time. Businesses using optimized territories report 20% increases in sales productivity and 15% cost reductions through better route and territory alignment.
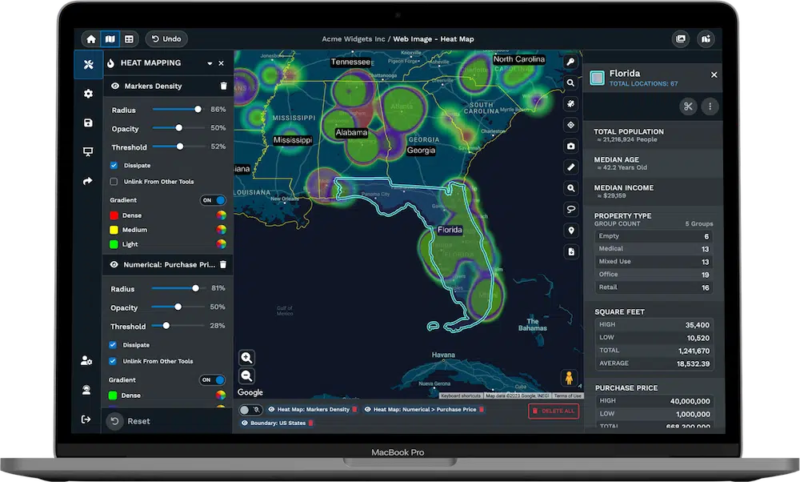
Understanding where your customers cluster, where they do not, and why helps you make better decisions about marketing, expansion, and resource allocation.
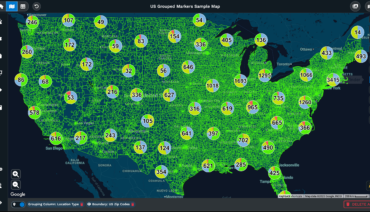
Heat mapping shows market density at a glance. You see concentrations of customer activity, sales volume, or service requests without counting individual pins. Our heat maps are fully customizable. Adjust opacity, radius, intensity threshold, and gradient colors to create the visualization that communicates best.
Census data overlays add another layer of analysis. See population density, income levels, age groups, and education statistics on your maps. Compare your business data against demographic trends. A retail chain can identify which stores serve higher-income areas. A nonprofit can find underserved communities.
Maptive supports demographic research with United States and Canadian census data. Create sales territories or boundaries based on zip code, state, or other regions, and we provide data on population density, median household income, age distribution, and more.
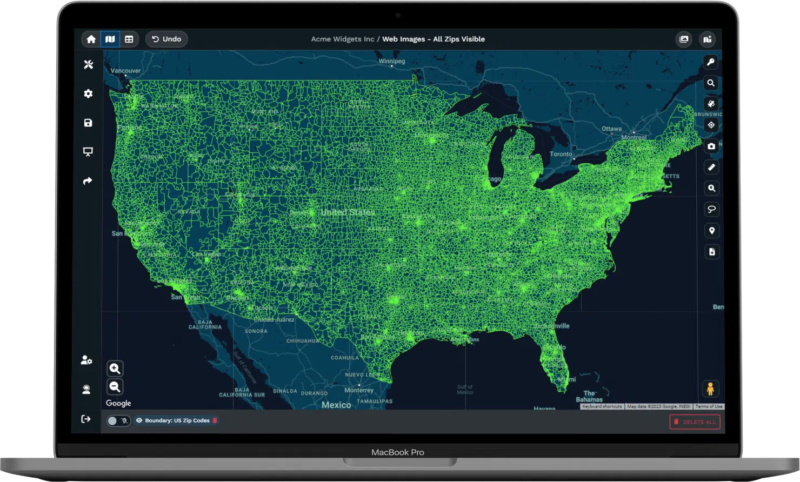
We also offer global coverage. Maptive includes postal code mapping for nearly 20 countries including Argentina, Australia, Belgium, Brazil, Canada, Chile, Costa Rica, Denmark, Finland, France, Germany, Mexico, the Netherlands, Spain, Sweden, Switzerland, and the United Kingdom. The core plan covers 112 countries total.
Mapping software slows down when you load large datasets. Browsers freeze. Markers overlap into unreadable blobs. You wait while the system catches up.
Maptive moved to WebGL map rendering, which means maps with high numbers of markers or boundaries display smoothly without browser lag. You can plot up to 100,000 markers per map.
Teams with no mapping background can upload full lists from Google Sheets or Excel without delay. Benchmarks show Maptive processes more than 50,000 rows in under 30 seconds without locking up browsers. As your map or data grows more complex, results remain quick and responsive.
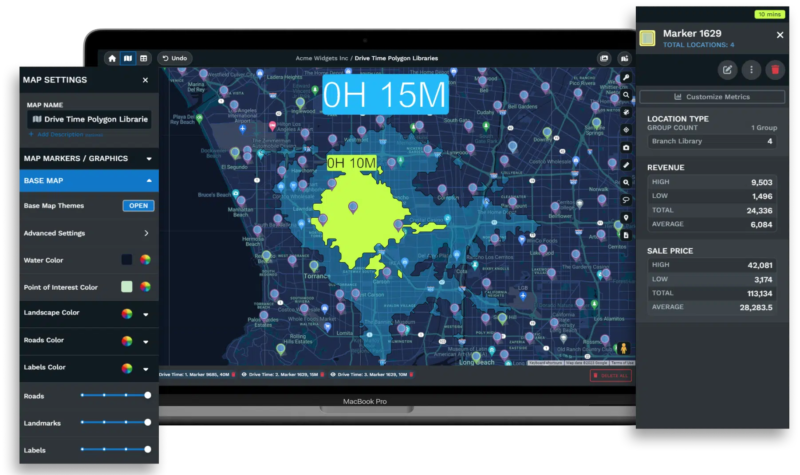
Drive time polygons in Maptive iQ use 300% more calculation points than earlier versions. This gives retailers accurate representations of their actual service areas rather than rough circles that ignore road networks. The polygon radius accounts for predicted travel times, one-way roads, and restricted turns. Current results remain accurate for drive times up to 4 hours, making the feature suitable for local delivery operations and regional planning alike.
Organizations handling customer addresses, sales data, or proprietary location information need confidence that their mapping platform protects that data.
Maptive offers 256-bit SSL encryption for all data geocoded through Google. We maintain fully redundant backups and disaster recovery systems. Live server intrusion monitoring runs 24/7. Our network security architecture was built from the ground up and undergoes regular penetration testing for vulnerabilities. Cloudflare provides endpoint protection.
Access control is customizable. You set levels of user privileges so team members see only what they need. Maps can be password-protected. Password standards validation and reset requirements keep credentials secure. Auto logout protects unattended sessions.
User roles let you determine who can view maps and who can edit them. Only trusted staff handle sensitive information. Everyone else sees what they need to do their jobs without exposure to data they should not access.
Mapping software that operates in isolation creates extra work. You export data, clean it up, import it elsewhere, and hope nothing breaks between systems.
Maptive integrates with major CRM platforms including Salesforce, HubSpot, and Zoho. Salesforce support is near completion, with early users syncing over 50,000 leads to Maptive each week for territory assignment. HubSpot and Zoho integrations are in testing and expected to roll out later this year.
You can also upload spreadsheets directly. CSV files, Excel documents, and Google Sheets all work. When you connect a live Google Sheets feed, changes made in your spreadsheet update on your map in real time. Your team always works from current information without manual re-uploads.
This connectivity matters for organizations where customer data lives in a CRM and needs visualization for territory planning, sales analysis, or service dispatch. The data flows where it needs to go without someone in between copying and pasting.
Understanding what you will pay helps you budget properly and avoid unexpected costs down the line.
Maptive’s pricing is published and predictable. Our Pro Plan costs $1,250 per year, or $110 per month, and includes one user license. It suits individuals and small businesses that need professional mapping capabilities. The Team Plan runs $2,500 per year, or $220 per month, and includes five user licenses for organizations needing multi-user access. Enterprise pricing is custom for teams of 10 or more users who need high-volume data capacity.
For those who want a shorter commitment, we offer a 45-day pass for $250. Our 10-day free trial includes all features and requires no credit card, so you can test the platform before purchasing.
There are no sudden price jumps for uploading data, no forced add-ons, and no surprise fees for features that should be standard. The subscription model includes ongoing updates, cloud hosting, and support. You know what you are paying and what you receive.
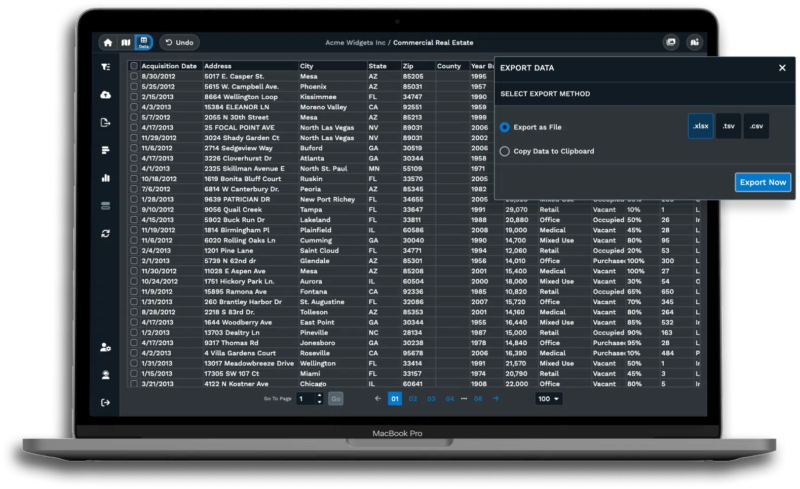
Switching from one mapping platform to another sounds disruptive, but it does not have to be. Maptive supports import of common file formats including CSV and Excel. If you have existing project files from other platforms, our team provides free support to help convert your data.
A dedicated specialist guides you through setup so you do not have to restart every project from scratch. Most users complete the transition in about two business days.
Support starts immediately once you are on the platform. Live chat connects you with real people who know Maptive. Video tutorials cover common tasks. The knowledge base answers specific questions.
Most support tickets close on the first try based on user feedback. No ticket systems that leave you waiting days for answers. Most questions get resolved in one conversation.
We continue adding capabilities based on what users need. One upcoming feature is scheduled offline mode for users who need to work on maps without an internet connection. This addresses field teams in areas with spotty coverage or anyone who needs to access data off-site.
We are also developing deeper options for research and data science teams, including support for point cloud files that create accurate three-dimensional mapping models. Construction firms and property managers will be able to map vertical and spatial data with precision as part of planning and site analysis. Later, automated territory management powered by our AI algorithm will help generate accurate territory maps based on your data. The feature removes guesswork from splitting territories and balances regions according to the criteria you set.
Maptive combines professional mapping power with a simple interface. We are entirely cloud-based, support real-time collaboration, and connect directly to your existing data sources.
Most users finish their first map in five minutes or less. You do not need GIS training or coding skills. Upload addresses from Excel, Google Sheets, or CSV files and see them mapped instantly. Our tools do the analysis so you can focus on the decisions.
The choice between mapping platforms comes down to workflow preferences, team structure, and how your organization wants to access and share location data. For teams that value browser-based access, Google Maps integration, real-time updates, and the ability to work from any device without installation, Maptive provides an approach to business mapping that scales as you grow.
Start with our 10-day free trial. Bring your data, test the features, and see how Maptive fits the way your team actually works.
Brad Crisp is the CEO at Maptive.com, based in Denver, CO and born in San Francisco, CA. He has extensive experience in Business Mapping, GIS, Data Visualization, Mapping Data Analytics and all forms of software development. His career includes Software Development and Venture Capital dating back to 1998 at businesses like Maptive, GlobalMojo (now Giving Assistant), KPG Ventures, Loopnet, NextCard, and Banking.