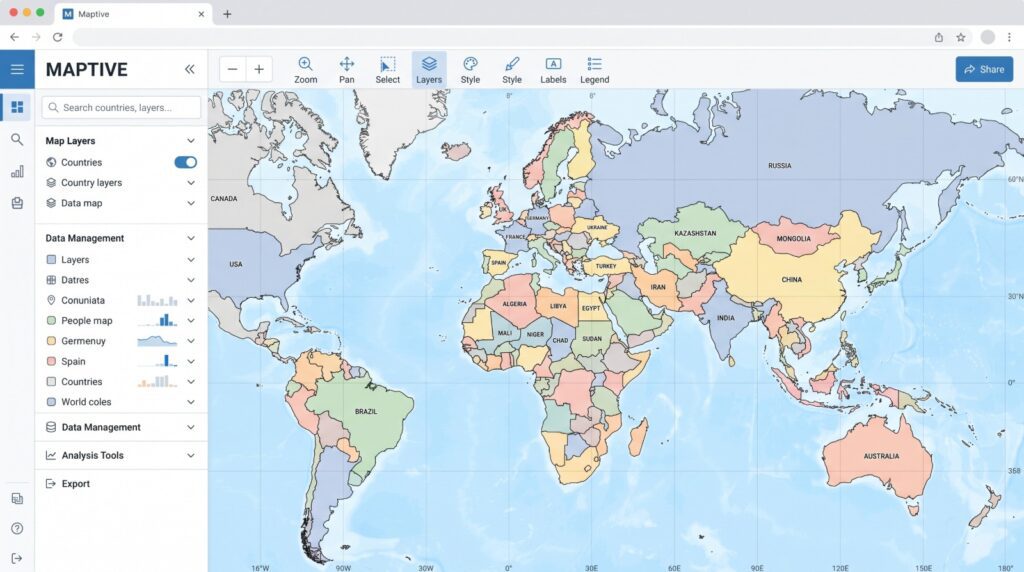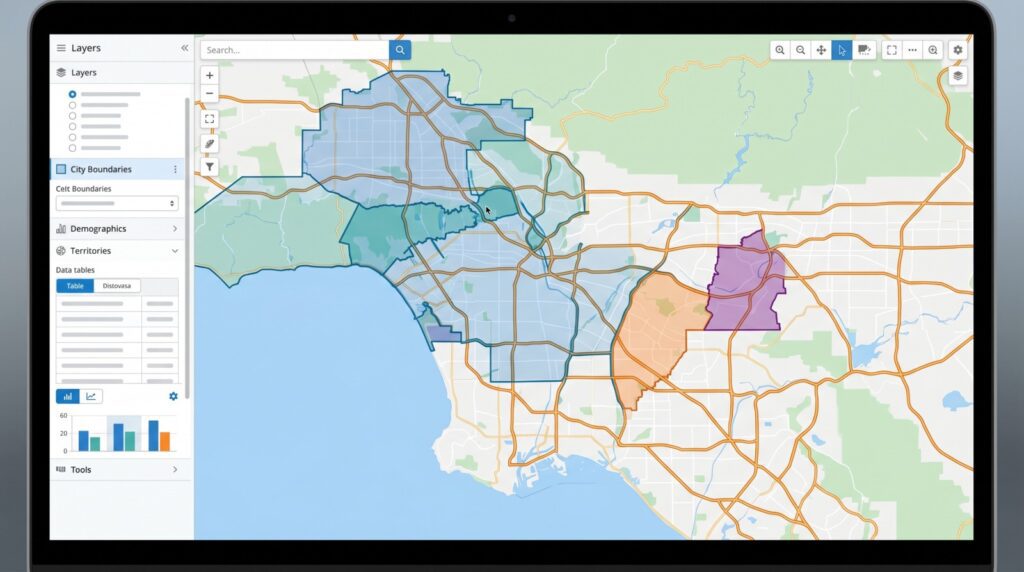
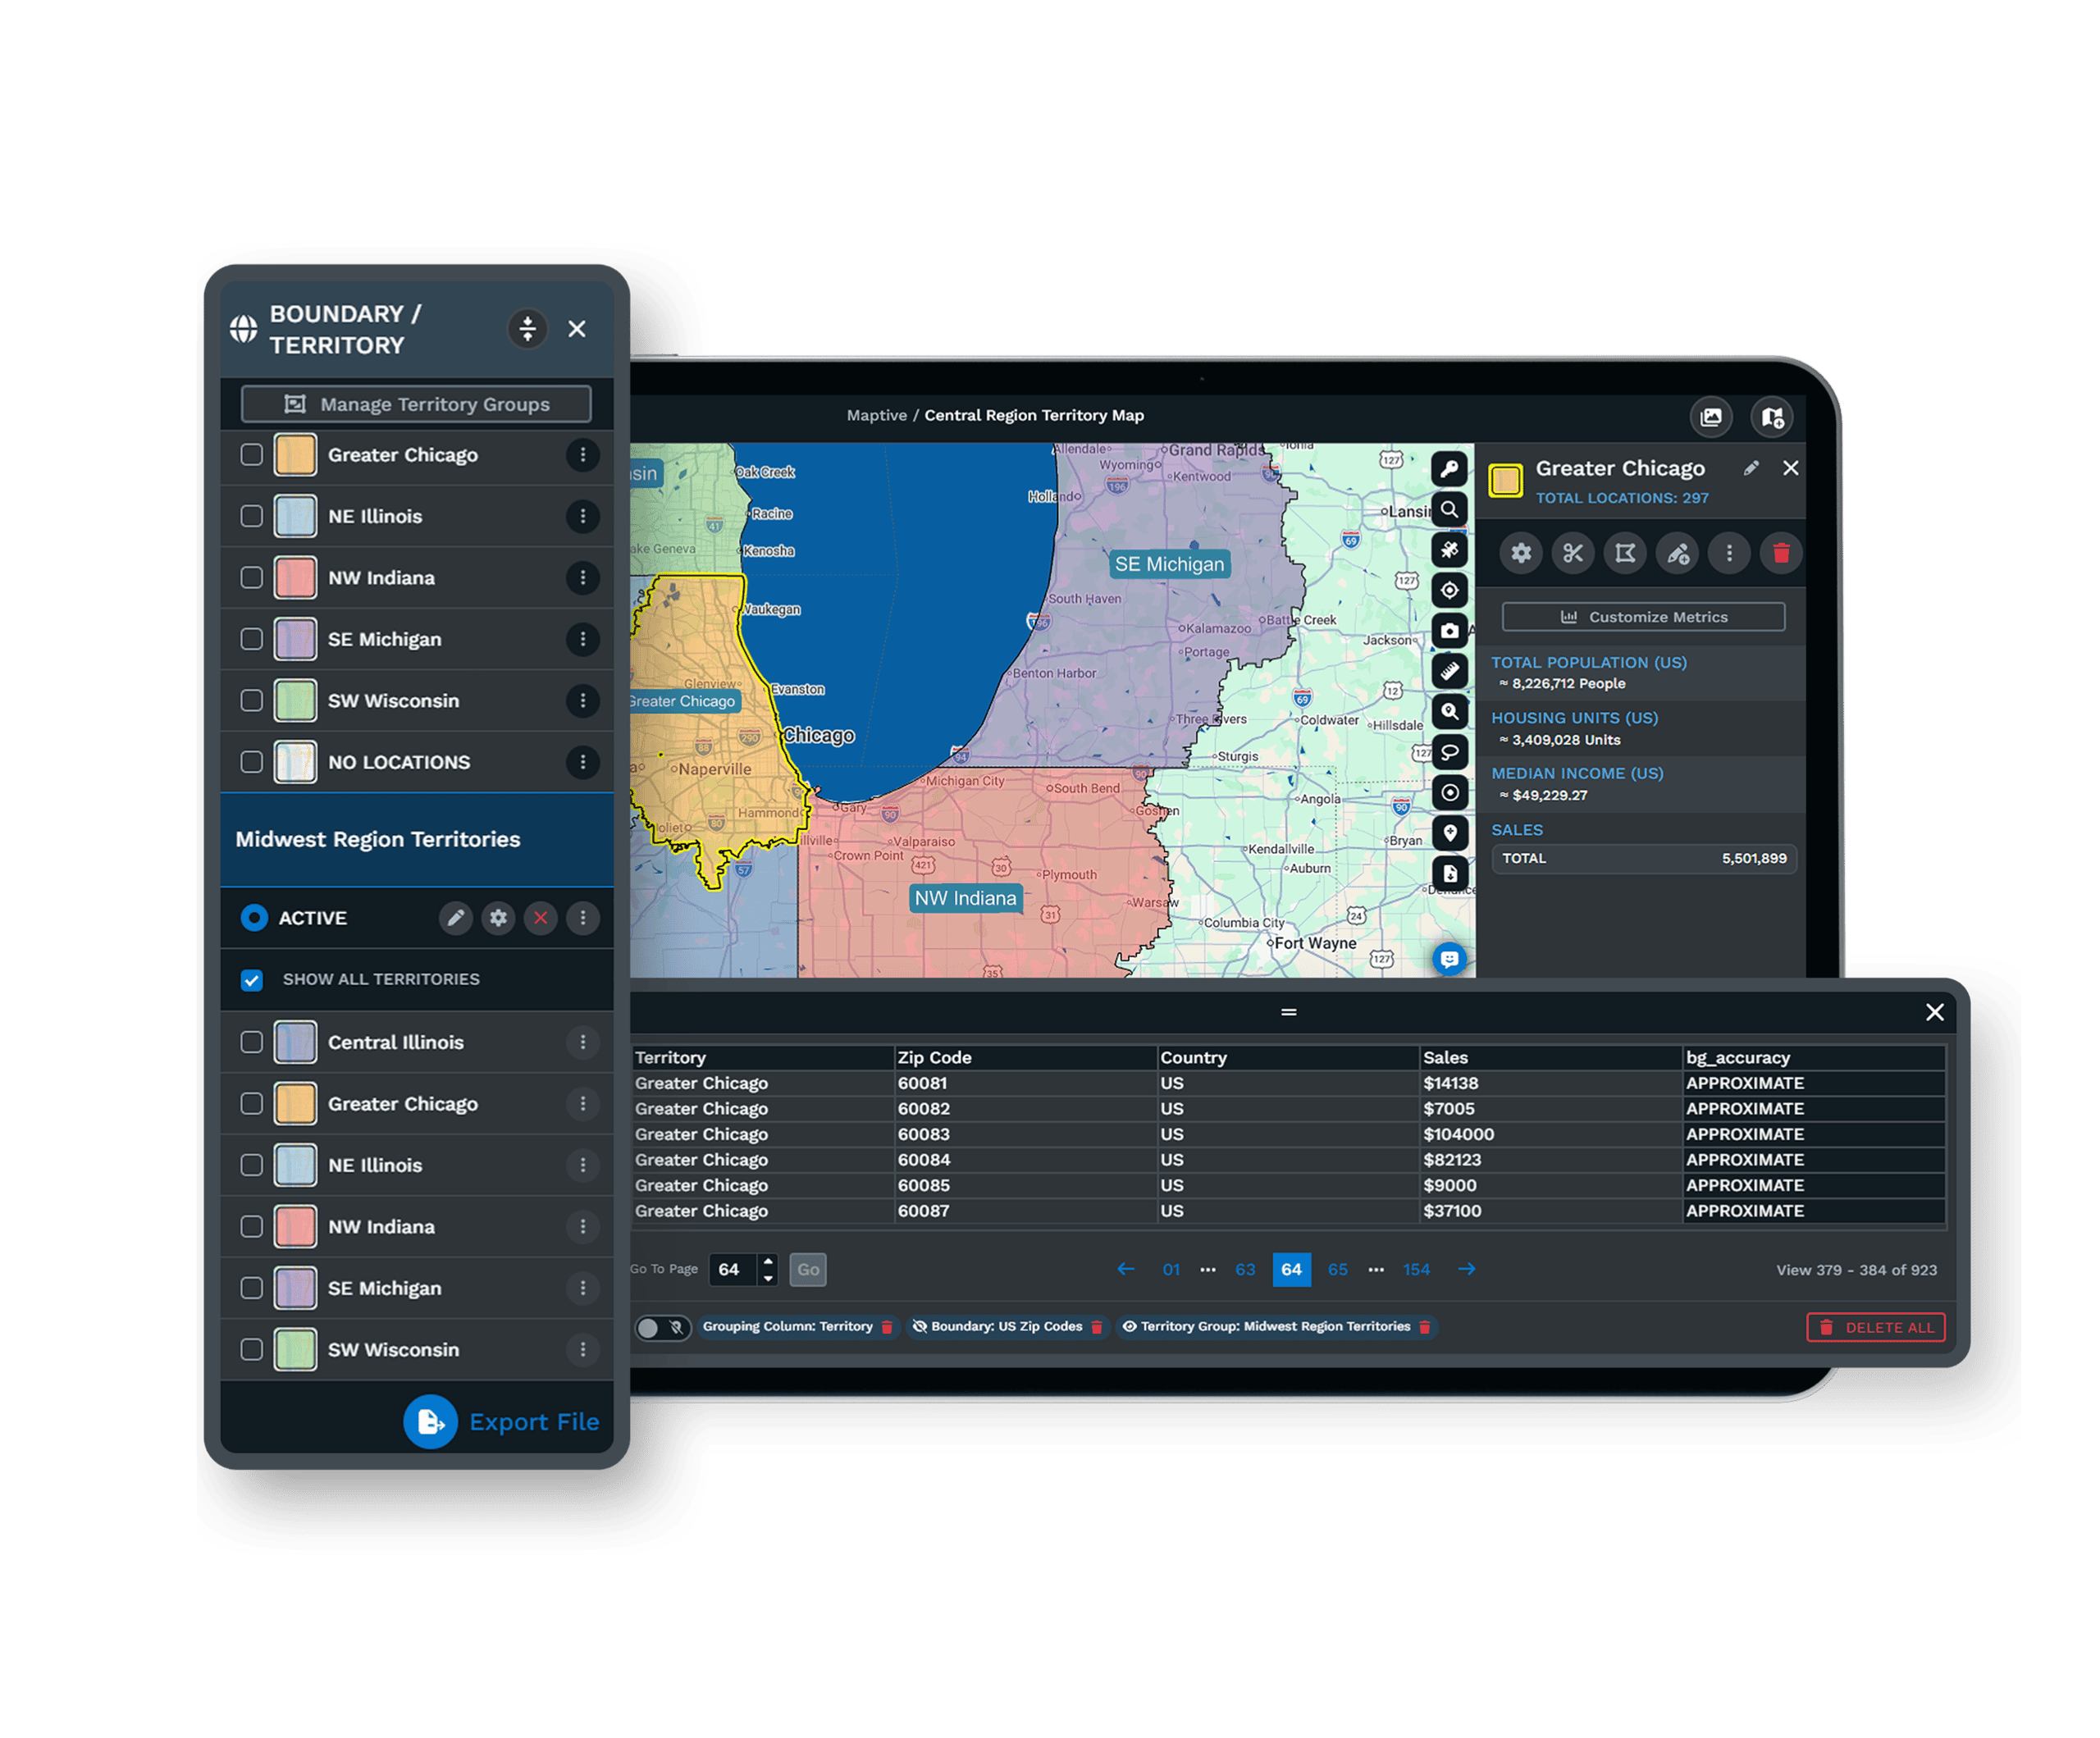
Maptive gives you four ways to create a territory, and the one you pick decides how hard that territory is to change later in the year, when a rep resigns and her patch has to be redrawn.
Territories built by selecting boundary sets have too many points to drag by hand. Fills painted onto boundaries move when the underlying data moves. What separates the methods is not how the lines look on screen but what you are allowed to do to them afterward, and that is the part nobody thinks about while picking colors.
Territory Objects and Proximity Tools
In Maptive, a territory is a saved object. It has a name, a color, a fill transparency, a set of metrics attached to its pop-out panel, and a place in a territory group you can add to another map. You can add area to it and remove area from it. You can reassign area between it and its neighbors, export the records inside it, then convert it into a shape that no longer depends on the data underneath.
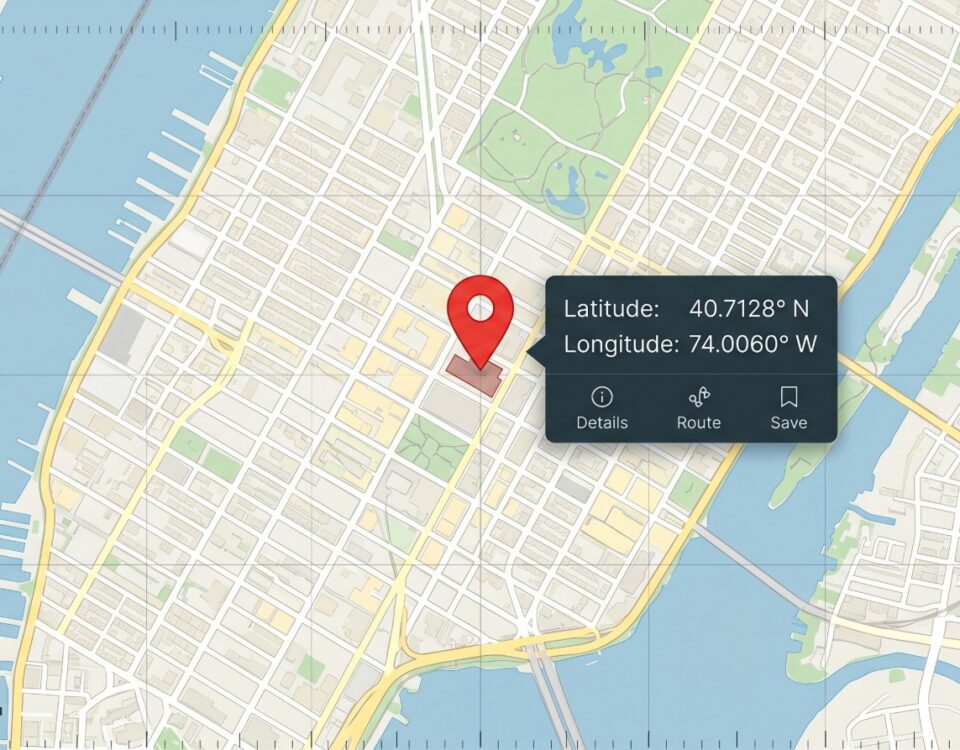
Three things on the same map look like territories and are not. A proximity radius circle is a distance band drawn around a point, useful for asking how many accounts are within 30 miles of a branch. A drive time polygon answers the same question in minutes of road travel instead of straight-line miles.
The third is color. The marker grouping tool shades your pins by a column in your spreadsheet, so every account owned by one rep turns the same color. All three are analysis and visualization objects. None of them is a territory you can hand to a person, and there is no button that turns a circle or a polygon into one.
The distinction matters on the day someone asks for a territory export. A radius will give you the records inside it, and it will not give you a named patch that survives next quarter’s data refresh. Teams that treat a coverage picture as a coverage plan discover the gap late, usually when someone asks for a rep-by-rep number.
Drive-time polygons are calculated on perfect driving conditions, with no historical or live traffic in the model. They are excellent for comparing coverage areas and poor for promising a rep that a customer is 40 minutes away at 8 a.m. on a Tuesday.
Data Preparation Before the First Boundary
Bad account records become territories built on the wrong rows, which is why a rep who inherits a patch spends the first week cleaning records instead of selling. Doing that work before the first boundary loads is far cheaper than doing it after 40 territories have been named.
Account List Upload
Sign in and click Create New Map, available from the Home, Map, or Data tab. Name the map, add a description if you want one, then click Continue. From there you have four routes in.
- Drag and drop a file, or click Add File. Maptive accepts Excel, CSV, and TSV.
- Copy your data, including the column headers, and paste it into the window.
- Build the map from a Google Sheet.
- Start blank and enter locations by hand.
Click Map Now. The file needs header columns and nothing else, because the headers tell the platform which column holds an address and which holds a phone number. A spreadsheet with 8,000 rows and no header row will not import cleanly, and adding the header row takes ten seconds in Excel against an hour of confusion in the map. If your account list is already in a workbook that finance maintains, turning that spreadsheet into a map is the whole of the import step.
How to Categorize Address Columns for Geocoding
Maptive tries to match your address columns on its own and opens the Categorize Data dialog when it needs help. The first section of that dialog accepts address information only, meaning the columns that place a record on the map. Location name and phone number do not belong there, and each address column maps to one option, once.
The second section takes the rest of the record. Location Name or Title controls what a user sees on hover and at the top of the marker pop-out. Website URL has to be a full web address. Image URL, Email Address and Phone Number each match to a single column. Anything you leave unmatched still appears inside the marker pop-out, so a column you are unsure about does not have to be forced into a slot.
Click Done, and geocoding begins. If you get the matching wrong, click any marker, open the gears icon, then choose Categorize Data, or go to the Data tab and do the same. Changing it on one marker updates every marker on the map.
Geometry Matching Versus Data Matching
Most people never open this setting, and it decides if your ZIP-level totals are right. Open Boundary Settings on the boundary set and switch to the Sync Data tab. Maptive defaults to Geometry, taking the geocoded coordinates of each record and checking which boundary the point falls inside. When your addresses are complete and geocode cleanly, that is the correct behavior.
The alternative is Data. Instead of using coordinates, you choose one or more columns and Maptive attaches each row to a boundary by matching text. A row with California in the state column belongs to California, no geocoding required. Use Data matching when the boundary will not geocode reliably, such as census tract numbers, or when your address data is incomplete.
When ZIP totals come back wrong, with accounts scattered into the wrong state or missing from the map entirely, the cause is usually a few hundred addresses that failed to geocode. Switching that tab to Data and matching on your ZIP column rescues those rows, because the ZIP in the spreadsheet places them even when the street address cannot.
Territory Creation Methods in Maptive
Each of the four methods suits a different starting condition. A fifth path takes the fill groups you paint in the Boundary Tool and converts them into territory polygons, a finishing step more than a creation method. Which method is right depends on what your data already carries and on what you expect to change.
| Where you are starting from | The method to use | What it costs you afterward | Section |
| Your accounts have ZIP codes, counties, or states, and your CRM reports on the same lines | Selection from a boundary set | Drag-editing usually will not work, since the shape has too many points | Territory Creation From ZIP Codes and Counties |
| No administrative boundary describes the coverage line you need | Freehand drawing | The shape means nothing to any system outside the map | Hand-Drawn Territories |
| Your spreadsheet already has a rep or territory column | My Group / Territory Data fill | A split boundary paints to whoever has the most markers in it | Territories Already in Your Data |
| You have a headcount number and a metric to balance on | Auto Territory Builder | The output is only as honest as the variable you balanced on | Automated Territory Builder Configuration |
| You want the lines to stop moving when the data moves | Convert boundary fills into territories | The territory no longer updates with your data, by design | Boundary Fills Converted Into Territories |
How to Choose a Creation Method
Start from what is already in the file.
- Accounts that already carry a boundary your business reports on will reconcile against a commission statement, so selection is the method.
- A coverage line that no ZIP code, county or state describes has to be drawn by hand.
- A rep column somebody filled in last year can do the work without a single line being drawn.
- If you are balancing to a headcount number, the automated builder is the only honest answer.
One case falls outside that list. Lines that have to follow roads instead of borders are a field-service question more than a sales one, and drive-time coverage does not produce a territory object no matter how much it belongs in your thinking. Draw the polygon, export the ZIP codes that fall inside it, then select those ZIP codes as a territory.
Territory Types Beyond Geography
Roughly 75% of sales organizations assign territories geographically, which says more about habit than about fit, since the accounts worth having are not spread evenly across the country. Reps assigned a large, thin patch feel this immediately.
The named approaches all enter Maptive as a column value, a boundary fill, or a balancing variable.
- Named-account and strategic-account models. Assign the big accounts first, then build around them. In Maptive that model exists as a column value instead of drawn geometry. Tag the accounts, then use that column as a grouping or as a territory fill.
- Vertical or industry models. These run on the same mechanism. Your industry column becomes the fill, and the coverage picture stops being about lines at all.
- Segment models. SMB, mid-market and enterprise, usually layered on top of geography, so you end up with two overlapping territory groups and rules of engagement written somewhere other than the map.
- Hybrid models. This is where most teams land in practice. Geography for the base layer, revenue band for the split, sized so each rep gets a comparable number of accounts worth having.
- Drive-time models. A geographic sub-type for field teams, where the constraint is windshield time instead of administrative tidiness.
None of these settles the argument that runs through every RevOps community, that opportunity moves faster than an annual planning cycle and geography has very little to do with where it moves. That argument has force, and it still has to hold up against a field team that pays for mileage and a comp plan that has to be defensible in January. The territory map maker will not resolve the debate, but it makes the redraw cheap enough that you can afford to be wrong twice a year instead of once, and that gets closer to the fix than any single model does.
If you are inheriting a structure instead of inventing one, map what you already have before changing anything. Most of the argument about sales territory management ends once someone counts the accounts in the patch everybody assumed was rich.
Territory Creation From ZIP Codes and Counties
Most sales organizations should start here, because your accounts already have ZIP codes and your commission statements already reconcile against them. Reps talk about the 606s and the 070s. Building the map on the lines the business already uses means nobody has to translate anything later.
Territory Group Setup From a Boundary Set
Open Map Tools and click Territories. Set Select Action to Create Territories, then open the Select Territories dropdown and choose Create Territories Manually. Set Manual Method to Selection.
Maptive then asks what you want to select from. Boundaries gives you the sets that ship with the platform, and the documentation works through US states, US ZIP codes, counties and cities. Territories lets you build a new territory out of territories you already made, the way a national account structure gets assembled from regional ones.
Name the territory group before you draw anything. A group holds many territories and the name is what you reuse on other maps, so Sales Territories 2026 will serve you better than Untitled Group 3. Click Create Territory Group, and Maptive adds the boundary set to the map and opens the Boundary Selection Tool with On Click preselected.
The same workflow applies to postal code mapping outside the United States. Only the boundary set changes.
On Click, On Hover, and Lasso Selection
The three selection modes differ more than they look.
- On Click. Click each boundary you want, one at a time. It is slow and precise, and it is the right mode for a territory built out of 15 named ZIP codes.
- On Hover. Click the first boundary, then move the cursor across the ones that follow, and click again to stop the hover. Repeating the click-hover-click cycle adds disconnected areas, which is how you pick up an exclave without starting over.
- Lasso. Draw a polygon around a region and take everything inside it.
The lasso has a setting you must choose before you click Start, and it is the one people miss. Full Boundaries Only selects a boundary when it is entirely inside the shape you drew. Full and Partial Boundaries selects a boundary when any part of it touches your shape. On a metro that straddles a state line, those two settings produce different territories, and the second one will hand your rep half of a county nobody meant to give her. Choose it deliberately. If the selection comes back wrong, reset and redraw before you save, because a bad selection is much easier to fix now than after the territory has a name.
Territory Naming, Color, and Transparency
Click Save. Maptive opens a popup where you name the individual territory and set its color and fill transparency. Transparency deserves a moment of thought, because a territory at full opacity hides the markers underneath it, and the markers are the reason you built the thing. Somewhere around 30% to 40% lets both read at once.
Click Save and Create Another to jump straight back into selection for the next patch, or Save to finish.
The Cost of a Boundary-Built Territory
The cost of this method shows up about six weeks after you finish. A territory made of 40 ZIP codes has every vertex of every ZIP code inside it, and drag-editing is usually unavailable once a territory has that many points. You cannot nudge the line. You can add area and take area away, a different kind of edit from moving a boundary 6 miles west because a customer asked you to.
ZIP codes are also about to define your commercial structure, so know what they are. Postal codes are mail-delivery routes, not geographic areas, which is why the Census Bureau builds separate tabulation areas out of census blocks, roughly 32,000 of them against about 42,000 ZIP codes. For territory work the mismatch is almost always fine, because you are assigning ownership and not measuring population, and a boundary that is approximately right and universally understood beats a boundary that is exactly right and legible to nobody. It stops being fine when you report market penetration by ZIP and the denominators do not match. The ZIP code map is a tool for coverage and a rough instrument for demographics.
Everything in this method runs on the geographic boundary tool, and the sections that follow return to it constantly.
Hand-Drawn Territories
Sometimes no administrative boundary describes the line you need. A branch covers the half of the city on its side of the river. Drawing the shape by hand takes a minute of clicking and produces something no boundary set can give you.
Freehand Territory Drawing
Open Map Tools, click Territories, set Select Action to Create Territories, choose Create Territories Manually, then set Manual Method to Drawing. Name the territory group and click Create Territory Group. Maptive opens the Edit Territory Group window with Draw already selected.
Click Start, then click the map once to place your first point and keep clicking to place the rest. Close the shape by clicking the first point again or by double-clicking. Click Save, name the territory, set the color and transparency, then either save or move on to the next one.
Vertex Editing After the Fact
A hand-drawn territory is the only kind you can comfortably reshape later.
Open the territory and choose Edit Territory. The bright white dots are the vertices that define the shape, and you can drag any of them. The paler dots are midpoints on each line, and they are not part of the shape until you drag one. The moment you do, it becomes a vertex and two new midpoints appear on the lines it created. Clicking a bright dot brings up an X next to it, which deletes that vertex.
The cost of freehand is that the shape means nothing to any system outside the map. Your CRM cannot filter on it. Your comp analyst cannot reconcile against it. Anything you draw by hand has to be exported as a list of records or of boundaries before it can be used anywhere else, a job the lasso does and the polygon does not.
Territories Already in Your Data
The territory structure sometimes exists already. Somebody typed a rep name into a column last year, or your CRM export carries an Operating Group field, and nobody has to draw anything. This is the fastest method in the platform and the one most teams overlook, because it does not feel like territory work.
How to Populate a Rep Column in Bulk
If the column does not exist yet, add one from the Data tab, then fill it from the map.
The lasso tool does the filling. Draw a lasso around the accounts in a patch, choose to edit the data as a group, then set a column value for every marker inside the shape at once. Every account in the Northeast becomes Salesperson J. Doe in a single action, and the change writes back to the Data tab.
One warning here is easy to miss and expensive. Checking the Batch Edit box next to a column that is empty will remove the data from that column. The action is fast and silent, and it applies to every marker you lassoed.
My Group and Territory Data Fills
Once the column exists, open the Boundary Tool, set the fill type to My Group / Territory Data, and choose that column. Maptive colors each boundary and adds a key showing every value assigned to at least one boundary.
Maptive paints each boundary with the category that has the most markers inside it, so a ZIP code holding six of Rep A’s accounts and five of Rep B’s paints as Rep A’s, in full, with no visual hint that half of it belongs to somebody else. Tell that to anyone who will look at the map. Ownership stays wherever the column says it is, no matter how the boundary is colored. The fill is a display of the majority, and treating it as an assignment is how two reps end up calling the same account.
Automated Territory Builder Configuration
Manual selection puts the lines where you want them without answering the question your VP of Sales asked, which is make these fair. Fairness across 8,000 accounts and 11 reps is arithmetic, and no one solves arithmetic by looking at a map.
Teams underinvest in the two design goals they are worst at. When sales organizations rank what they are designing for, covering existing customers and covering prospects come first, and balancing rep workload and designing travel-efficient territories come last. The gap is measurable, since organizations effective at territory design are close to 30 points ahead on sales objective attainment.
Auto Territory Builder Launch
Click the Map Tools icon, click Territories, select Create Territories, then select Auto Territory Builder and click Continue.
Choose the boundary set the territories will be built from. US Zip Codes is the common answer, and you can restrict the build to an area instead of running it across a whole country, which matters when you are rebuilding one region and leaving the others alone.
Balancing Variables and Weights
Next you choose what the builder is balancing on. Data Metrics uses the columns in your spreadsheet. Demographic Census Data uses census figures, and it is offered only where Maptive holds that data, which in the boundary and metric tools means the United States and Canada.
Tick at least one variable. A checkbox appears next to every column eligible for balancing, so if your file has total sales, open pipeline, account count and service hours, all four are available. Pick more than one and Maptive asks you to set the relative importance of each. Weight total sales heavily and population lightly, and the builder treats sales as the primary constraint. Leave the weights equal and it treats them equally.
This is the step where most territory work goes wrong, and it goes wrong by being easy. Account count is the simplest variable to balance on and the one that produces the falsest fairness, because one rep’s 50 accounts can contain 15 enterprise names with live buying signals while another rep’s 50 are dormant. A map balanced on count looks defensible in a planning meeting and pays out unfairly for four quarters. Balance on the number the quota is set against, then add a second variable that describes the work, such as service hours or required visit frequency.
If you are balancing on demographics and not on your own numbers, census demographic overlays give you income and age at the boundary level, the right input for a territory sized on market instead of on installed base.
Rep Locations and Territory Constraints
Three advanced settings are on the same screen, and each one solves a problem you will otherwise hit.
Respect Sales Rep Locations. Build a separate map that contains nothing but your reps’ locations. Come back to your data map, run the builder to the territory-creation-method screen, and point it at the rep map. Choose the column on that map to use as the territory name, usually the rep’s name. The number of territories immediately changes to match the number of reps, and Maptive then tries to place each rep as close to the center of their own territory as it can while still balancing the metrics you chose. It will not always satisfy both, and the distribution graph will show you where it gave way.
Respect Previous Territories. Feed the existing territories in as a starting point and the builder rebalances them instead of rebuilding from nothing. This is the setting for a mid-year headcount change, and it is the difference between adjusting three patches and re-carving 11. Reps notice a full re-carve in a way they never notice three adjusted patches.
Optimize with Constraints. Set a floor, a ceiling, or a range that every territory has to hit. Tick the column you want to constrain, then type values or drag the slider. Constrain US total sales to between $30 million and $40 million and the builder returns 38 territories averaging about $35 million each. The number of territories came out of the constraint and not out of a planning meeting, which is the right way around for anyone whose question is how many reps this market can support.
You can only constrain a column you already selected as a creation variable. If the column is missing from the constraint list, go back to the variable-selection screen and add it.
How to Read the Distribution Graph
Set the number of territories, name the group, then click Generate Territory. A status bar appears at the top of the screen. Depending on how much data you have and how large an area you are covering, the build takes between 1 and 15 minutes.
The territory boundaries are added to the map, and a distribution graph appears below it showing how the balanced metrics are spread across the territories. In the builder’s worked example, sales was weighted heavily over population, and the sales figures across the resulting territories came back within about 10% of each other.
The graph is the first moment the map tells you something you did not already believe. Read it before you name anything after a person. One territory far off the pack means the constraint and the balancing metric cannot both be satisfied, and it is much cheaper to rerun the build than to explain the outcome to the rep who drew the short patch. If a full rebuild is out of the question mid-year, the territory management workflow can start from what you have and rebalance.
Territory Metrics and Balance Checks
A territory should answer, on click, how many accounts are inside it and what they are worth.
Metrics in the Territory Pop-Out
Put a territory on the map and click it to open the right-side pop-out, then click Customize Metrics.
The metrics come from two sources. From your spreadsheet, pick any column header and then pick how it aggregates, which for numeric columns means Sum, Average, High Value, or Low Value. Group Count gives you a list of the values in a column instead of a total, so a Status column comes back as a breakdown of active and lapsed instead of a meaningless average. That breakdown is the one a rep reads first when they open their own patch, because it tells them how much of what they were handed is already alive.
From demographics, pick a region, then a demographic group drawn from the US or Canadian census, then the specific measure. Click Add to Proximity Details for each one, and add as many as you want.
Customizing the metrics on one territory updates the metrics on every territory, because the setting belongs to the tool and not to the object. Each tool keeps its own set, so your territories can report one thing and your radius circles another, and you set each up once.
Combine Groups and Territory-Level Totals
If you built your territories as boundary fills instead of territory polygons, the totals need one more setting. Open Boundary Settings on the boundary set and turn on Combine Groups. Boundaries that share a group then behave as one unit. They highlight together on hover, and the side panel reports data from all of them at once, so a 15-ZIP patch reports a single sales number instead of 15.
While you are in that panel, turn on Ignore Filters if your territory colors keep changing as people filter the map. Boundary colors normally respond to filters, useful during analysis and alarming when a rep opens a shared map, filters to their own accounts, then watches the territory shading rearrange itself.
Density is a separate question from ownership. A heat map of your accounts shows where the business clusters, telling you if a balanced territory has opportunity in it or a lot of empty land.
Territory Edits, Overlaps, and Reassignment
Territories change more often than they are created, and the editing model is narrower than most people assume. It gives you three operations, and there is no Split command and no Merge command anywhere in the tool.
Territory Edits by Draw or Selection
Click the territory on the map, or click the three-dot menu next to it in the tool list. For a hand-drawn shape, choose Edit Territory. For a boundary-built one, choose Advanced Edit.
Set the method to Draw and you can sketch an area freehand. Set it to Selection and you can pick boundaries the same way you did when you built the territory, using On Click, On Hover, or the lasso. Either way, click Start, define the area, then click Save. A popup then offers three choices, and this popup is the entire editing model.
- Add. The area you defined is added to the territory. Overlap with other territories is permitted, and any overlapping area stays in both.
- Remove. The area is taken out of the territory. Anything the drawn or selected area overlaps is stripped from the existing shape.
- Reassign. The area is added to one territory and removed from every other territory it touched.
Click Done.
How to Resolve Overlapping Territories
Two reps who both think they own one ZIP code is the most common version of this problem, and Reassign is the only operation that fixes it. Add will happily leave the ZIP in both territories, because overlap is a legitimate design choice for overlay teams. Nothing in the platform stops you from building a map where three territories claim the same county, because the tool assumes you meant it.
Splitting a territory is Remove plus a new territory. Define the carve-out, remove it from the parent, then create a territory from the same area. Merging is Add, or, in boundary fills, it is Combine Groups. Both operations exist, though neither has a button with its name on it.
Boundary Fills Converted Into Territories
A territory you built by coloring in boundaries stays attached to the boundary set and to your data. Refresh the account list, and the fill can be redrawn underneath you. A map that redraws itself as the data changes is the point of a live map, right up until the second week of January, when the lines have been agreed and the quotas set against them and someone in RevOps uploads a cleaned account file.
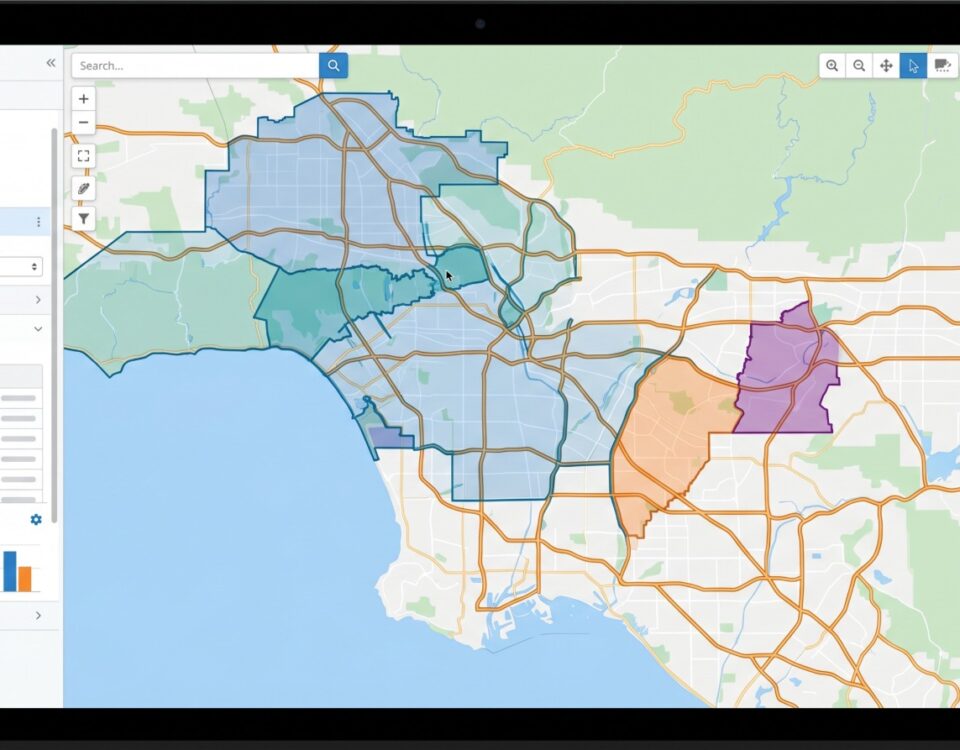
Converting locks them. Open Map Tools, click Geographic Boundary, find the boundary set that has at least one fill group, and click its three-dot menu. Click Convert Groups to Territories. Name the territory group, click Convert. Maptive removes the boundary fill and replaces it with territory polygons, so a rep’s patch of three colored-in states becomes one shape with one outline.
Four things change the moment you convert. The internal boundary lines disappear, so the map shows the outside border of the patch and not every county seam inside it. The territories can be added to other maps in a couple of clicks, and the new map’s data cannot alter them. You are no longer restricted to the boundary set you happened to be using, which means a territory can be assembled from one kind of boundary and then used on a map built on another. And your data can no longer move your lines. That last one is the reason to convert, and everything else is convenience.
Territory Export, Sharing, and Rep Handoff
A handoff is done when the rep can open their patch and the outgoing rep’s open deals have an owner.
How to Export Territory Assignments
The route out depends on who is receiving the file.
The lasso exports the records inside a shape, and it also exports the boundaries inside an area, including ZIP codes and cities you never imported into your map. It works against territories you created as well as against Maptive’s own boundary sets, which makes it the cleanest way to produce a ZIP-to-territory list for whoever maintains the CRM, and it is the file a comp analyst wants.
The whole-map export runs from the Export Data icon on the right of the map, or from the Data tab, with three scopes. Export the entire dataset, export the filtered data, meaning everything that would show under the filters and searches currently applied, or export only what is visible on the map. Files come out as .xlsx, .tsv or .csv, or you can copy straight to the clipboard.
Team Map Share for Licensed Users
Team Map Share and external sharing solve different problems and are not interchangeable.
Team Map Share is for licensed users on your account. From the home screen, click the three dots to the right of a map and choose Team Map Share, pick the team member, then decide if they get editing rights or view-only access. Two constraints matter. Team Share requires multiple licenses purchased together, and only one user can edit a map at a time, which prevents two people from making contradictory changes to the same territory group. For a planning session with 11 managers in a room, that means collecting their input and making the edits yourself.
External Links and Viewer Controls
External sharing is for everyone else. Open the map, click Share on the left, then choose Share Externally. Viewers need no login and cannot make permanent edits. Set the map to Password Protected or Public, and understand what Public means here. Anyone with the link can open the map, and nobody is going to find it through a search engine. There is a single password per shared map, so everyone gets the same one. Changing it locks everyone out at once.
Before you send the link, decide what a rep should be able to touch. The share and embed settings give you per-tool switches for the shared version of the map, covering the boundary tool, the filter tool, routing, radius and drive time, the lasso, the search bar and the rest. Fewer tools is the better default, and the filter tool beats the grouping tool because more people already know how to filter. A rep opening their patch for the first time needs their accounts, a boundary they recognize and a filter, and every other tool you leave switched on is one more thing for them to click by accident. Save a map view zoomed to their territory and share that view, so the map opens on their patch and not on Kansas.
If the whole team is going to work from one map instead of 11 exports, shared mapping for teams is the setup to build toward, and it removes the version-control problem that spreadsheets create by design.
Territory Handoff and Notice
Then there is the part the software cannot do for you. Reps complain far less about the fairness of the lines than about hearing nothing at all until they open an account record and find somebody else’s name in the owner field. A map redrawn perfectly and delivered with two days’ notice will still cost you a quarter, and possibly a rep.
Give notice longer than your sales cycle. Hand over the open deals in a documented meeting between the outgoing and incoming rep, and protect the commission on anything that closes in the first quarter under new ownership. Maptive can hand you a rebalanced territory map in an hour instead of days, and the hours you get back are the ones that buy you the notice period. A new map holds because the team was brought through the change, and no method in the tool will do that part for you.