A customer profile built on age, income, and purchase history offers details about what was purchased, when it occurred, and customer characteristics. However, it often misses an important aspect: location.
The places where customers live, work, and travel impact purchasing decisions in ways traditional data cannot capture. For instance, a 35-year-old professional with an $80,000 salary may exhibit different purchasing behaviors in downtown Chicago than in suburban Phoenix, even if their demographic profiles are nearly identical.
Geographic data fills this gap by providing context to customer profiles. The global geospatial analytics market reached an estimated $114.32 billion in 2024, driven by retailers, logistics companies, and service providers who benefit from location-specific information.
Table of Contents
Even with identical demographics, two customers can make completely different purchasing decisions. Location-based segmentation lets marketers account for real-world context that pure demographics miss, such as proximity to stores, regional preferences, local competition, and commuting patterns.
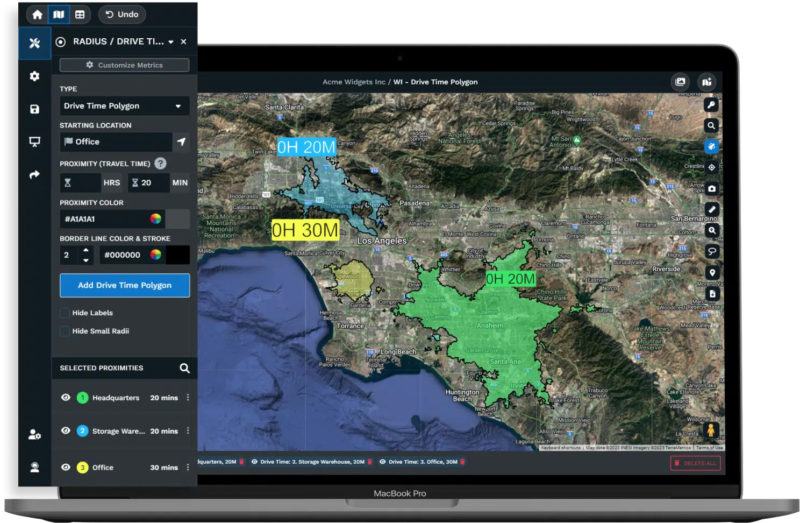
This is because geography shapes daily life. A customer living within walking distance of your store interacts with your brand differently from someone driving 20 minutes. Urban and rural shoppers have distinct patterns that influence pricing, marketing, inventory, and service delivery.
According to a Precisely report, 77% of businesses rely on location data for decisions related to marketing, facilities, risk assessment, and logistics. Companies increasingly view customer addresses as strategic assets.
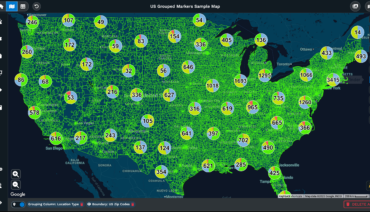
Geographic data changes the way businesses analyze their markets. Mapping customer locations helps identify concentrations, gaps, and opportunities that may be missed using spreadsheets alone.
A retail chain might find 40% of its customers in three zip codes, with minimal traffic elsewhere. This guides marketing, staffing, and expansion. Patterns like these may go unnoticed without geographic analysis.
The location intelligence market was valued at $21.5 billion in 2024. IMARC Group projects it will reach $68.8 billion by 2033, with a 13.13% growth rate from 2025 to 2033. Companies using location data to understand customer distribution make more informed decisions.
Brick-and-mortar retail remains significant. According to Forrester research, physical stores accounted for approximately 72% of all U.S. retail transactions in 2024.
Research from ICSC found that closing a physical store reduces online sales in the nearby trade area by an average of 11.5%. Home stores saw a 32.2% decline, and department stores fell 26.1%. Physical and online presence are interconnected.
Site selection is key for retailers. A well-chosen location often delivers sales 15% to 30% higher than those at an average site. Location quality can influence store performance.
Starbucks leverages a mapping and business intelligence tool to determine optimal store locations. By analyzing population, income, traffic, competitor presence, and proximity to other Starbucks stores, the company forecasts which new stores will likely succeed before leasing.
Geofencing enables businesses to engage customers in real time using location data. When a customer enters a predefined geographic area, such as a shopping center or a competitor’s parking lot, targeted messages, offers, or notifications are sent.
Fortune Business Insights projects the global geofencing market will grow from $2.65 billion in 2024 to $12.23 billion by 2032. This represents a 21% annual growth rate. Retail leads this sector, holding 24% of the market and maintaining the fastest growth rate.
Industry studies indicate that 70% of marketers believe geofencing improves engagement. Retailers using geofencing see a 30% rise in app engagement rates. These campaigns achieve a 4.2% click-through rate, nearly double the mobile ad average.
Delivering messages when customers are near a store or competitor increases performance compared to sending them at random times. This highlights the importance of timing and location when targeting customers.
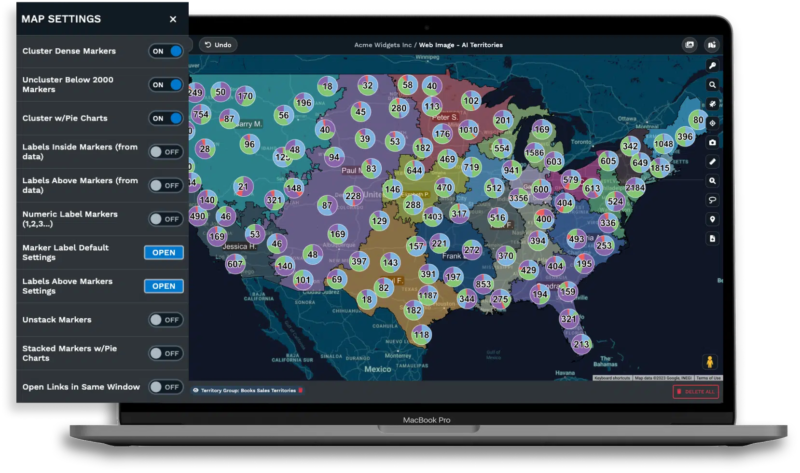
Sales teams work within physical space. Representatives travel to accounts and cover geographic regions. Dividing markets into clear territories affects productivity, costs, and coverage.
Geographic data allows smarter territory design. Alexander Group reports that organizations optimizing sales territories can see a 10% to 20% increase in productivity.
Well-sized sales organizations and balanced territories create cost savings. These benefits come from less windshield time and better routing efficiency.
Reducing time spent driving allows for more time selling. Improved coverage reduces missed opportunities. Balanced workloads support lower turnover and consistent service quality.
Modern location analytics operate in real time. Over 700 million users now send 20 billion daily location pings via movement-tracking platforms, allowing businesses to identify behavioral patterns with city-block-level detail.
The large data volume creates both opportunity and complexity. Data integration tools grow at a 17.2% annual rate as organizations work to blend various data feeds. Companies that process data quickly may gain an edge over those using static datasets.
Real-time analytics enable businesses to respond to current conditions, rather than relying only on historical patterns. A retailer can adjust staffing based on foot traffic, modify promotions in response to competitor activity, or redirect delivery routes based on current circumstances.

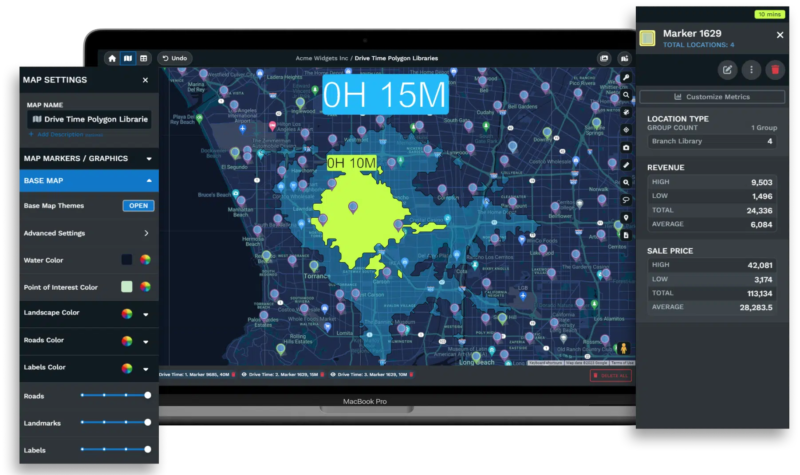
Geographic data is more powerful when combined with demographic information. Mapping income, age, education, and population density within boundaries reveals hidden opportunities.
A business might find that a zip code has many target customers but few sales. That gap is an opportunity. Another area may show saturation, suggesting extra investment may yield little return.
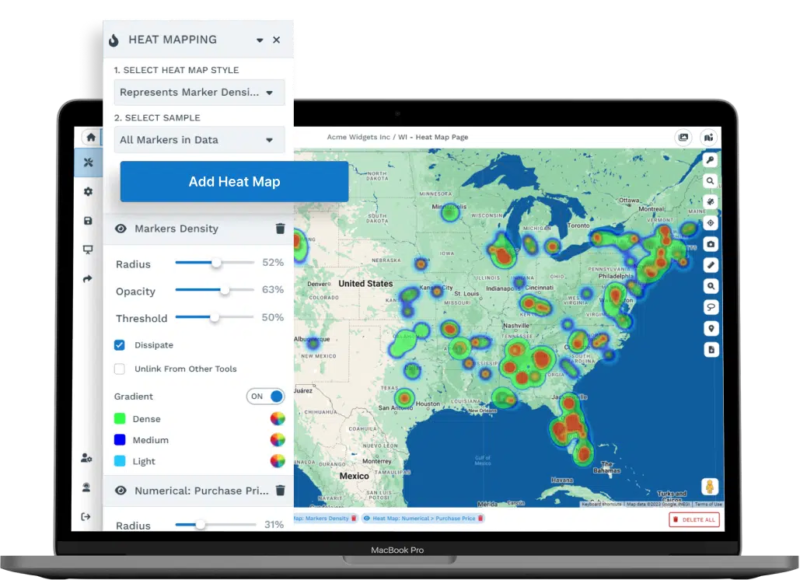
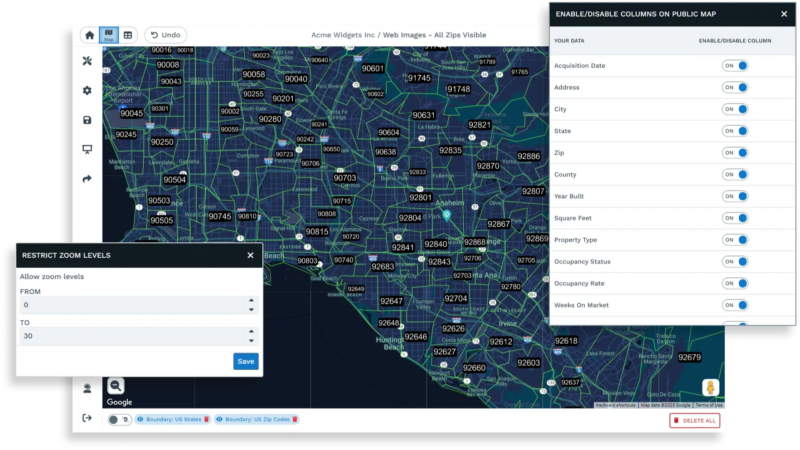
Color-coded heat maps can highlight regions or zip codes that may represent underserved markets, allowing companies to consider these opportunities. Identifying areas where potential customers live, but current customers do not, can inform expansion and marketing efforts.
Geographic data is valuable when businesses can interpret and act on it. Raw coordinates and spreadsheets do not reveal patterns, but visualization can.
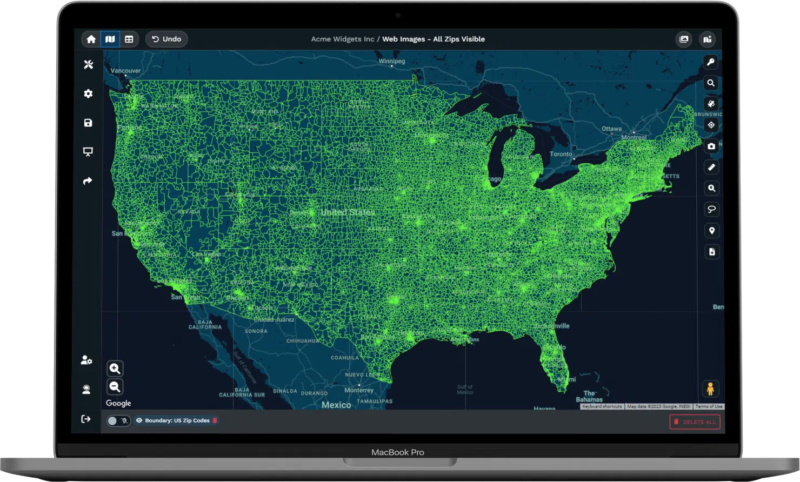
At Maptive, we provide businesses with tools to create interactive maps from geographic data, helping users identify customer patterns. The platform operates through the cloud, with no downloads or coding required.
Users can map business locations, suppliers, and competitors to support site selection. Sales teams can generate and optimize territories based on customer distributions. Route-planning features help delivery drivers and service providers reduce travel time and costs.
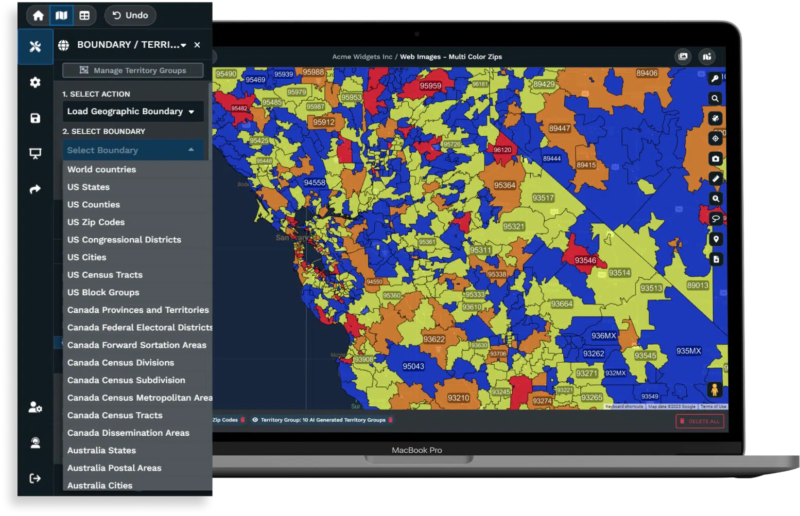
Our platform includes demographic mapping. It shows income, age, education, employment, and other traits within selected boundaries. Users can map zip codes, counties, cities, states, or districts and overlay trends to find underserved areas.
Converting location data into visual maps allows businesses to identify customer clusters, gaps, and potential opportunities. These insights become accessible to a broader range of users.
For more information on using geographic data to understand your customers, start a free trial.
Brad Crisp is the CEO at Maptive.com, based in Denver, CO and born in San Francisco, CA. He has extensive experience in Business Mapping, GIS, Data Visualization, Mapping Data Analytics and all forms of software development. His career includes Software Development and Venture Capital dating back to 1998 at businesses like Maptive, GlobalMojo (now Giving Assistant), KPG Ventures, Loopnet, NextCard, and Banking.