Maptive includes census data from the United States Census Bureau and Statistics Canada. This data is built into the platform and does not require a separate purchase or file uploads. It covers multiple geographic boundary types, with some variation in what metrics are available depending on the country and boundary level.
This article covers the census data available in Maptive, organized by category. It specifies which metrics exist for each boundary type and notes where US and Canadian data differ in structure or granularity.
Table of Contents
Census data in Maptive attaches to predefined geographic boundaries. The available boundaries differ between the United States and Canada, and each boundary type represents a different level of geographic granularity.
| Boundary Type | Description |
|---|---|
| States | The 50 US states plus Washington D.C. and territories |
| Counties | Approximately 3,200 county-level divisions. Louisiana uses parishes; Alaska uses boroughs and census areas |
| Zip Codes | Postal delivery zones established by the United States Postal Service. Over 40,000 zip codes exist nationwide |
| Congressional Districts | The 435 districts represented in the US House of Representatives, redrawn after each decennial census |
| Census Tracts | Subdivisions of counties designed to contain between 1,200 and 8,000 residents. Boundaries follow visible features like roads and rivers when possible |
| Block Groups | The smallest geographic unit with census sample data. Each block group contains between 600 and 3,000 people and sits within a single census tract |
| Boundary Type | Description |
|---|---|
| Provinces and Territories | The 10 provinces and 3 territories that make up Canada |
| Census Divisions | Intermediate geographic units between provinces and municipalities. These include counties, regional districts, and regional municipalities depending on the province |
| Census Metropolitan Areas | Urban cores with populations of 100,000 or more, plus surrounding areas tied to those cores by commuting patterns. Statistics Canada defines 35 census metropolitan areas |
Total population counts are available for all boundary types in both countries. This metric reports the number of people residing within each geographic unit.
Race and ethnicity data covers US boundaries at the state, county, zip code, congressional district, and census tract levels.
| Metric | Description |
|---|---|
| Percentage (White) | Population identifying as White alone |
| Percentage (Black) | Population identifying as Black or African American alone |
| Percentage (American Indian) | Population identifying as American Indian and Alaska Native alone |
| Percentage (Asian) | Population identifying as Asian alone |
| Percentage (Pacific Islander) | Population identifying as Native Hawaiian and Other Pacific Islander alone |
| Percentage (Other Race alone) | Population identifying as some other race alone |
| Percentage (Two or More Races) | Population identifying as two or more races |
| Percentage (Hispanic or Latino) | Population of Hispanic or Latino origin |
The Census Bureau treats Hispanic or Latino as an ethnicity rather than a race, which is why it appears as a separate metric.
Age data is available for all US and Canadian boundary types. The bracket structure differs between countries.
US boundaries provide 24 age metrics, including 23 age brackets and Median Age.
| Bracket | Bracket | Bracket |
|---|---|---|
| Under 5 | 5 to 9 years | 10 to 14 years |
| 15 to 17 years | 18 to 19 years | 20 years |
| 21 years | 22 to 24 years | 25 to 29 years |
| 30 to 34 years | 35 to 39 years | 40 to 44 years |
| 45 to 49 years | 50 to 54 years | 55 to 59 years |
| 60 to 61 years | 62 to 64 years | 65 to 66 years |
| 67 to 69 years | 70 to 74 years | 75 to 79 years |
| 80 to 84 years | 85+ years | Median Age |
The full bracket set is available for States, Counties, Zip Codes, and Congressional Districts. Census Tracts and Block Groups provide Median Age for quick reference at the neighborhood level.
Canadian boundaries provide broader age groupings with both counts and percentages for each.
| Metric | Format |
|---|---|
| Age 0 to 14 | Counts and Percentage |
| Age 15 to 64 | Counts and Percentage |
| Age 65 years and over | Counts and Percentage |
| Age 85 years and over | Counts and Percentage |
Available for Provinces and Territories, Census Divisions, and Census Metropolitan Areas.
Gender data reports male and female composition across all boundary types in both countries.
| Country | Metrics | Format | Boundaries |
|---|---|---|---|
| United States | Male, Female | Percentage | States, Counties, Zip Codes, Congressional Districts, Census Tracts, Block Groups |
| Canada | Male, Female | Count | Provinces and Territories, Census Divisions, Census Metropolitan Areas |
Housing metrics include total housing unit counts and average household size.
| Metric | US Boundaries | Canadian Boundaries |
|---|---|---|
| Housing Units | States, Counties, Zip Codes, Congressional Districts, Census Tracts, Block Groups | Provinces and Territories, Census Divisions, Census Metropolitan Areas |
| Average Household Size | States, Counties, Zip Codes, Congressional Districts, Census Tracts, Block Groups | Provinces and Territories |
Income data covers individual earnings, household income, and distribution across income brackets.
| Metric Type | Metrics |
|---|---|
| Summary | Median income (individual, population 15+), Median Household Income |
| Brackets | No Income, Some Income, $1 to $9,999 or loss, $10,000 to $14,999, $15,000 to $24,999, $25,000 to $34,999, $35,000 to $49,999, $50,000 to $64,999, $65,000 to $74,999, $75,000 or more |
The full set of income metrics is available for States, Counties, and Zip Codes. Congressional Districts include all bracket percentages and Median income. Census Tracts provide Median Income and Median Household Income for neighborhood-level analysis.
Provinces and Territories provide granular income brackets:
| Bracket | Bracket | Bracket |
|---|---|---|
| Without total income | Under $5,000 (including loss) | $5,000 to $9,999 |
| $10,000 to $14,999 | $15,000 to $19,999 | $20,000 to $24,999 |
| $25,000 to $29,999 | $30,000 to $34,999 | $35,000 to $39,999 |
| $40,000 to $44,999 | $45,000 to $49,999 | $50,000 to $54,999 |
| $55,000 to $59,999 | $60,000 to $69,999 | $70,000 to $79,999 |
| $80,000 to $89,999 | $90,000 to $99,999 | $100,000 and over |
Median total income ($) is also available. Canadian income brackets use $5,000 increments through $59,999, then shift to $10,000 increments. Census Divisions and Census Metropolitan Areas provide Median income.
Education data reports the highest level of schooling completed. US and Canadian metrics reflect the credential structures of each country.
| Metric |
|---|
| Less than High School Graduate |
| High School Graduate |
| Some College or Associate’s Degree |
| Bachelor’s Degree |
| Graduate or Professional Degree |
Available for States, Counties, Zip Codes, and Congressional Districts as percentages.
| Metric |
|---|
| No certificate, diploma or degree |
| Secondary (high) school diploma or equivalency certificate |
| Apprenticeship or trades certificate or diploma |
| College, CEGEP or other non-university certificate or diploma |
| University certificate or diploma below bachelor level |
| University certificate, diploma or degree at bachelor level or above |
Available for Provinces and Territories, Census Divisions, and Census Metropolitan Areas. Each metric includes both counts and percentages.
Citizenship data reports the percentage of residents by citizenship type.
| Metric |
|---|
| Born in US |
| Born in US Territories (Puerto Rico or US Island Areas) |
| US citizen, born abroad (of American parents) |
| US citizen by naturalization |
| Not a U.S. citizen |
Available for States, Counties, Zip Codes, and Congressional Districts.
| Metric |
|---|
| Canadian citizens |
| Canadian citizens by birth |
| Canadian citizens by naturalization |
| Not Canadian citizens |
Available for Provinces and Territories.
Labor data tracks workforce participation and employment status. The platform uses “Labor” for US boundaries and “Labour” for Canadian boundaries.
| Metric |
|---|
| In labor force |
| Employed |
| Unemployed |
| Not in labor force |
| Full time, year round |
| Less than full-time, year round |
| Did Not Work this year |
Available for States, Counties, Zip Codes, and Congressional Districts as percentages.
| Metric |
|---|
| Did not work |
| Worked full year full time |
| Worked part year and/or part time |
Available for Provinces and Territories and Census Metropolitan Areas. Each metric includes both counts and percentage distribution.
Transportation data reports how residents commute to work.
| Metric |
|---|
| Car, truck, or van (total) |
| Drove alone |
| Carpooled |
| Public transportation (excluding taxicab) |
| Bicycle |
| Walked |
| Worked at home |
Available for States, Counties, Zip Codes, and Congressional Districts as percentages.
| Metric |
|---|
| Driver, alone |
| 2 or more persons shared the ride to work |
| Public transit |
| Active transport |
| Sustainable transportation |
Available for Provinces and Territories.
Census data is accessed through the Boundary Tool. The steps are:
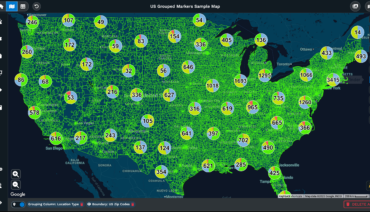
The map shades each geographic unit according to the selected metric. A color legend indicates the value ranges. Clicking any boundary opens a popup displaying the exact value for that area.
Boundary data can be exported to a spreadsheet by clicking the “Export to File” button at the bottom of the Boundary Tool panel. The export includes all boundaries on the map along with the selected demographic values.
U.S. Census data comes from the United States Census Bureau. The decennial census occurs every 10 years, with the American Community Survey providing annual estimates between census years. The American Community Survey samples approximately 3.5 million addresses each year and produces estimates for demographic, social, economic, and housing characteristics.
Canadian census data comes from Statistics Canada. Canada conducts its census every five years, most recently in 2021. Statistics Canada collects information on population, age, sex, family composition, household size, housing, and other characteristics through mandatory short-form and voluntary long-form questionnaires.
Maptive loads this data automatically when you select a demographic metric. There is no manual data entry or external file upload required.
Most US census metrics appear as percentages of the total population within each boundary. This allows direct comparison between areas of different sizes. A state with 10 million residents and a zip code with 15,000 residents can be evaluated side by side when both display the same percentage metric.
Canadian data includes both counts and percentages for many categories. Age, education, and labour metrics provide raw numbers alongside percentage distributions. Gender data for Canadian boundaries appears as counts.
Income bracket data shows the percentage of residents falling within each earnings range. Median values appear as dollar amounts.
When viewing the map, each boundary is shaded according to the selected metric. Boundaries with higher values receive different shading than those with lower values. The specific color scheme and value ranges appear in the legend displayed on the map. Clicking any boundary opens a popup containing the exact figure for that area.
Brad Crisp is the CEO at Maptive.com, based in Denver, CO and born in San Francisco, CA. He has extensive experience in Business Mapping, GIS, Data Visualization, Mapping Data Analytics and all forms of software development. His career includes Software Development and Venture Capital dating back to 1998 at businesses like Maptive, GlobalMojo (now Giving Assistant), KPG Ventures, Loopnet, NextCard, and Banking.