Sales data is often disorganized. Grouping it by zip code can help you identify patterns, track customer habits, and make more informed plans. Some software tools, such as QuickBooks, Square, and Braintree, make this process easier. But you can also use Excel or mapping software to get the same results. This guide explains four clear ways to total and review your sales by zip code. Each method is suitable for different types of data and business setups.
Table of Contents
Pivot tables in Excel help you summarize large sets of sales data by zip code. They are useful when you need a clear total of sales across many periods or sources.
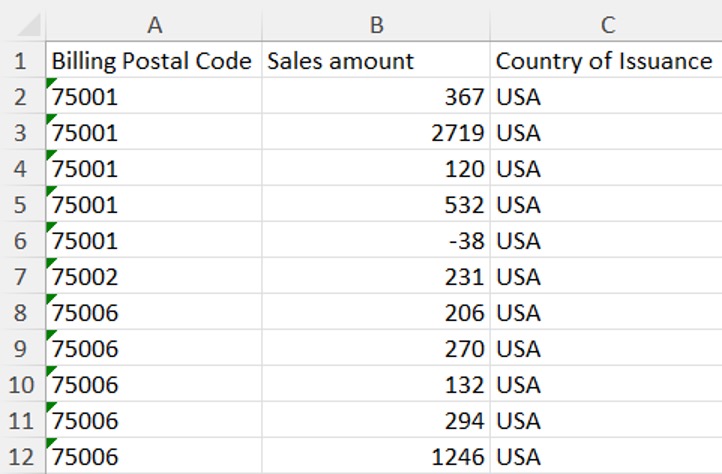
Start with a dataset that has two key columns: one for zip codes and one for sales amounts. Make sure each column has a clear header.
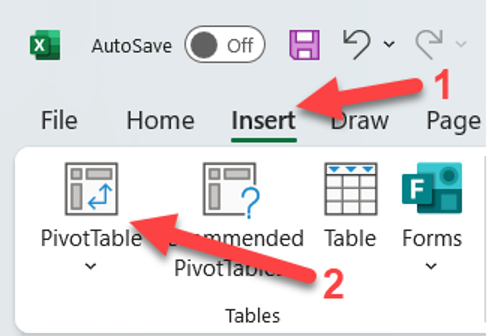
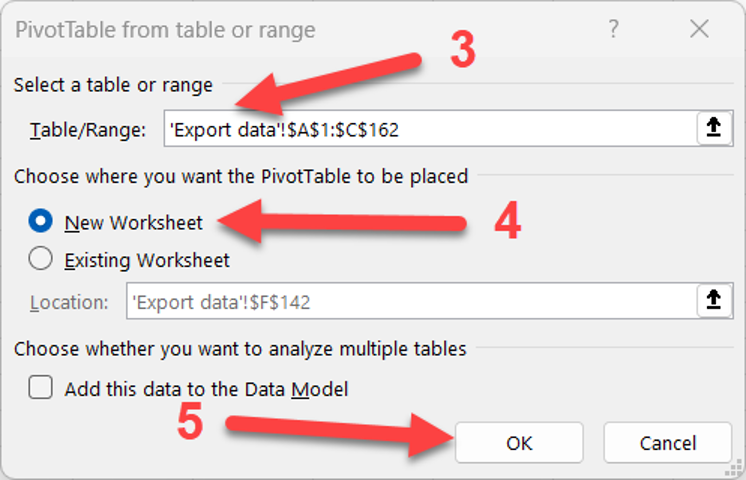
Select all the data, including the headers. Go to the Insert tab, then click Pivot Table.
Excel will ask you to confirm the data range. You can choose to place the pivot table in a new worksheet or keep it in the current one.
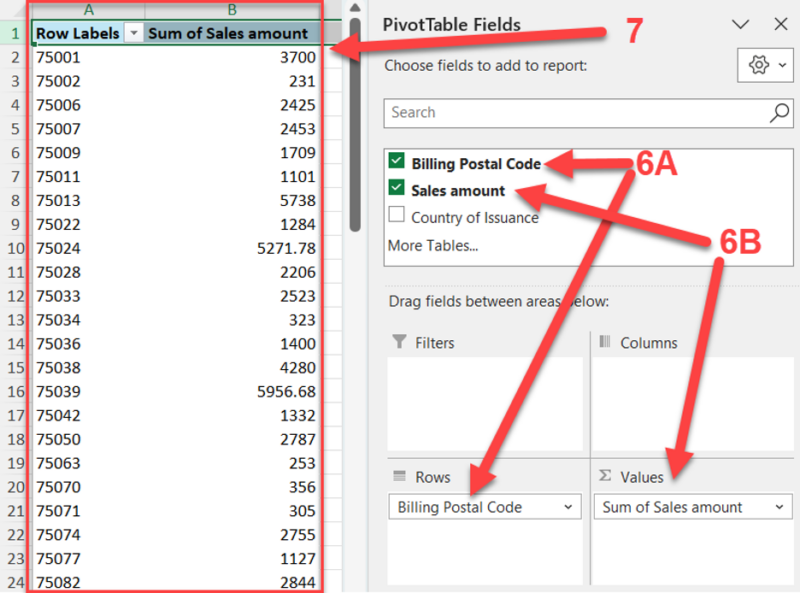
After clicking OK, a field list appears on the right. Drag the zip code column into the Rows area. Drag the sales column into the Values area. Excel builds a table showing each zip code and its total sales.You can change how the table looks, filter it, add other fields like sales dates or names, and refresh it when your data changes.
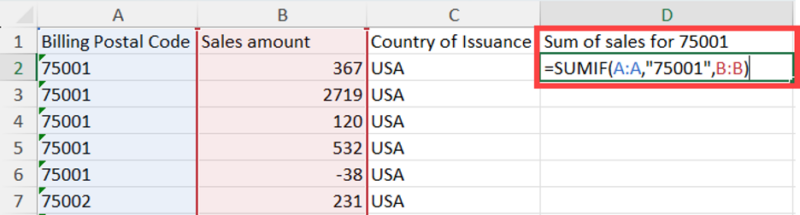
If you need to calculate total sales for one zip code, use the SUMIF formula in Excel. It’s faster than a pivot table when your goal is a single result.
The formula takes three inputs:
For example:
=SUMIF(A:A, “75001”, B:B)
Here, Excel looks through column A for “75001” and adds up the values in column B where the match occurs. The total appears immediately.
This method is best when you need a quick total for one zip code and don’t need to rearrange or explore the full dataset.
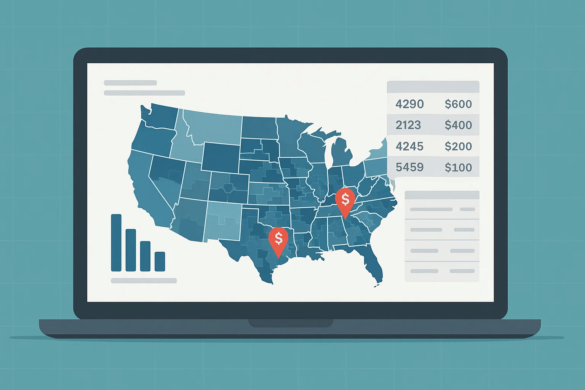
Excel includes a built-in map chart that shows sales by zip code on a visual map. This can help you spot geographic patterns quickly. It works well for basic visual reports.
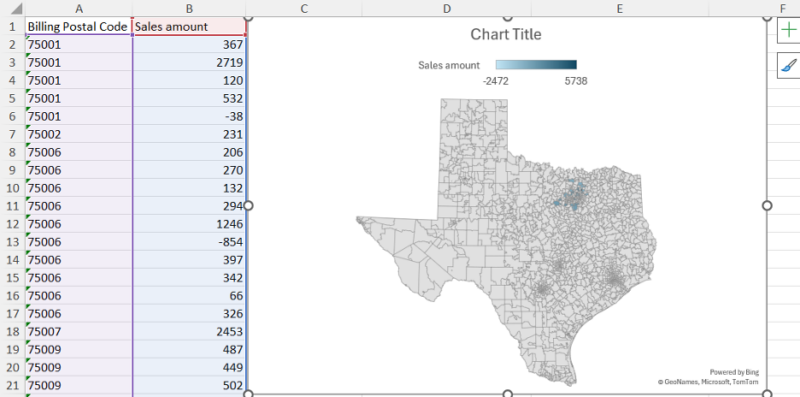
To build a map:
Excel may ask for permission to send data to Bing to create the map. After approval, it will generate a color-coded map that shows sales totals by zip code. You can adjust the map’s color and style, but options are limited. For simple geographic views, this method works fast and requires no setup outside Excel.
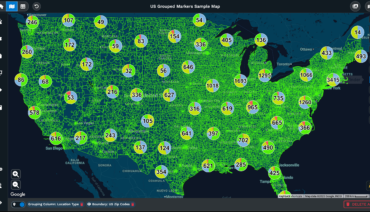
If you need more control and detail than Excel offers, use mapping software like Maptive. It gives you tools to break down sales data by zip code with greater precision.
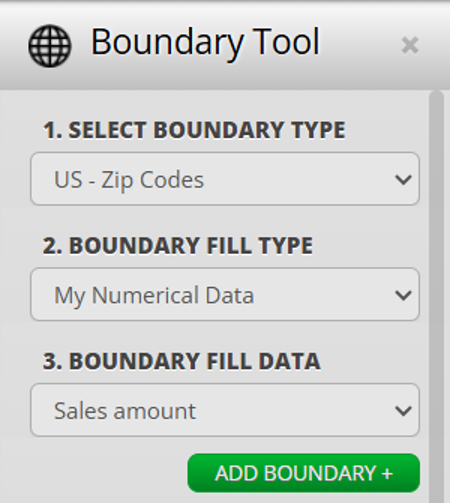
Start by creating an account on Maptive. Upload your Excel file with zip codes and sales data. Use the Boundary Tool to group data by zip code. Select the zip code option and click Add Boundary to create the map.
Maptive lets you do more than show totals. You can create custom sales regions, draw circles around key locations, and see sales performance within set distances. For example, you can place a 5-mile circle around a store and see how much that area contributes to total sales.
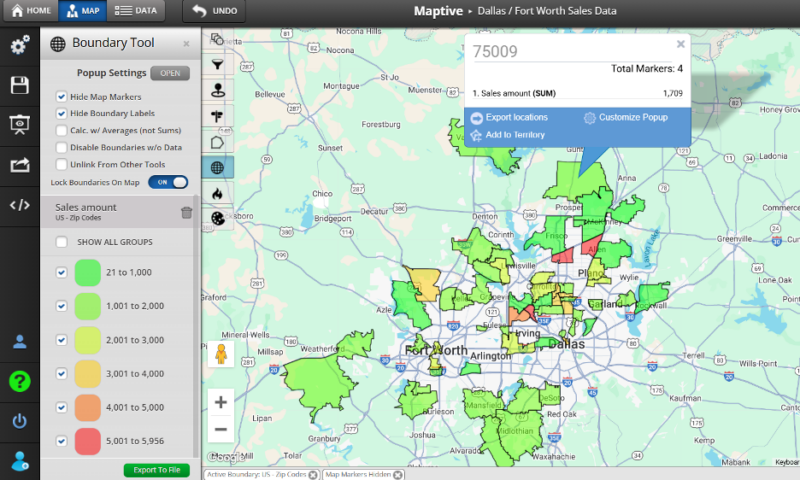
You can also group and sum data by zip code, helping you spot top-performing areas or find new markets to target.
Choosing the Right Method
The method you use depends on how much detail you need and how you plan to use the results. Use pivot tables if you need a quick summary and flexible reporting. Use SUMIF when you only need totals for one zip code. Use Excel maps if you need a simple visual for a presentation or report.
If you need deeper geographic analysis or custom territory mapping, use software like Maptive. It handles larger datasets, creates detailed maps, and helps with planning and targeting.
Conclusion
You can break down sales by zip code using any of these four tools: pivot tables, SUMIF, Excel maps, or mapping software. Each tool fits a different use case. Choose based on how much data you have and what you need to do with it. Clear totals and visual data help you make better business decisions.
Fred Metterhausen is a Chicago based computer programmer, and product owner of the current version of Maptive. He has over 15 years of experience developing mapping applications as a freelance developer, including 12 with Maptive. He has seen how thousands of companies have used mapping to optimize various aspects of their workflow.