Microsoft raised its Power BI pricing in April 2025. Power BI Pro now costs $14 per user each month, up from $10. Power BI Premium jumped from $20 to $24. Month-to-month subscribers pay an extra 5% on top of those rates. For teams with 50 or 100 users, these increases add up fast. And the pricing changes arrive alongside familiar frustrations: Windows-only authoring, a 1GB cap on imported datasets for standard licenses, weak NoSQL support, and a DAX learning curve that slows down analysts who need to move quickly.
If your team has outgrown Power BI or simply wants better value, you have options. This comparison covers five alternatives worth considering in 2026, each suited to different needs and budgets.
Table of Contents
| Platform | Best For | Starting Price | Key Strength |
|
Maptive |
Location-based analytics, territory mapping | $1,250/year |
Geospatial tools with 100,000+ location handling |
|
Tableau |
Advanced visualization | $15/user/month (Viewer) |
Deep chart customization |
| Qlik Sense | Associative data exploration | $825/month (Standard) |
Self-service analytics |
| Looker | Enterprise-scale embedded analytics | $36,000+/year |
Native Google Cloud integration |
| Metabase | Small teams, open-source flexibility | Free (Open Source) or $85/month |
Low barrier to entry |
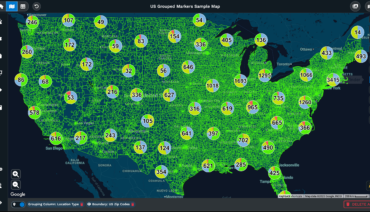
Power BI handles charts and dashboards well, but it struggles when your data carries geographic weight. Sales territories, delivery routes, customer clustering, and service area planning require tools built for spatial work. This is where Maptive fits.
Maptive ranked number one in Best Online Mapping Software in January 2025 industry reviews and earned recognition as the Most User-Friendly Location Intelligence Platform in mid-2025. The platform handles maps with over 100,000 locations and plots entire address databases at 10 locations per second. By comparison, some competing tools show performance problems above 30,000 to 50,000 points.
Drive-time polygon calculations now use 300% more calculation points than earlier versions of the software. Logistics teams testing the platform saw routing errors drop by roughly 22%, and fuel costs in pilot studies fell as much as 15%. A field service company reported an 18% drop in fuel costs and a 22% increase in completed service calls after switching to Maptive iQ. A logistics firm processed thousands of routes in seconds and reduced holiday shipping delays by over 40%.
The platform holds an average G2 review score above 4.5 out of 5, and 89% of users point to easier territory assessment and heatmap use as primary benefits.
Annual pricing starts at $1,250 for individual users. Team plans cost $2,500 and support up to 400,000 geocoded addresses. Enterprise clients can process over 1 million geocodes monthly. Compared to Esri and other full GIS tools, Maptive’s monthly user cost runs more than one-third lower for similar features.
API enhancements enable syncing with Salesforce and HubSpot, and direct integrations are rolling out late 2025. A mid-sized SaaS company reported 15% productivity improvement after connecting Maptive to Salesforce.
Best for: Teams that rely on geographic data for territory management, route optimization, or location-based customer analysis.
Tableau has been a staple in data visualization for years, and that reputation holds in 2026. The platform offers granular control over how charts and dashboards look and behave. Analysts who spend time fine-tuning visual presentations often prefer Tableau over Power BI because of its flexibility.
Viewer licenses cost $15 per user each month, billed annually. Explorer licenses run $42 per user monthly. Creator licenses cost $75 per user monthly. Enterprise tiers push higher: Viewer at $35, Explorer at $70, and Creator at $115 per user each month.
These rates climb quickly for larger teams. A 50-person team with mixed license types can spend several thousand dollars monthly. Still, Tableau’s strength lies in its visualization depth. If your analysts need precise control over chart design and enjoy building interactive dashboards with layered filtering, Tableau delivers.
Tableau requires more technical skill than some alternatives. The learning curve is steeper than Power BI for basic users, and the cost scales faster than many mid-sized companies expect. The platform also lacks native geospatial tools at the level Maptive provides.
Best for: Data teams with visualization-heavy requirements and budgets to support enterprise licensing.
Qlik Sense takes a different approach to data exploration. Its associative engine lets users click through data points and see how selections affect the entire dataset in real time. This model works well for teams that want to ask questions without predefining every possible drill-down path.
The Standard Plan starts at $825 per month and includes 20 full-user licenses. The Premium Plan costs $2,700 per month with 20 full-user licenses included. Most teams pay between $30,000 and $300,000 annually depending on size. A 50-person team typically pays $60,000 to $100,000 per year for licensing alone, which works out to roughly $100 to $165 per user monthly.
Qlik’s associative model helps teams uncover connections they might miss in traditional BI tools. The platform supports self-service analytics, so business users can build their own reports without waiting on IT. However, the licensing model can confuse new buyers, and the total cost often surprises teams during renewal.
Best for: Organizations that value exploratory analytics and have budget for enterprise licensing.
Looker, now part of Google Cloud, targets enterprises that need embedded analytics and native integration with BigQuery. The platform uses a modeling language called LookML to define metrics and dimensions in a central layer, which keeps reporting consistent across teams.
Looker costs between $36,000 and $60,000 per year for 10 to 25 users. Teams with 50 to 100 users pay between $84,000 and $120,000 per year. Organizations with 250 or more users spend $216,000 to $360,000 annually or higher. These figures cover licensing only. Implementation, BigQuery usage, and maintenance add to the total. Looker runs 2 to 3 times more expensive than Tableau and 14 to 20 times more than Power BI.
If your company already runs on Google Cloud and needs a BI layer that integrates tightly with BigQuery, Looker makes sense. For teams without that infrastructure, the cost and complexity may outweigh the benefits.
Best for: Large enterprises with Google Cloud infrastructure and embedded analytics requirements.
Metabase offers a simpler path for small teams and startups. The open-source version is free, which makes it accessible for companies testing BI tools without committing to annual contracts.
The Starter plan costs $85 per month for five users, with an additional $5 per month for each new user. The Pro Plan runs $500 per month and includes 10 users, then $10 per user monthly after that. The Enterprise Plan starts at $15,000 annually. Metabase has four pricing editions ranging from $0 to $15,000.
Metabase lets users query databases without writing SQL, which speeds up adoption for non-technical team members. The interface is clean, and the learning curve is low. However, Metabase lacks advanced visualization features and enterprise-grade governance. It works well for straightforward reporting but may not scale for complex analytics needs.
Best for: Small teams, startups, and companies looking for a low-cost entry point into business intelligence.
Power BI remains a solid tool for teams embedded in the Microsoft ecosystem. But rising prices and persistent limitations push many organizations to evaluate alternatives. The right choice depends on what your team actually does with data.
If your work involves geographic analysis, territory planning, or route optimization, Maptive provides purpose-built tools that Power BI cannot match. Tableau suits teams with advanced visualization needs and budget flexibility. Qlik Sense works for exploratory analysis with associative data models. Looker fits Google Cloud environments with enterprise-scale requirements. Metabase offers an affordable starting point for smaller teams.
The location intelligence market reached approximately $25 billion in 2025, with research firms projecting compound annual growth rates between 13% and 17% through 2030. Teams that depend on geographic data will find growing support for their needs in platforms like Maptive, while traditional BI tools continue to serve broader analytics use cases.
Evaluate based on your data types, team size, and budget. The best tool is the one your team will actually use.
Brad Crisp is the CEO at Maptive.com, based in Denver, CO and born in San Francisco, CA. He has extensive experience in Business Mapping, GIS, Data Visualization, Mapping Data Analytics and all forms of software development. His career includes Software Development and Venture Capital dating back to 1998 at businesses like Maptive, GlobalMojo (now Giving Assistant), KPG Ventures, Loopnet, NextCard, and Banking.