Retail Mapping Software: Prevent Costly Location Mistakes
Are you opening stores based on real estate availability while competitors use data to lock down locations that actually make money? We turn retail guesswork into profitable expansion.
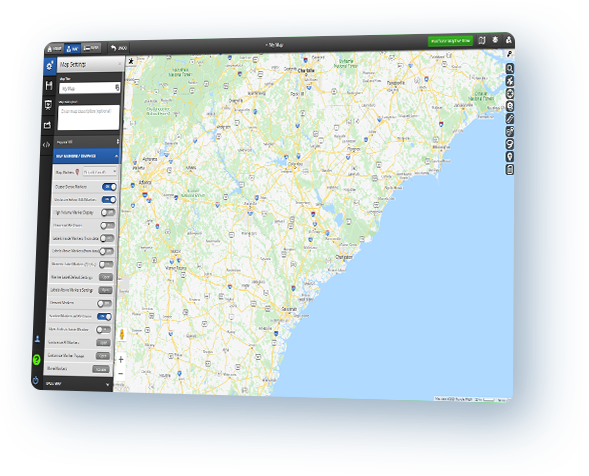
Map Every Store Location Decision Before You Sign the Lease
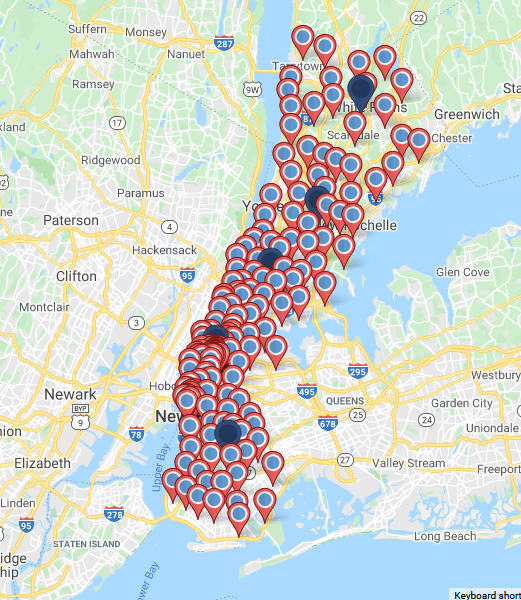
Upload addresses for your current stores, potential sites, competitor locations, and customer data. Watch everything appear on one map that shows exactly which locations will drive revenue and which ones will cannibalize your existing stores.
See population density, household income, and traffic patterns around every potential site. Compare five locations simultaneously to identify which one puts you in front of high-value shoppers without stealing sales from your profitable stores.
Avoid Opening Stores That Steal From Each Other
Draw trade areas around your existing locations to see where customer bases overlap. A 40% overlap means your new store will pull customers from current locations instead of capturing new shoppers.
One grocery chain discovered two proposed sites would cannibalize 18% of sales from nearby stores. They chose a third location that added $4.2 million in new revenue instead of redistributing existing sales across more overhead.
What Maptive Retail Mapping Solves Before You Sign a Lease
See Which Markets Have Room for Your Stores
Pull census data directly onto any location with one click. Household income, age distribution, education levels, homeownership rates, and transportation patterns appear instantly.
A furniture retailer analyzed three potential sites and found one had 65% homeownership and median income of $95,000 within a 15-minute drive. The other two sites had 40% homeownership and lower incomes. They opened in the high-homeownership area and hit revenue targets in month three.
Identify Where Competitors Dominate Before You Invest
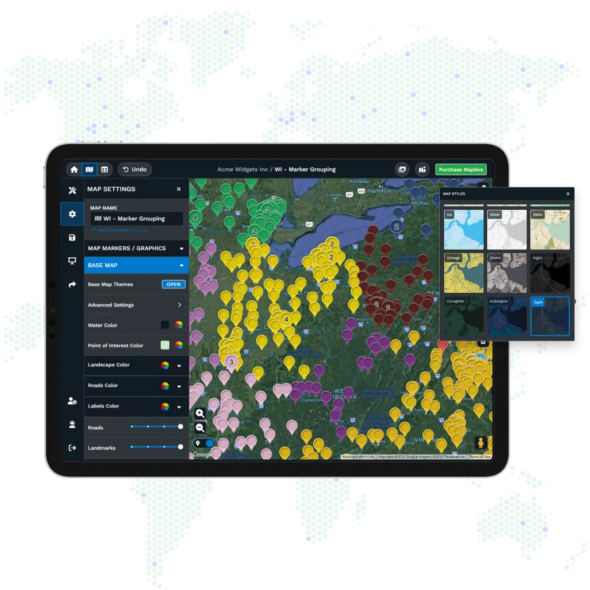
Upload competitor store addresses to see exactly where they operate. Color-code them by brand so you spot oversaturated markets and underserved areas at a glance.
Draw radius circles around competitor locations to measure how close your potential site sits to their stores. One coffee chain discovered their proposed location was within 0.8 miles of four competitors. They found an alternate site two miles away with zero direct competitors and similar demographics.

Get White Glove Support When Lease Decisions Move Fast
Real estate opportunities disappear in days. Our support team answers questions immediately and helps you set up trade area analyses so you make location decisions based on data instead of pressure from landlords.
Account managers work with retail chains to configure custom workflows for evaluating multiple sites simultaneously. You get help from people who understand retail operations and site selection, not just mapping features.
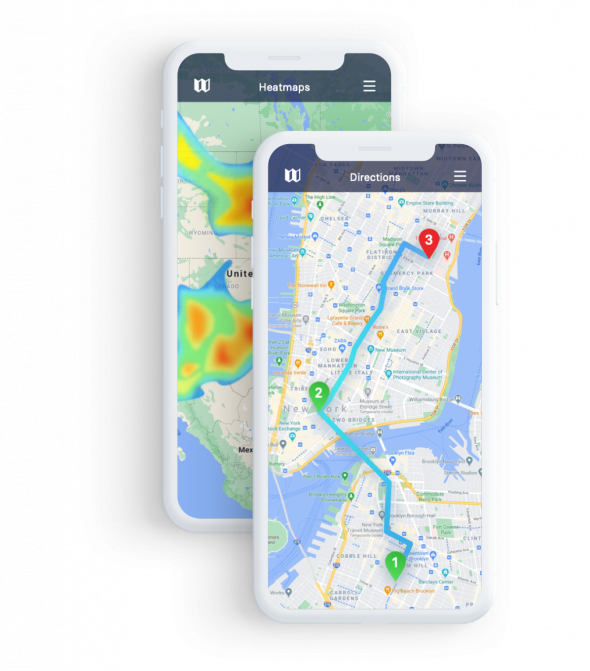
Cut Delivery Costs With Optimized Supply Routes
Map your distribution centers, suppliers, and store locations on one screen. Calculate drive times between warehouses and stores to identify which locations take longest to restock.
Route optimization plans the fastest path through up to 73 stops, accounting for various factors. One regional chain reduced delivery times by 22% and saved $67,000 in annual fuel costs by eliminating inefficient routes.
Keep Store Data Away From Competitors
Store locations, sales figures, and expansion plans are worth millions to competitors. We protect everything with 256-bit SSL encryption, the same standard banks use for online transactions.
Role-based access means store managers see only their locations while executives access the full network. Audit logs track every change so you know who viewed expansion plans and when.
Connect Your Retail Systems Through Our API
We integrate with your existing platforms through API connections. Store performance data, customer addresses, and sales metrics flow into maps automatically so your site selection analysis stays current.
Changes sync both ways, keeping your retail technology stack updated without manual data transfers. Late 2025 brings direct integrations with Salesforce and HubSpot that streamline site evaluation workflows.
Features Built for Retailers Who Expand Smart
Trade Area Overlap Analysis for Cannibalization Prevention
Draw boundaries around stores to visualize overlapping customer bases. Spot which new locations will steal from existing stores before signing leases.
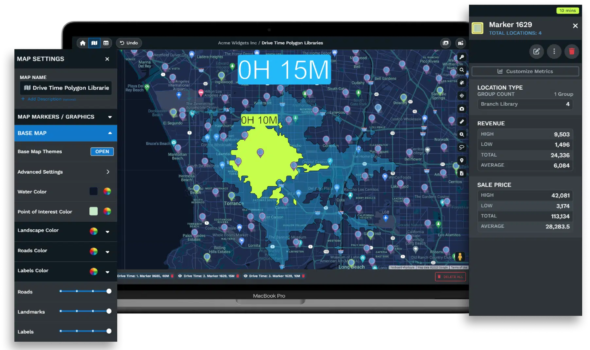
Drive-Time Polygons to Map True Market Reach
Show 10, 20, or 30-minute drive zones from any location. Find gaps in coverage and areas where customers can't easily reach your stores.
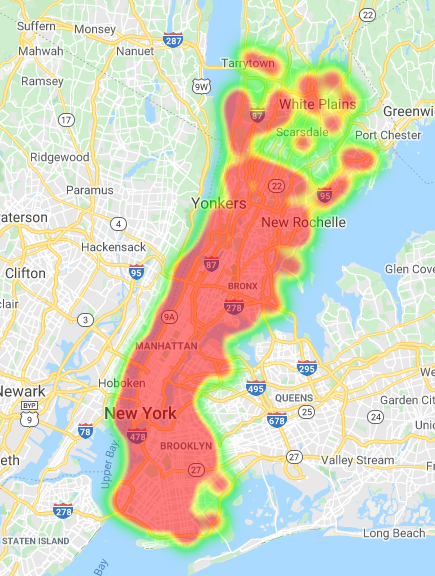
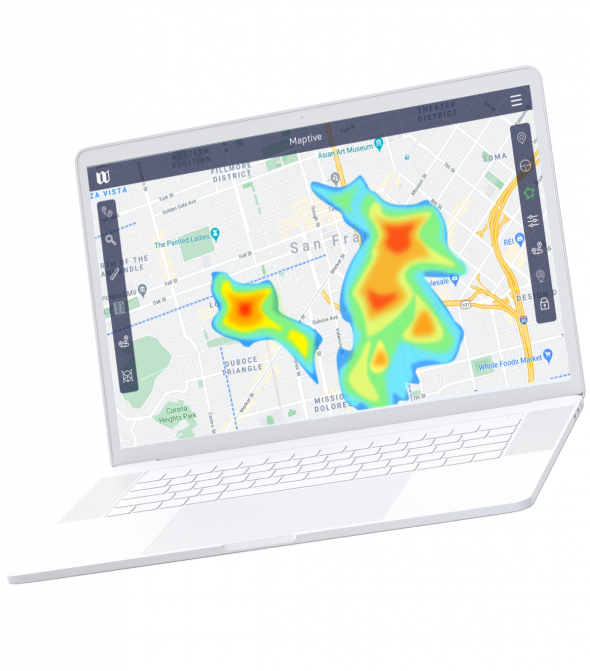
Population Density Heatmaps for Market Sizing
Layer census data showing how many people live near potential sites. Target high-density areas with the right customer demographics for your brand.
Competitor Distance Measurement for Strategic Positioning
Calculate exact distances between your sites and competitor locations. Identify markets with strong demand but weak competitor presence.
Custom Store Markers Showing Performance Metrics
Color-code locations by revenue, foot traffic, or any metric you track. Identify top performers and underperformers without opening spreadsheets.
Market Boundary Tools for Regional Planning
Group stores into territories and compare performance across regions. See which markets need more locations and which ones are saturated.
Ready to Try Maptive?
Start using Maptive and see how retail mapping can be fast and reliable. Get started with a simple sign-up, quick data import, and responsive support from day one. Focus on expansion with low risk and real help at every stage.
Retail Mapping Software FAQs
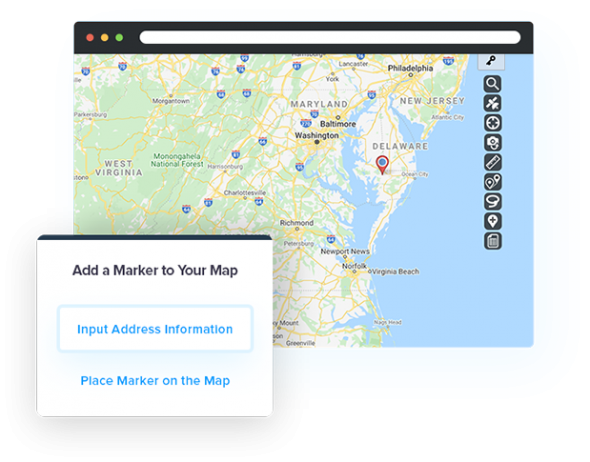
How quickly can I start mapping potential store locations?
Most retailers start mapping within 15 minutes of signing up. Upload your store addresses, potential sites, and competitor locations to see everything plotted instantly. No training required.
Can I see demographic data for potential locations?
Yes. We include U.S. and Canadian census data covering population, income, age, education, employment, and housing. This data costs thousands from other providers but comes with your subscription.
How do I measure cannibalization risk between stores?
Draw trade area boundaries around your existing stores and proposed locations. We calculate the overlap percentage and show exactly how many customers fall within both trade areas.
What file formats work for uploading store data?
We accept Excel, CSV, Google Sheets, and most standard spreadsheet formats. Copy and paste directly from your files or connect through our API for automatic updates.
Can I compare multiple potential sites at once?
Yes. Plot all potential locations on one map and pull demographic data, competitor proximity, and trade area analysis for each site simultaneously. Compare them side by side to make faster decisions.
How do I track competitor locations?
Upload competitor addresses just like your own stores. Color-code them by brand so you see exactly where each competitor operates and measure distances to your potential sites.
Can multiple team members access expansion planning maps?
Yes. Set permission levels so regional managers see only their areas while executives access everything. Changes appear in real-time for everyone with access.
Do you offer support for retail expansion planning?
Our white glove support includes personalized onboarding for retail chains. Smaller retailers get access to video tutorials, documentation, and our support team. Most site selection analyses require no formal training.