PDF Maps: Custom Maps You Can Download
Download PDF maps created from our datasets, updated regularly to provide the latest state and national information in one place.
View or Download PDF Maps
Unemployment Rates by State
Track unemployment percentages by state, mapped to show regions with higher joblessness compared with areas experiencing stronger employment conditions.
Download PDF
Employment Rates by State
Review employment percentages across states, mapped to highlight workforce participation levels and overall employment distribution across the country.
Download PDF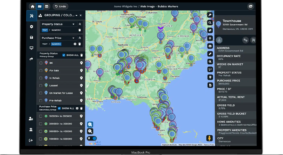
College Graduates by State
Measure graduation totals by state, mapped to show where higher education completion varies across the country.
Download PDF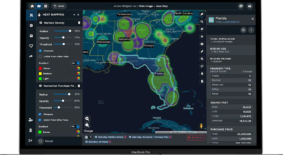
Hispanic Population Distribution
View Hispanic population totals across states, mapped to highlight areas of concentration and differences across regions of the country.
Download PDF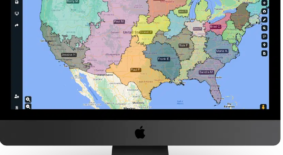
White Population Distribution
See how White residents are distributed across states, with totals mapped to highlight concentrations and differences between regions.
Download PDF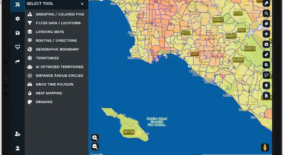
Black Population Distribution
Track where Black populations are concentrated across states, with totals mapped to highlight variation and demographic distribution across regions.
Download PDF
Labor Force Participation
Compare workforce participation across states, mapped to highlight how many residents are active in the labor market.
Download PDF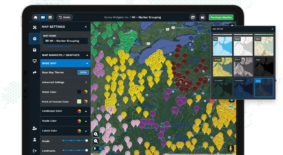
Naturalized Citizens by State
See totals of naturalized U.S. citizens across states, mapped to highlight concentrations and differences between various regions.
Download PDF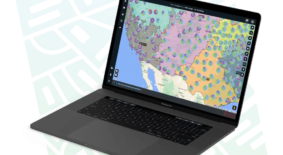
Median Age by State
Explore median age across states, mapped to highlight demographic differences and generational shifts throughout the country.
Download PDF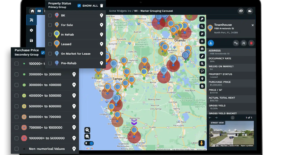
Median Household Income
Review household income levels across states, mapped to highlight economic differences and variations in earnings across the country.
Download PDF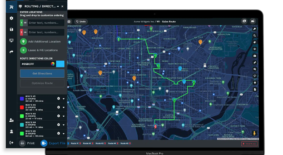
Average Household Size
Compare average household sizes in every state, mapped to highlight variations in household structure and living patterns across regions.
Download PDF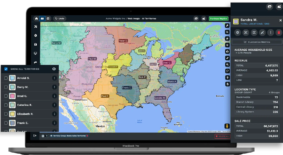
United States Population by State
View population totals across all U.S. states, mapped to highlight differences in size and distribution throughout the entire country.
Download PDF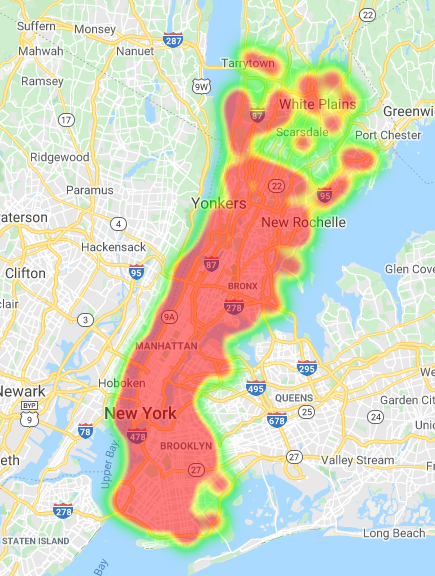
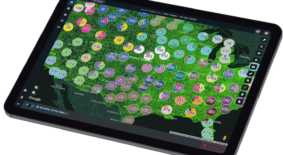
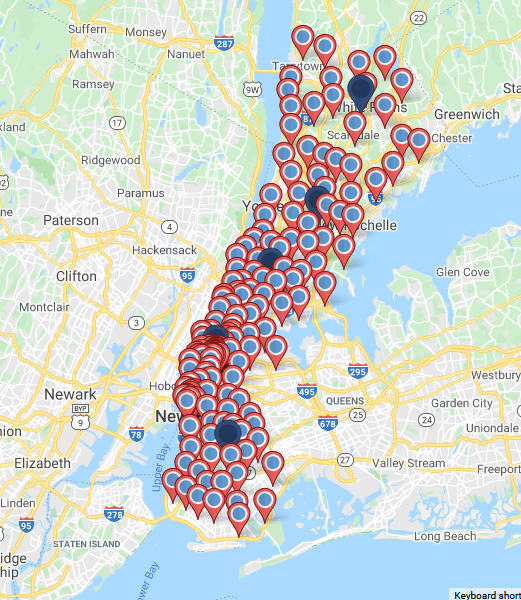
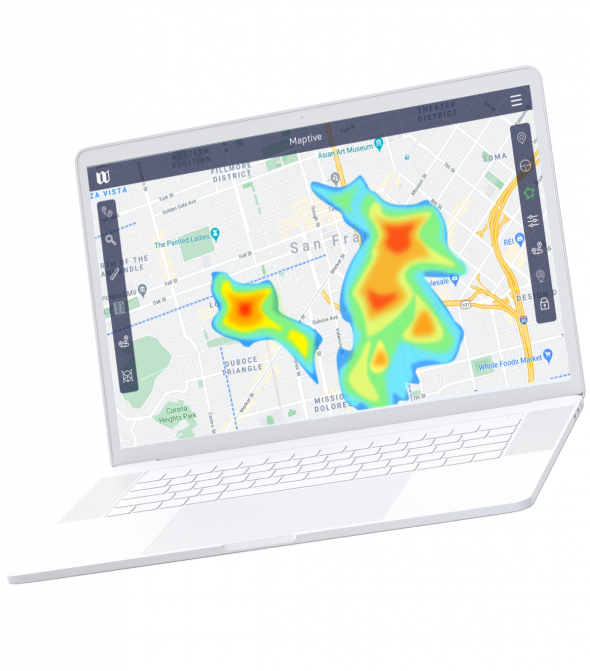
Visualize Your Data in Seconds
Upload your spreadsheet and watch your locations come to life on a map. Use heatmaps, filters, and demographics to reveal trends hidden in rows of numbers.
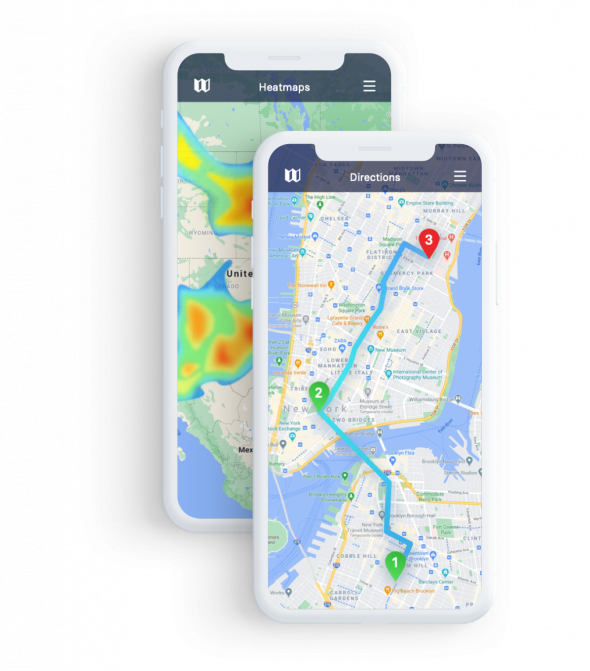
Plan Smarter Routes and Territories
Create optimized routes with multiple stops and assign territories based on your business goals. Save time on logistics and reduce travel costs while improving coverage.
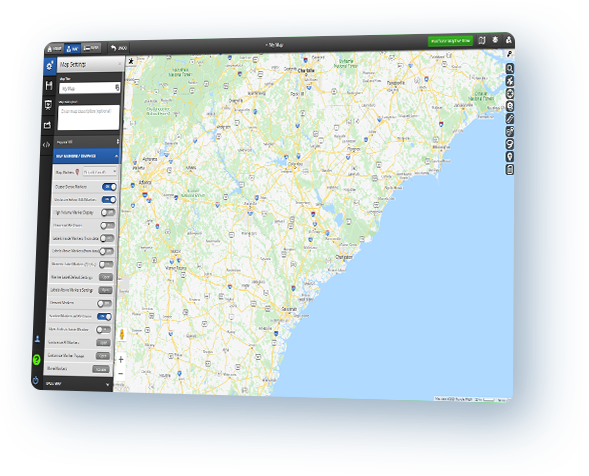
Work With an Interface Anyone Can Use
Maptive is built for teams who don’t have GIS training. Drag-and-drop tools let you filter, color-code, and customize maps without outside help.
Access Maps Anywhere You Work
Since Maptive runs in the cloud, your maps are ready on desktop, tablet, or phone. No software installation is required, and updates sync automatically.

Get Support When You Need It
From setup guides to responsive customer service, Maptive makes sure your team has help every step of the way. Pricing is transparent, so there are no hidden surprises.
Keep Your Data Secure and Reliable
Your maps run on Google’s mapping platform with enterprise-grade encryption and global accuracy. You can trust that your information is protected and always current.