What is Mapping?
Mapping is a process of creating a representation of an area, typically via a two-dimensional medium such as paper or a computer screen. It allows people to understand spatial relationships and patterns within an area. Mapping can be used for things like data visualization, navigation, urban planning, business planning, and disaster response purposes.
Many different terms are associated with mapping, which can confuse those new to the field. This article provides definitions and examples for some of the most popular mapping terms and types of maps to help people better understand this process.
If you’d like to try creating some of the types of maps mentioned in this article yourself, try the 10-day free trial of Maptive 100% risk free. No credit card required.
Types of Maps
- Choropleth map: A choropleth map is a type of thematic map in which areas are shaded or patterned in proportion to the measurement of the statistical variable being displayed on the map, such as population density or per-capita income. iso

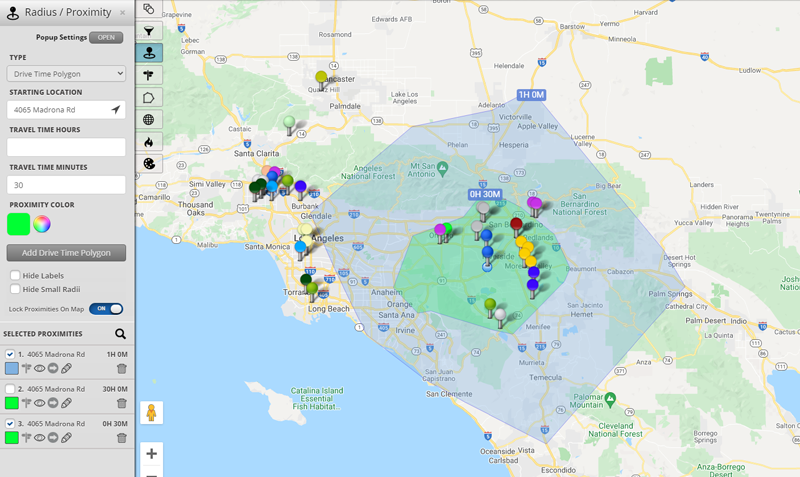
- Isochrone Map: An isochrone map is a type of map that shows the areas that can be reached within a certain amount of time. Isochrone maps are often used to show things like travel times or delivery routes.
- Cartogram: A cartogram is a map in which some mapping variable – such as land area or population – is substituted for geographic space. The resulting cartogram may provide better visual discrimination for your statistical variable than the original geographic area mapping.
- Isoline map: An isoline map is any thematic map (usually vector-based) where lines indicate areas that share a common value for the variable displayed on the map. Isolines are sometimes known as isarithmic or isochronic maps.
- Dot density map: A dot density map, also sometimes called a dot distribution map, is a type of thematic mapping that uses dots (or other symbols) to visually show the density of some mapping variable within a particular area.
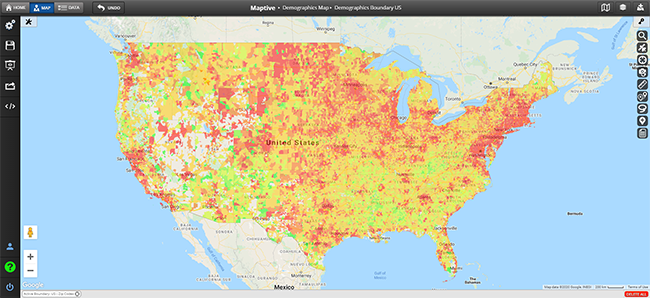
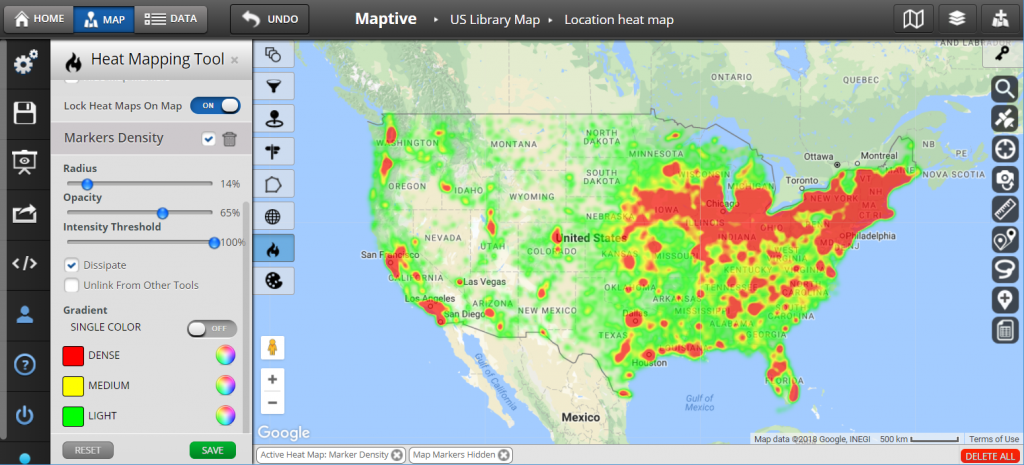
- Heat map: A heat map is a type of raster data visualization that uses color to represent specific values in a dataset. Heat maps are often used to visualize hot spots within data sets, such as locations with high crime rates or regions that experience a lot of traffic accidents.
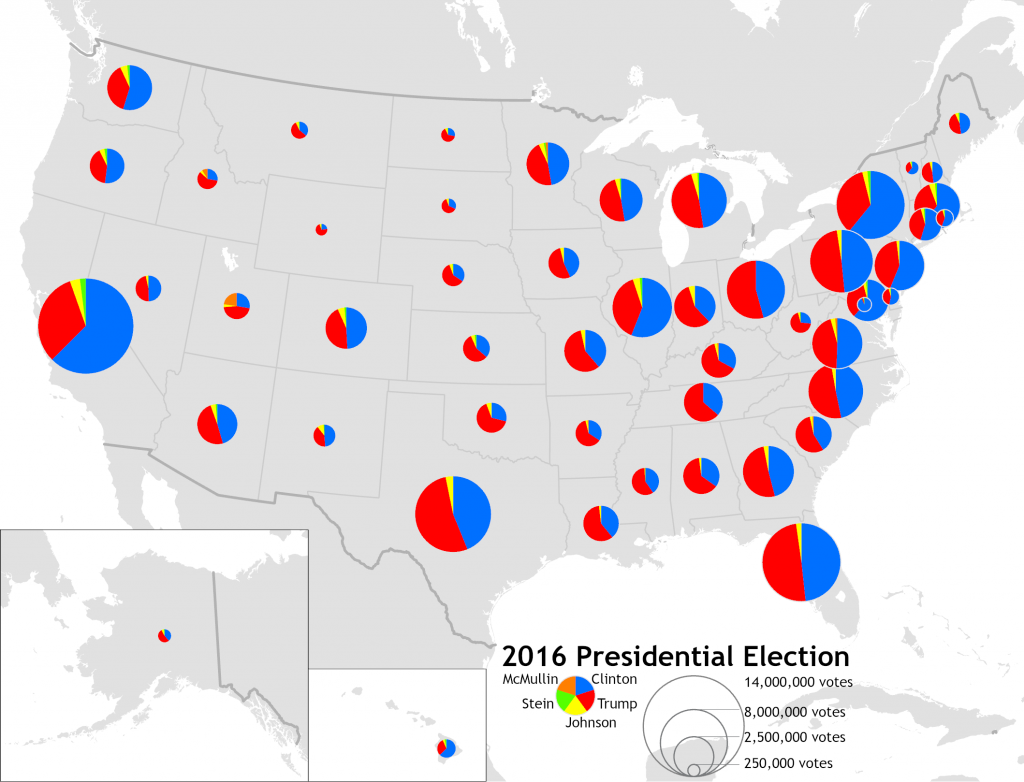
- Proportional symbol map: A proportional symbol map is any thematic map where the mapping variable is represented by symbols that are sized according to the magnitude of that variable.
- Flow map: A flow map is any thematic map that shows the movement of objects (usually people or goods) from one place to another. Flow maps typically use arrows to show the direction and magnitude of the movement and often include some measure of how many objects are moving.
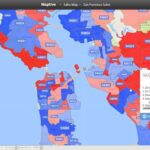
- Political map: A political map is a type of map that shows the boundaries of countries, states, and counties. Political maps are often used to show the results of elections or track disease spread.
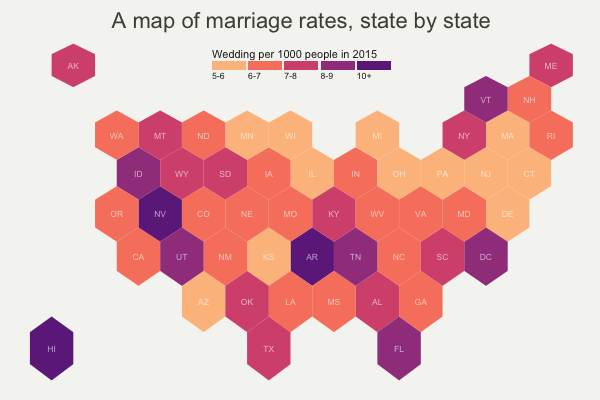
- Hexbin map : A hexbin map is a type of dot distribution map where the map is divided into hexagonal bins instead of square or rectangular bins. This can be useful when you want to avoid the “stair-step” effect that can occur with square or rectangular bins.
Image Source: R-Graph-Gallery
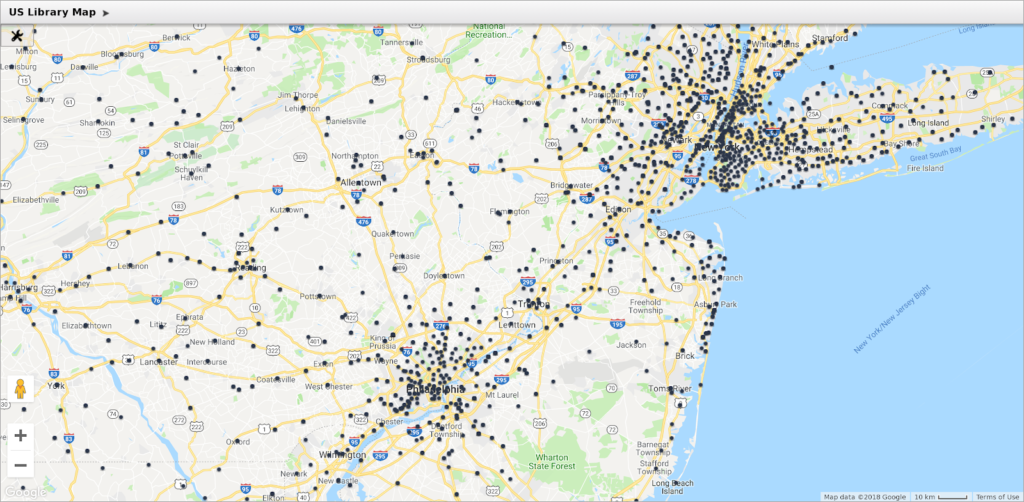
- Location map: A location map is any map that shows the location of a particular place or thing. Location maps can be as simple as a city street map, or as complex as a world political map.
- Reference map: A reference map is any map that provides general information about the geographic area being mapped. Reference maps typically include things like coastlines, country boundaries, and major cities.
- Thematic map: A thematic map is any map that focuses on a particular theme or subject area. Thematic maps can be used to show a variety of information, such as demographic data, climate data, or economic data.
- Topographic map: A topographic map is any mapping that shows the three-dimensional surface of the earth. Topographic maps typically include contour lines to show changes in elevation, and may also include symbols to represent other features like roads, trails, and bodies of water.
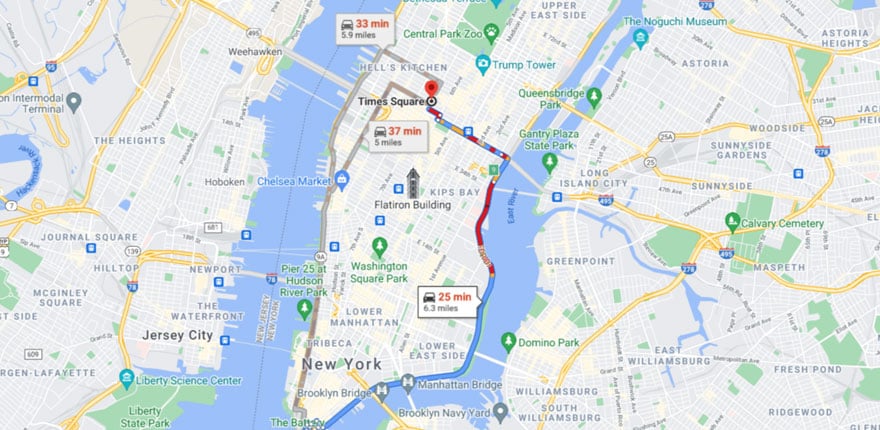
- Road map : A road map is any mapping that focuses on the network of roads and highways in an area. Road maps typically include things like cities, towns, and major intersections.
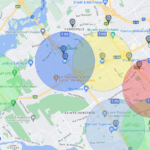
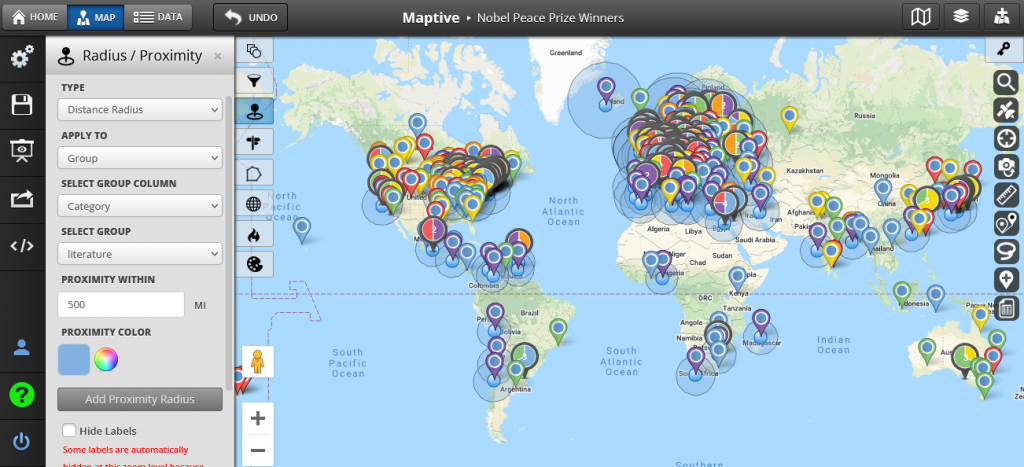
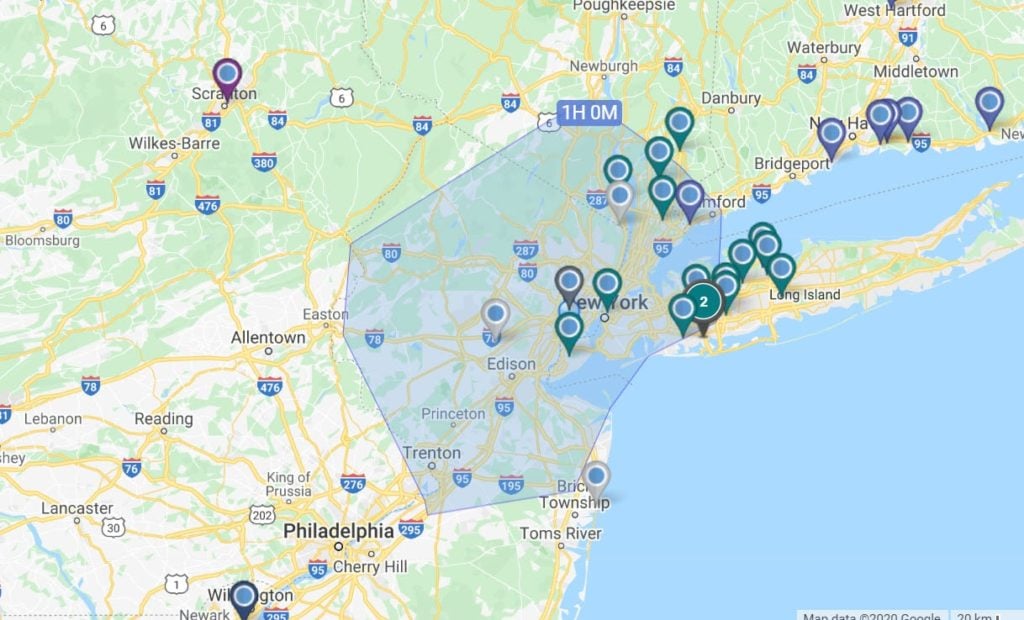
- Distance ring map: A distance ring map is any thematic map where concentric circles are used to show the distance from a central point. Distance ring maps are often used to show the reach of a particular service or to find locations that are within a certain distance of a point of interest.
- Graduated symbol map: A graduated symbol map is any thematic map where the mapping variable is represented by symbols that are sized according to the magnitude of that variable. The symbols are usually graduated, meaning that they get larger or smaller as the magnitude of the variable increases or decreases.


Mapping Terms
- Zip code: A zip code is a type of postal code used in the United States. Zip codes are made up of five digits and are used to designate specific areas within the US.
- Coordinate System: A coordinate system is a system that is used to define the positions of things in space. The most common type of coordinate system is the latitude/longitude system, which is used to define positions on the earth’s surface.
- Longitude: Longitude is a measure of east-west position on the earth’s surface. Longitude is measured in degrees, with 0° being the Prime Meridian and 180° being the International Date Line.
- Latitude: Latitude is a measure of north-south position on the earth’s surface. Latitude is measured in degrees, with 0° being the Equator and 90° being the North or South Pole.
- Contour line: A contour line is a line on a map that shows the location of a particular place or thing. Contour lines are often used to show elevation changes and may also be used to show other features like roads, trails, and bodies of water.
- GIS: GIS is an acronym for “geographic information system.” A GIS is a system that is used to store, manipulate, and analyze geographic data.
- Map scale: The map scale is the ratio between the size of something on a map and the size of that same thing in the real world. Map scales are typically expressed as a ratio, such as 1:10,000, or as a verbal description, such as “one inch equals one mile.”
- Cartography: Cartography is the art and science of making maps. Cartographers use a variety of mapping techniques to create maps that are both accurate and visually appealing.
- Geotagging: Geotagging is the process of adding geographical information to a digital file. Geotagged files can be used to show the location of things like photos, websites, or tweets.
- Geocoding: Geocoding is the process of converting addresses into geographic coordinates. Geocoded data can be used for mapping and analysis.
- Map Legend: A map legend is a key used to interpret a map’s symbols. Map legends typically include a description of the symbols as well as their meaning.
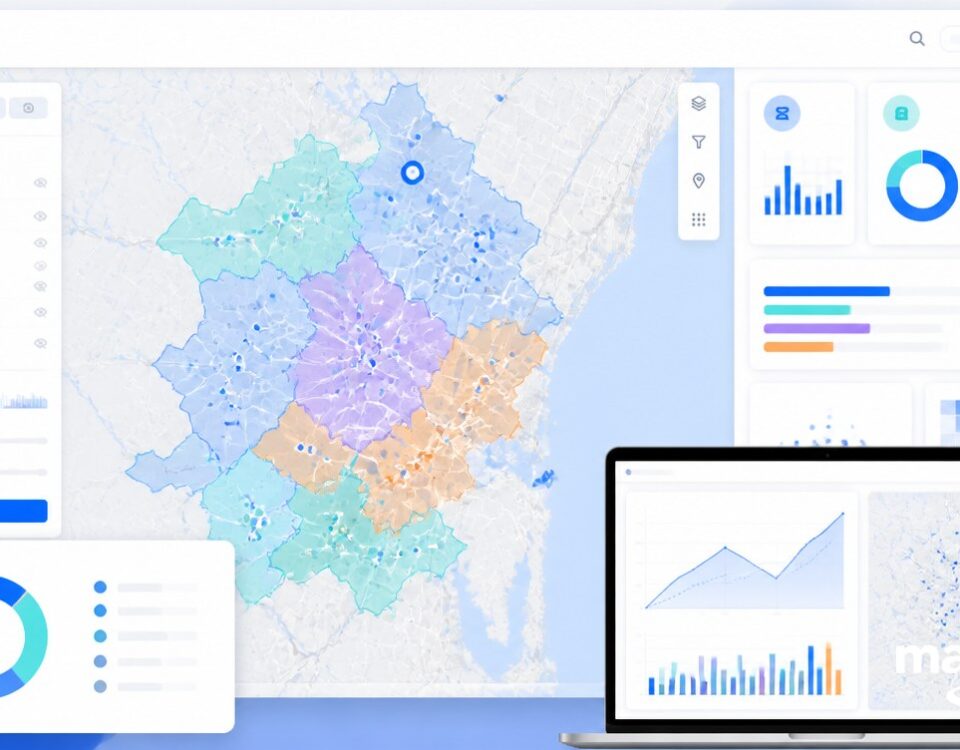
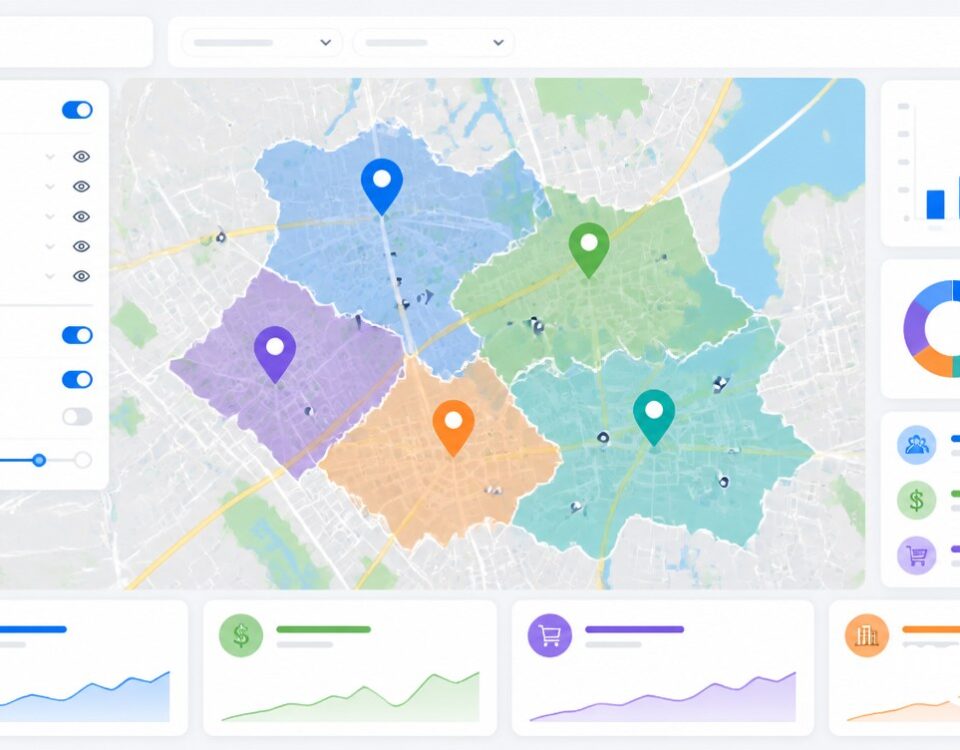
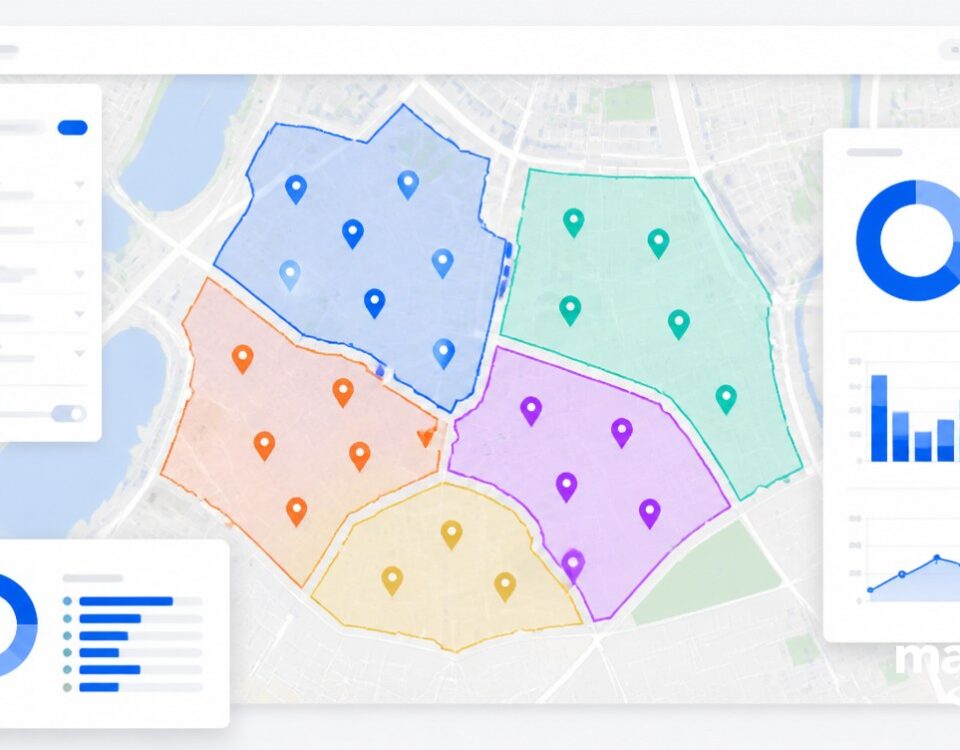
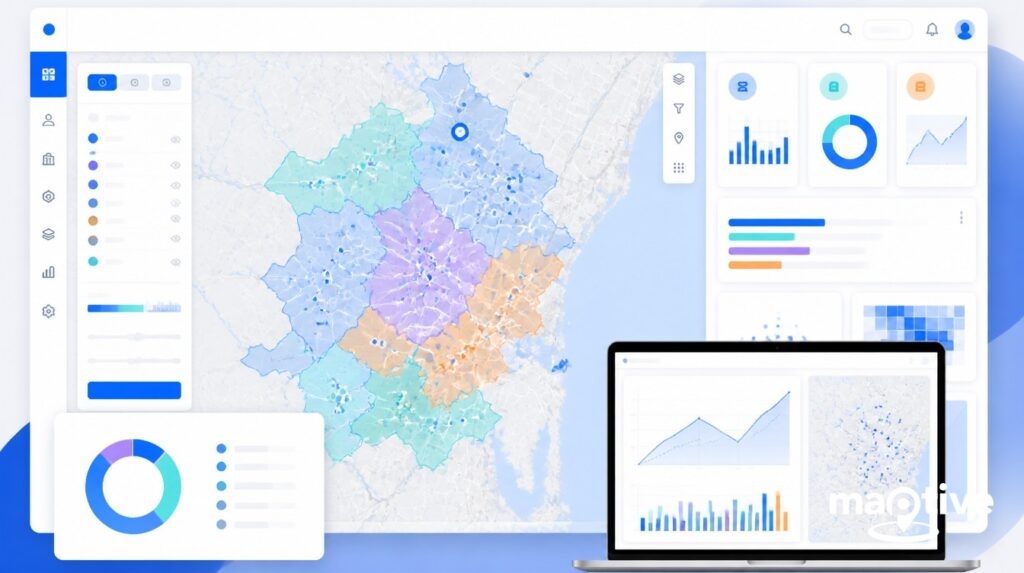
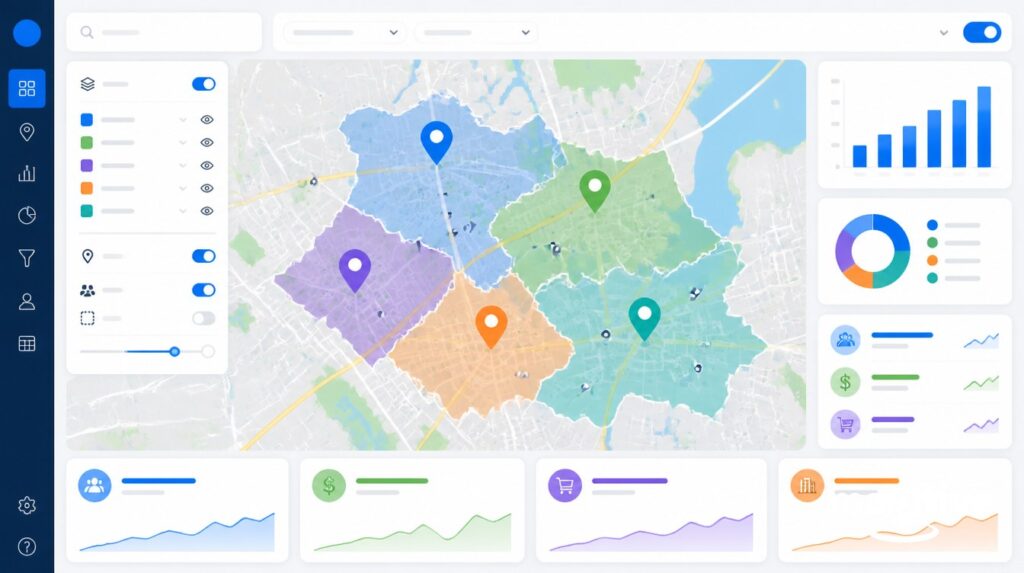
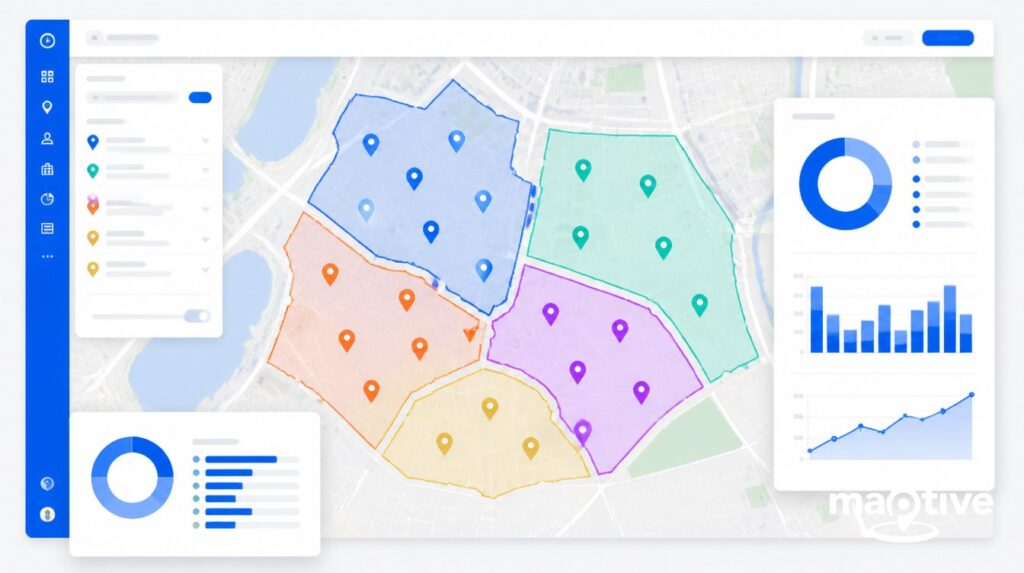
- Catchment Area Analysis: A catchment area analysis is a type of mapping used to identify the areas most likely to be served by a particular service or facility. Catchment area analyses are often used to plan the placement of new facilities or to assess the need for new services.
- Map Layers: Map layers are layers of data that are used to create a map. Layers can include things like roads, rivers, and political boundaries.
- Base Map: A base map is a map that shows the basic features of an area, such as roads, rivers, and political boundaries. Base maps are often used as a starting point for creating more detailed maps.
- Raster data: Raster data is a type of mapping data that is made up of pixels. Raster data is often used to show things like satellite images or DEMs.
- Vector data: Vector data is a type of mapping data that is made up of points, lines, and polygons. Vector data is often used to show things like roads, rivers, and political boundaries.
- GPS: GPS is an acronym for “global positioning system.” GPS is a satellite-based navigation system that can be used to determine the location of things on the earth’s surface.
- Great circle: A great circle is a line on the earth’s surface that evenly divides the earth into two hemispheres. Great circles are often used to show the shortest route between two points.
- Boundary Line: A boundary line is a line that marks the edge of an area. Boundary lines are often used to show things like political boundaries or property lines.
- Disaggregation: Disaggregation is the process of breaking down data into smaller units. Disaggregation can be used to create more detailed maps, or to analyze data at a more granular level.
- Map Symbols: Map symbols are symbols that are used to represent things on a map. Map symbols can be anything from simple shapes to complex images.
- Callout line: A callout line is a line on a map that is used to point out a specific feature. Callout lines are often used to label things like cities or landmarks.
- Grid line: A grid line is a line on a map that is used to divide the map into sections. Grid lines are often used to help people find specific features on a map.
- Tract: A tract is a unit of land that is used for mapping purposes. Tracts are often used to show things like census data or property boundaries.
- Overlay: An overlay is a map that is placed over another map. Overlays are often used to show things like political boundaries or topographic features.
- Scale Bar: A scale bar is a line on a map that is used to measure distance. Scale bars are often used to help people estimate the size of features on a map.
- Buffer: A buffer is a zone of land that is used to protect a feature from development. Buffers are often used to protect things like wetlands or wildlife habitat.
- Aerial photo: An aerial photo is a photograph that is taken from an airplane or other aircraft. Aerial photos are often used to show things like topographic features or land use.
Map Projections
- Map projections: A map projection is a way of representing the surface of the earth on a flat map. There are many types of map projections, each with its own strengths and weaknesses.
- Equal area projection- An equal-area projection is a type of map projection that preserves the area of features on the map. Equal area projections are often used for mapping things like population density.
- Conic projection: A conic projection is a map projection often used for mapping large areas. Conic projections are named for the fact that they often look like cones.
- Mercator projection: A Mercator projection is a map projection often used to map the earth’s surface. Mercator projections are named for the fact that they often look like mercator grids.
- Polar projection: A polar projection is a type of map projection that is often used for mapping the earth’s poles. Polar projections are named for the fact that they often look like polar coordinate grids.
- UTM projection: A UTM projection is a map projection often used for mapping large areas. UTM projections are named for the fact that they are based on the Universal Transverse Mercator grid.
- Thiessen polygon: A Thiessen polygon is a type of mapping used to identify the areas most likely to be served by a particular service or facility. Thiessen polygons are named for the fact that they are based on the Voronoi diagram.


