


Franchise Cannibalization Analysis From Customer-Origin Data
Before you add or acquire a unit, map where your clientele live to gauge how much a new site would take from the units you own. Maptive plots every customer.
No credit card required
- Plot the home address or ZIP of every customer, up to 200,000
- Build a clientele heat map that reveals each unit's real draw area
- Color each pin by the unit it belongs to with the Grouping Tool
- Drop a distance radius and a drive-time polygon on a candidate site
- Overlay US and Canada census data to find the holes in your market
- Share the overlap map view-only or password-protected with a partner
Trusted by teams at









Customer Overlap in Summary
Mapping customer origins before adding a unit cuts sales taken from existing owners by 28%.
Testing overlap first drops openings that hurt a neighboring unit by about 24%.
Seeing the customer draw on a map speeds the add-a-unit decision by 33%.
Reading Where Your Clientele Come From
| 01 |
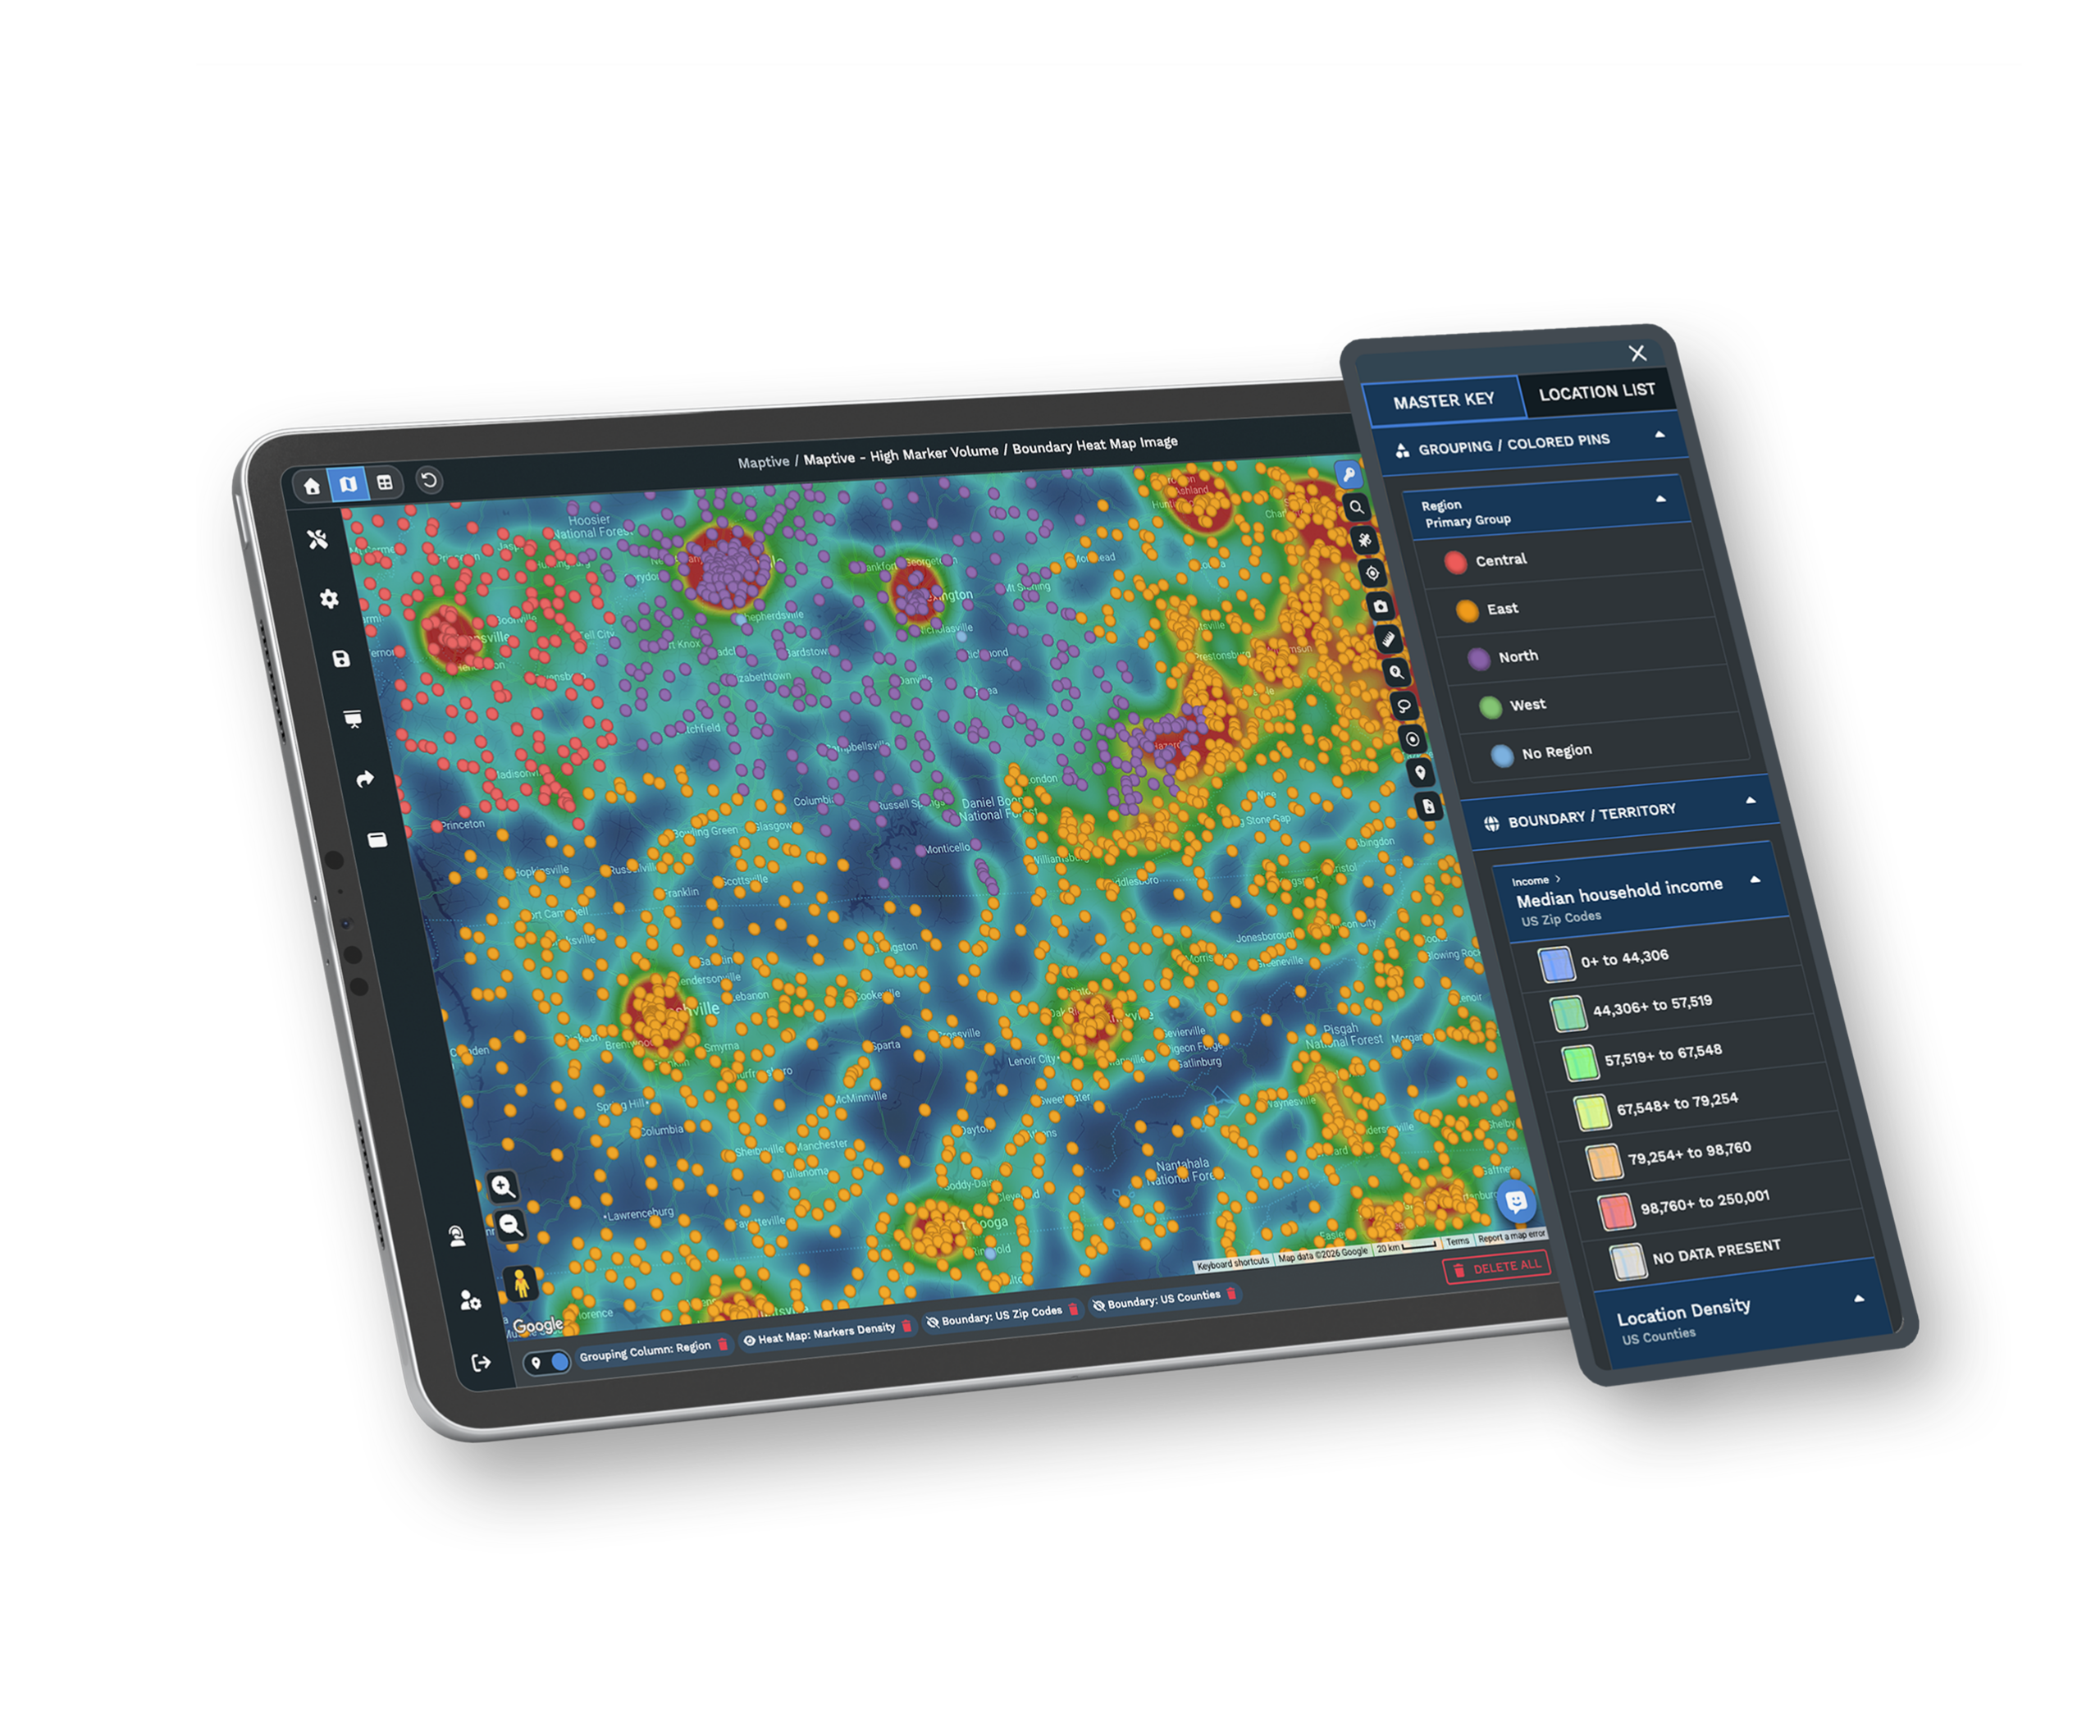
A Clientele Heat Map From Your Own RecordsThe Heat Mapping Tool colors the map by the density of where your customers live, so you see each unit's real, revealed draw area instead of a drawn circle. Two units whose heat blends into one warm zone already share the same neighborhoods. Explore the heat mapping tool → |
| 02 |
Colored Pins Tying Each Customer to a UnitImport your customer file and use the Grouping Tool to color each pin by the unit it belongs to. Custom markers separate one location's clientele from another, so the streets where two units already compete for the same people are easy to pick out. Explore the grouping tool → |
| 03 |
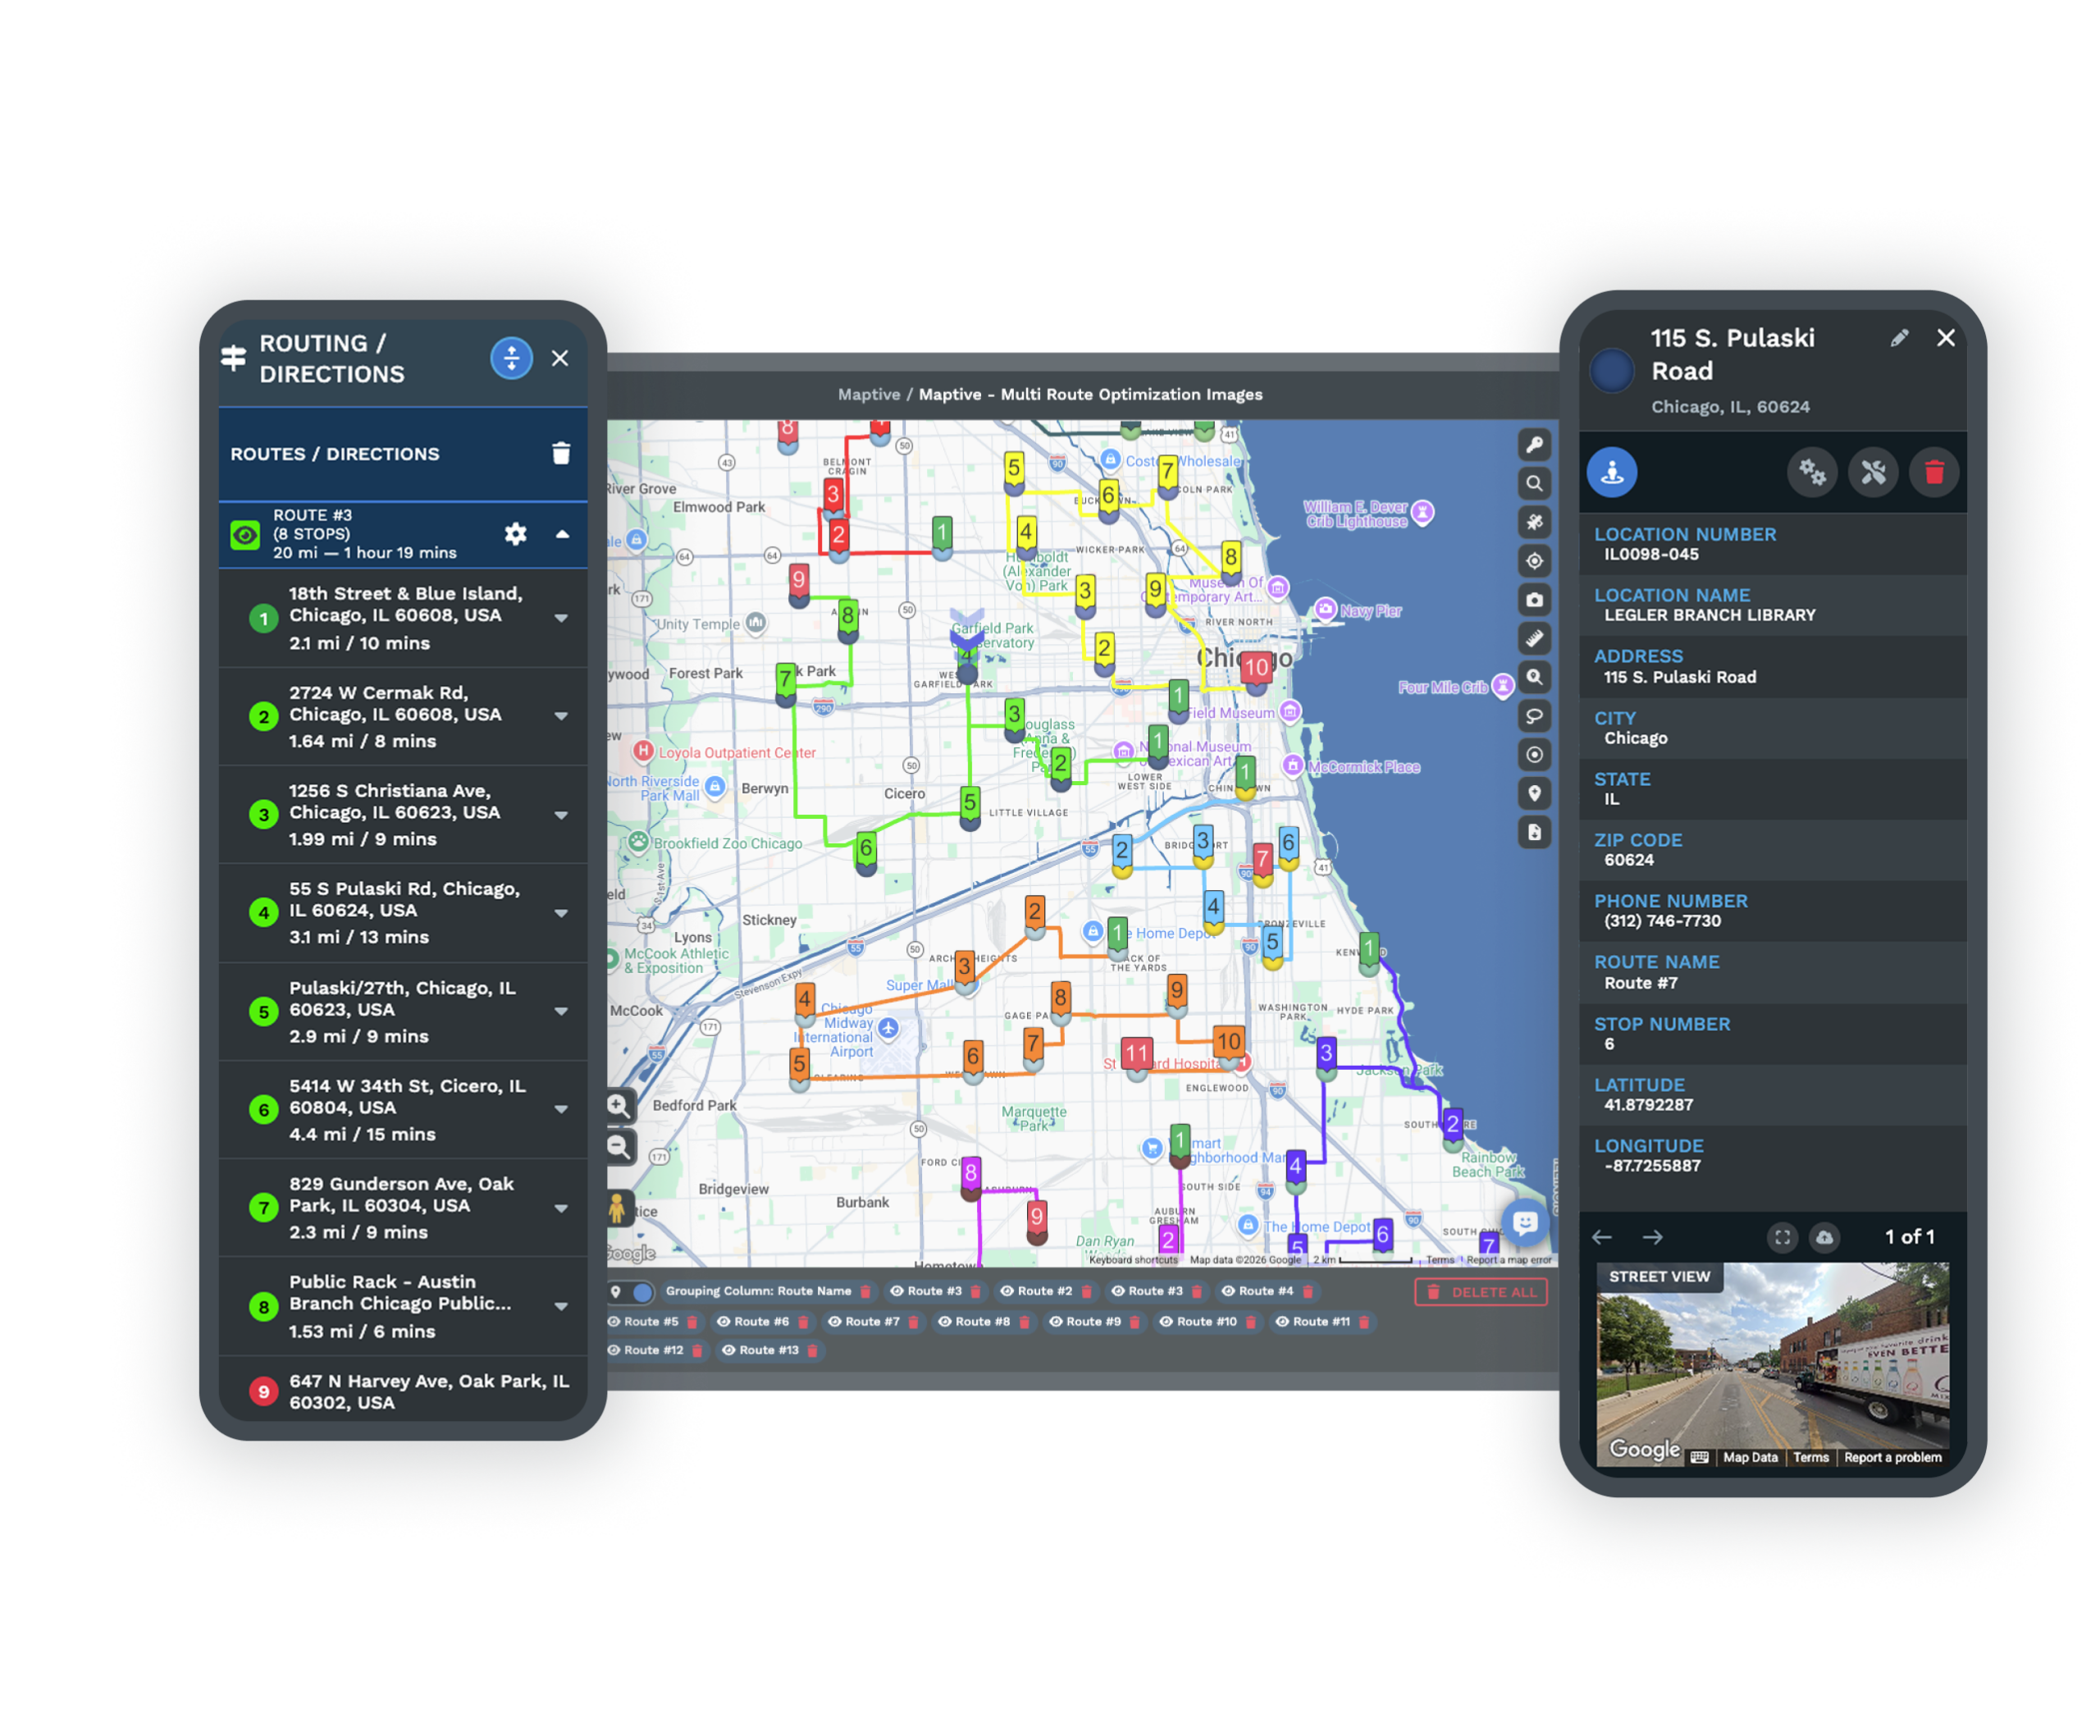
Radius and Drive-Time Reads on a Proposed SiteDrop a Distance Radius circle around a candidate site with the Proximity Within setting, then draw a Drive Time Polygon along the real roads. Comparing the fixed-mileage view to the road-based one shows how much of an existing unit's clientele the new site would sit on top of. Explore drive-time polygons → |
| 04 |
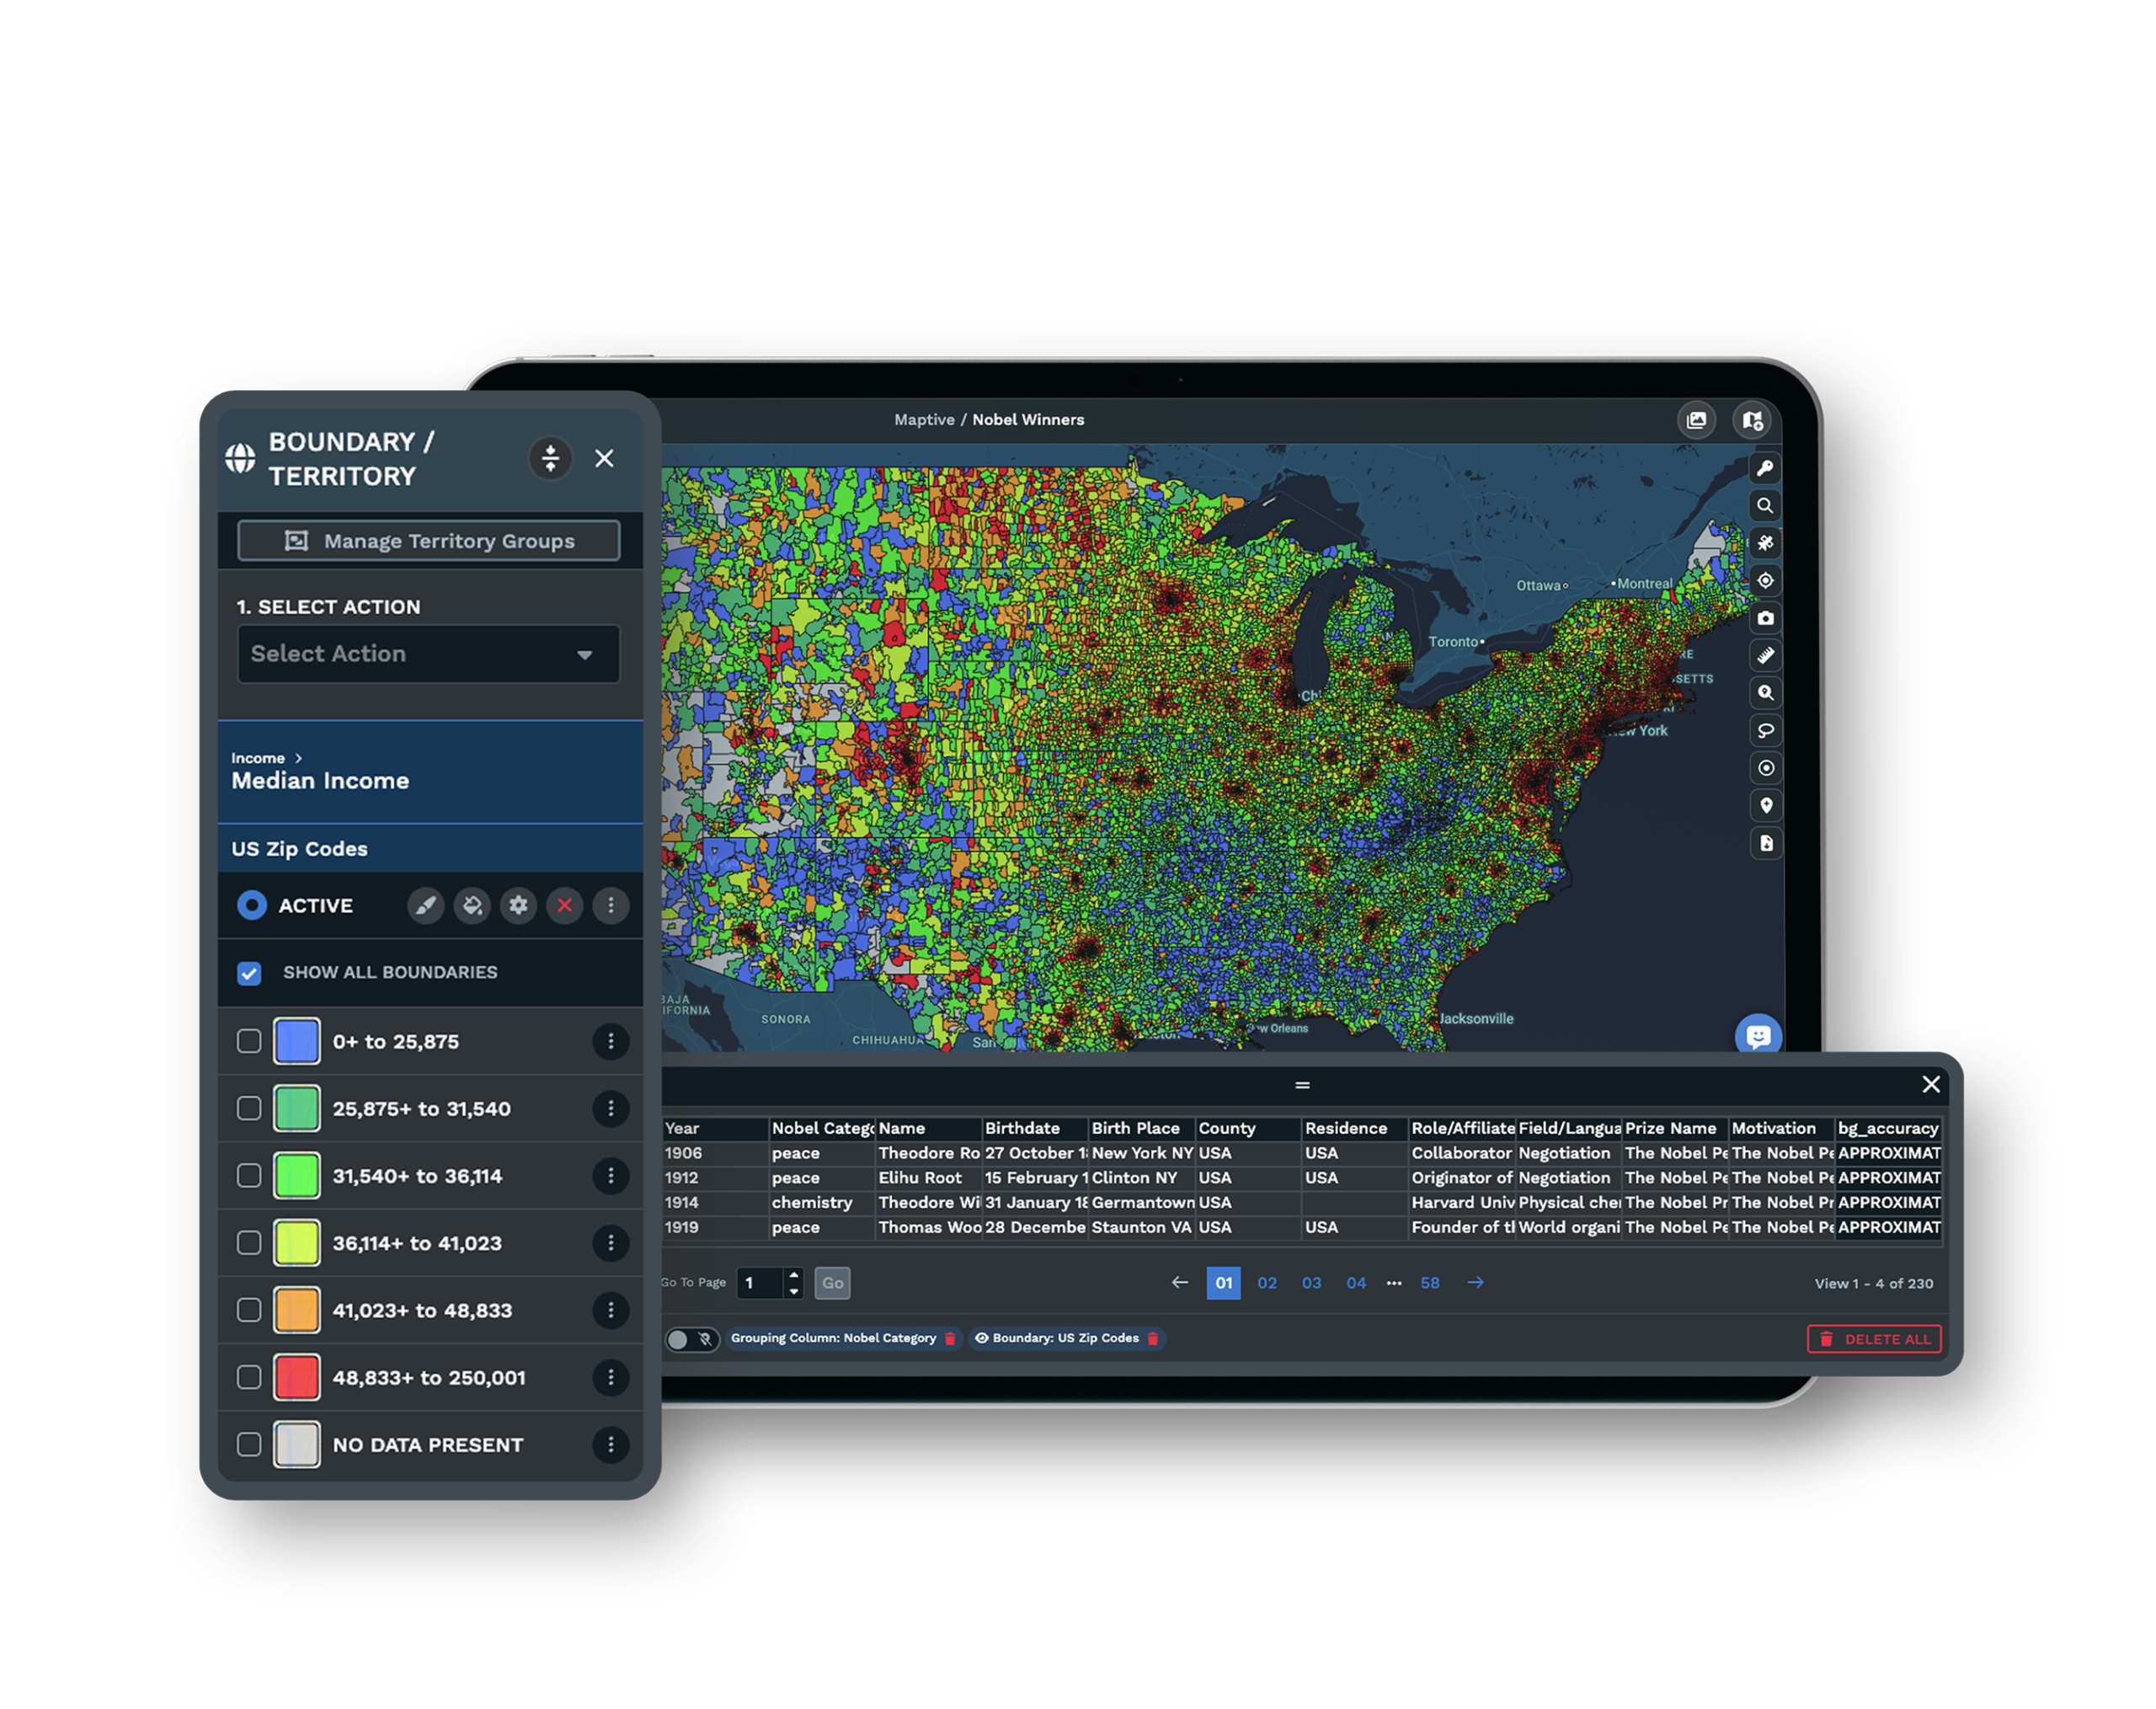
Demographic Overlays Over the Holes in Your MarketOverlay your customer-origin pins with US and Canada census data to find ZIP or postal codes full of your target customers that no current unit reaches. Those underserved gaps are where an add brings net-new revenue instead of transferred sales. |
Customer-Origin Data Over a Drawn Circle
When you weigh a new unit, the question underneath every projection is simple, does it bring new customers or move existing ones a few miles down the road. A drawn radius guesses at a trade area, but the map of where your clientele live shows the real one. Plot those home locations by unit and the overlap stops being a hunch. You can see the streets two units already draw from, and you can see how far a candidate site would reach into another owner's clientele.
The number operators reason with is the cannibalization rate, roughly sales lost by the existing unit divided by its sales before the opening. Maptive does not compute that rate or output a report, but it shows you the customer overlap the rate is built on, which is the part you cannot eyeball.
Adding a Unit Versus Acquiring One
An acquisition changes the read but not the method. When you buy an established unit near locations you already own, map the target's customer origins against your existing clientele before you underwrite the deal. If the two customer bases sit on the same neighborhoods, part of the target's revenue is revenue you may already capture, so you would be paying for sales you would partly transfer to yourself.
A greenfield add carries the same test in reverse. You want the candidate site to land where your heat map is thin and demographic demand is strong, since a defensive add that blocks a competitor can still earn its place even when it trims one unit. The decision rests on net incremental gain across the whole network, not on zero overlap.
Working With a Live Customer File
Import From the Systems You Already Use
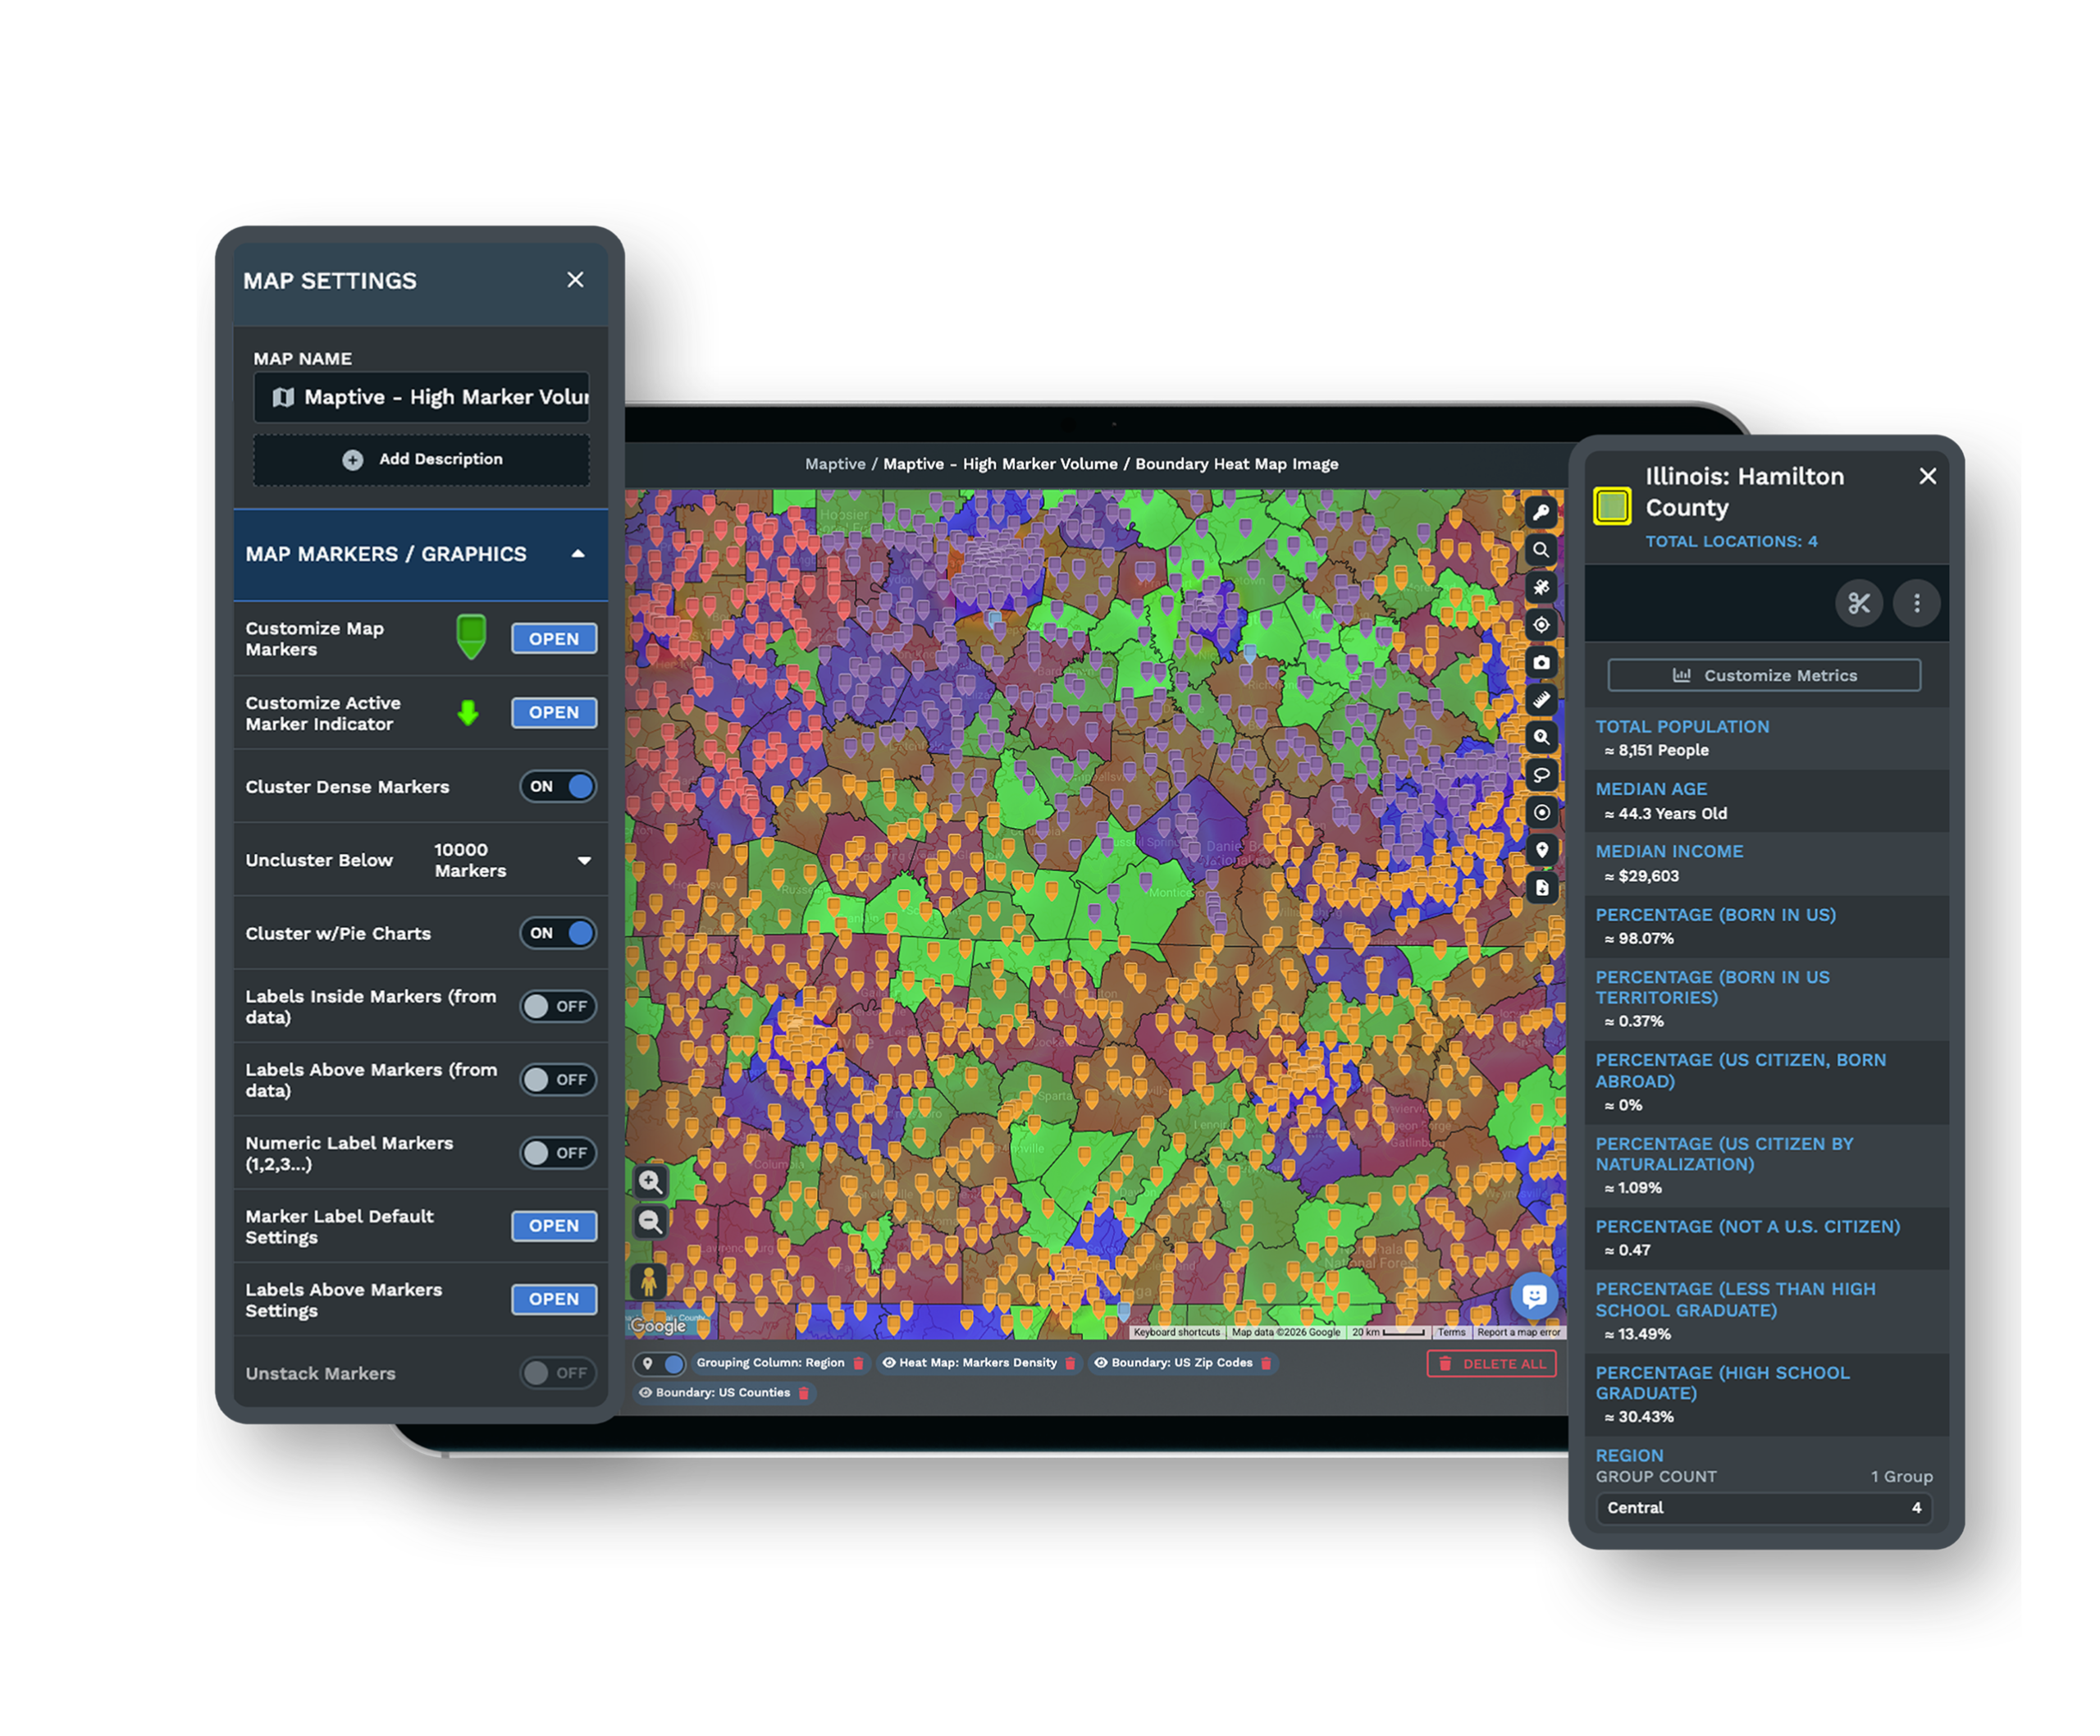
Bring your clientele straight from a CRM or point-of-sale export, dropped into Excel, CSV, TSV, or Google Sheets. Marker pop-ups then show each customer's data fields, so a single record can carry its unit, segment, and spend alongside its location.
Shared Overlap Maps With Controlled Access
Send the overlap map to a partner or a lender through a shared link, and set each person to view-only or edit. A public or password-protected view lets you present the cannibalization picture without handing over the underlying customer data.
See sharing options →A Support Team Behind Your First Analysis
A US and Canada support team answers in under 15 minutes at a 9.7 out of 10 rating, so a question about importing a messy customer file or reading the heat map gets a fast answer while a site decision is on the table.
Free trial with the full platform and no credit card
Map Your Customer Overlap
Start a 10-day free trial with no credit card and all 60+ tools open. Import your customer list, build a clientele heat map, drop a radius and a drive-time polygon on a candidate site, and read the overlap against the units you already run.
Bring a Site Decision to a Maptive Specialist
If an add or an acquisition runs through a partner or a real estate committee, a Maptive specialist will work the overlap with you. Bring your customer file and the site you are weighing, and the session builds the heat map, the trade areas, and the gap analysis in front of the people signing off.
Frequently Asked Questions
Will a new franchise cannibalize my existing locations?
It can, when the new unit's trade area overlaps an existing unit's, some current customers move to the new site and transfer sales instead of adding net-new revenue. Mapping where your customers already live against a candidate site shows how much overlap to expect before you commit.
Where do my current customers live versus each unit?
Plot your customer addresses or ZIP and postal codes on a map and color them by unit to see each location's real, revealed trade area rather than a drawn circle. The pattern shows which neighborhoods each unit draws from and where two units already share the same customers.
What is a customer heat map and how does it help?
A customer heat map colors the map by the density of where your clientele live, so you can see where each unit concentrates and where two units' draw areas overlap. Overlapping heat around a candidate site is a visual warning of likely revenue transfer, which is exactly the read you want before you commit to a location.
How do I find holes in my market for a new unit?
Overlay your customer-origin data with demographic data to find ZIP or postal codes full of your target customers where your units do not yet reach. Those underserved gaps are the white space where an add is more likely to bring net-new revenue instead of transferred sales, so a site in the gap beats one beside an existing unit.
What is incremental sales versus transferred sales?
Incremental sales are the net-new revenue a unit adds after subtracting the sales it takes from your existing units, calculated as estimated new-unit sales minus cannibalized sales. It is the figure that shows if an add grows the network or only moves revenue between locations you already own.
What is an acceptable cannibalization rate?
Retail consensus treats roughly 10 to 20 percent as acceptable for a new opening and above 20 percent as high, since a high rate means much of the new unit's sales come at the expense of nearby units. The right threshold varies by concept and strategy, so the band is a guide rather than a fixed cutoff.
How do I evaluate cannibalization before acquiring an existing unit?
Map the target unit's customer origins against your existing clientele. If the two customer bases overlap heavily, part of the target's revenue is sales you may already capture, so you would be paying for revenue you would partly transfer to yourself. A thin overlap points to a cleaner acquisition.
What data do I need to map where my customers come from?
Customer addresses, ZIP or postal codes, sales or loyalty records, booking systems, or shipping records, usually exported from your CRM or point-of-sale into a spreadsheet. A mapping tool ingests that file and plots each customer's home location, so the quality of the read depends on how complete the address data is.
Is some cannibalization ever acceptable?
Yes. A defensive add can block a competitor or improve total network coverage even if it trims one unit, so the decision is about net incremental gain and total network revenue, not zero overlap. Some operators accept a modest hit to one location to hold a market they would otherwise cede.








