Free Online Tool
GeoJSON to Excel Converter
Take a GeoJSON file and convert it into Excel. Drop your file and the converter turns each feature into a row in a clean .xlsx workbook, with every property as a column. It gives developers and analysts a shared place to read, sort, and chart the same data.
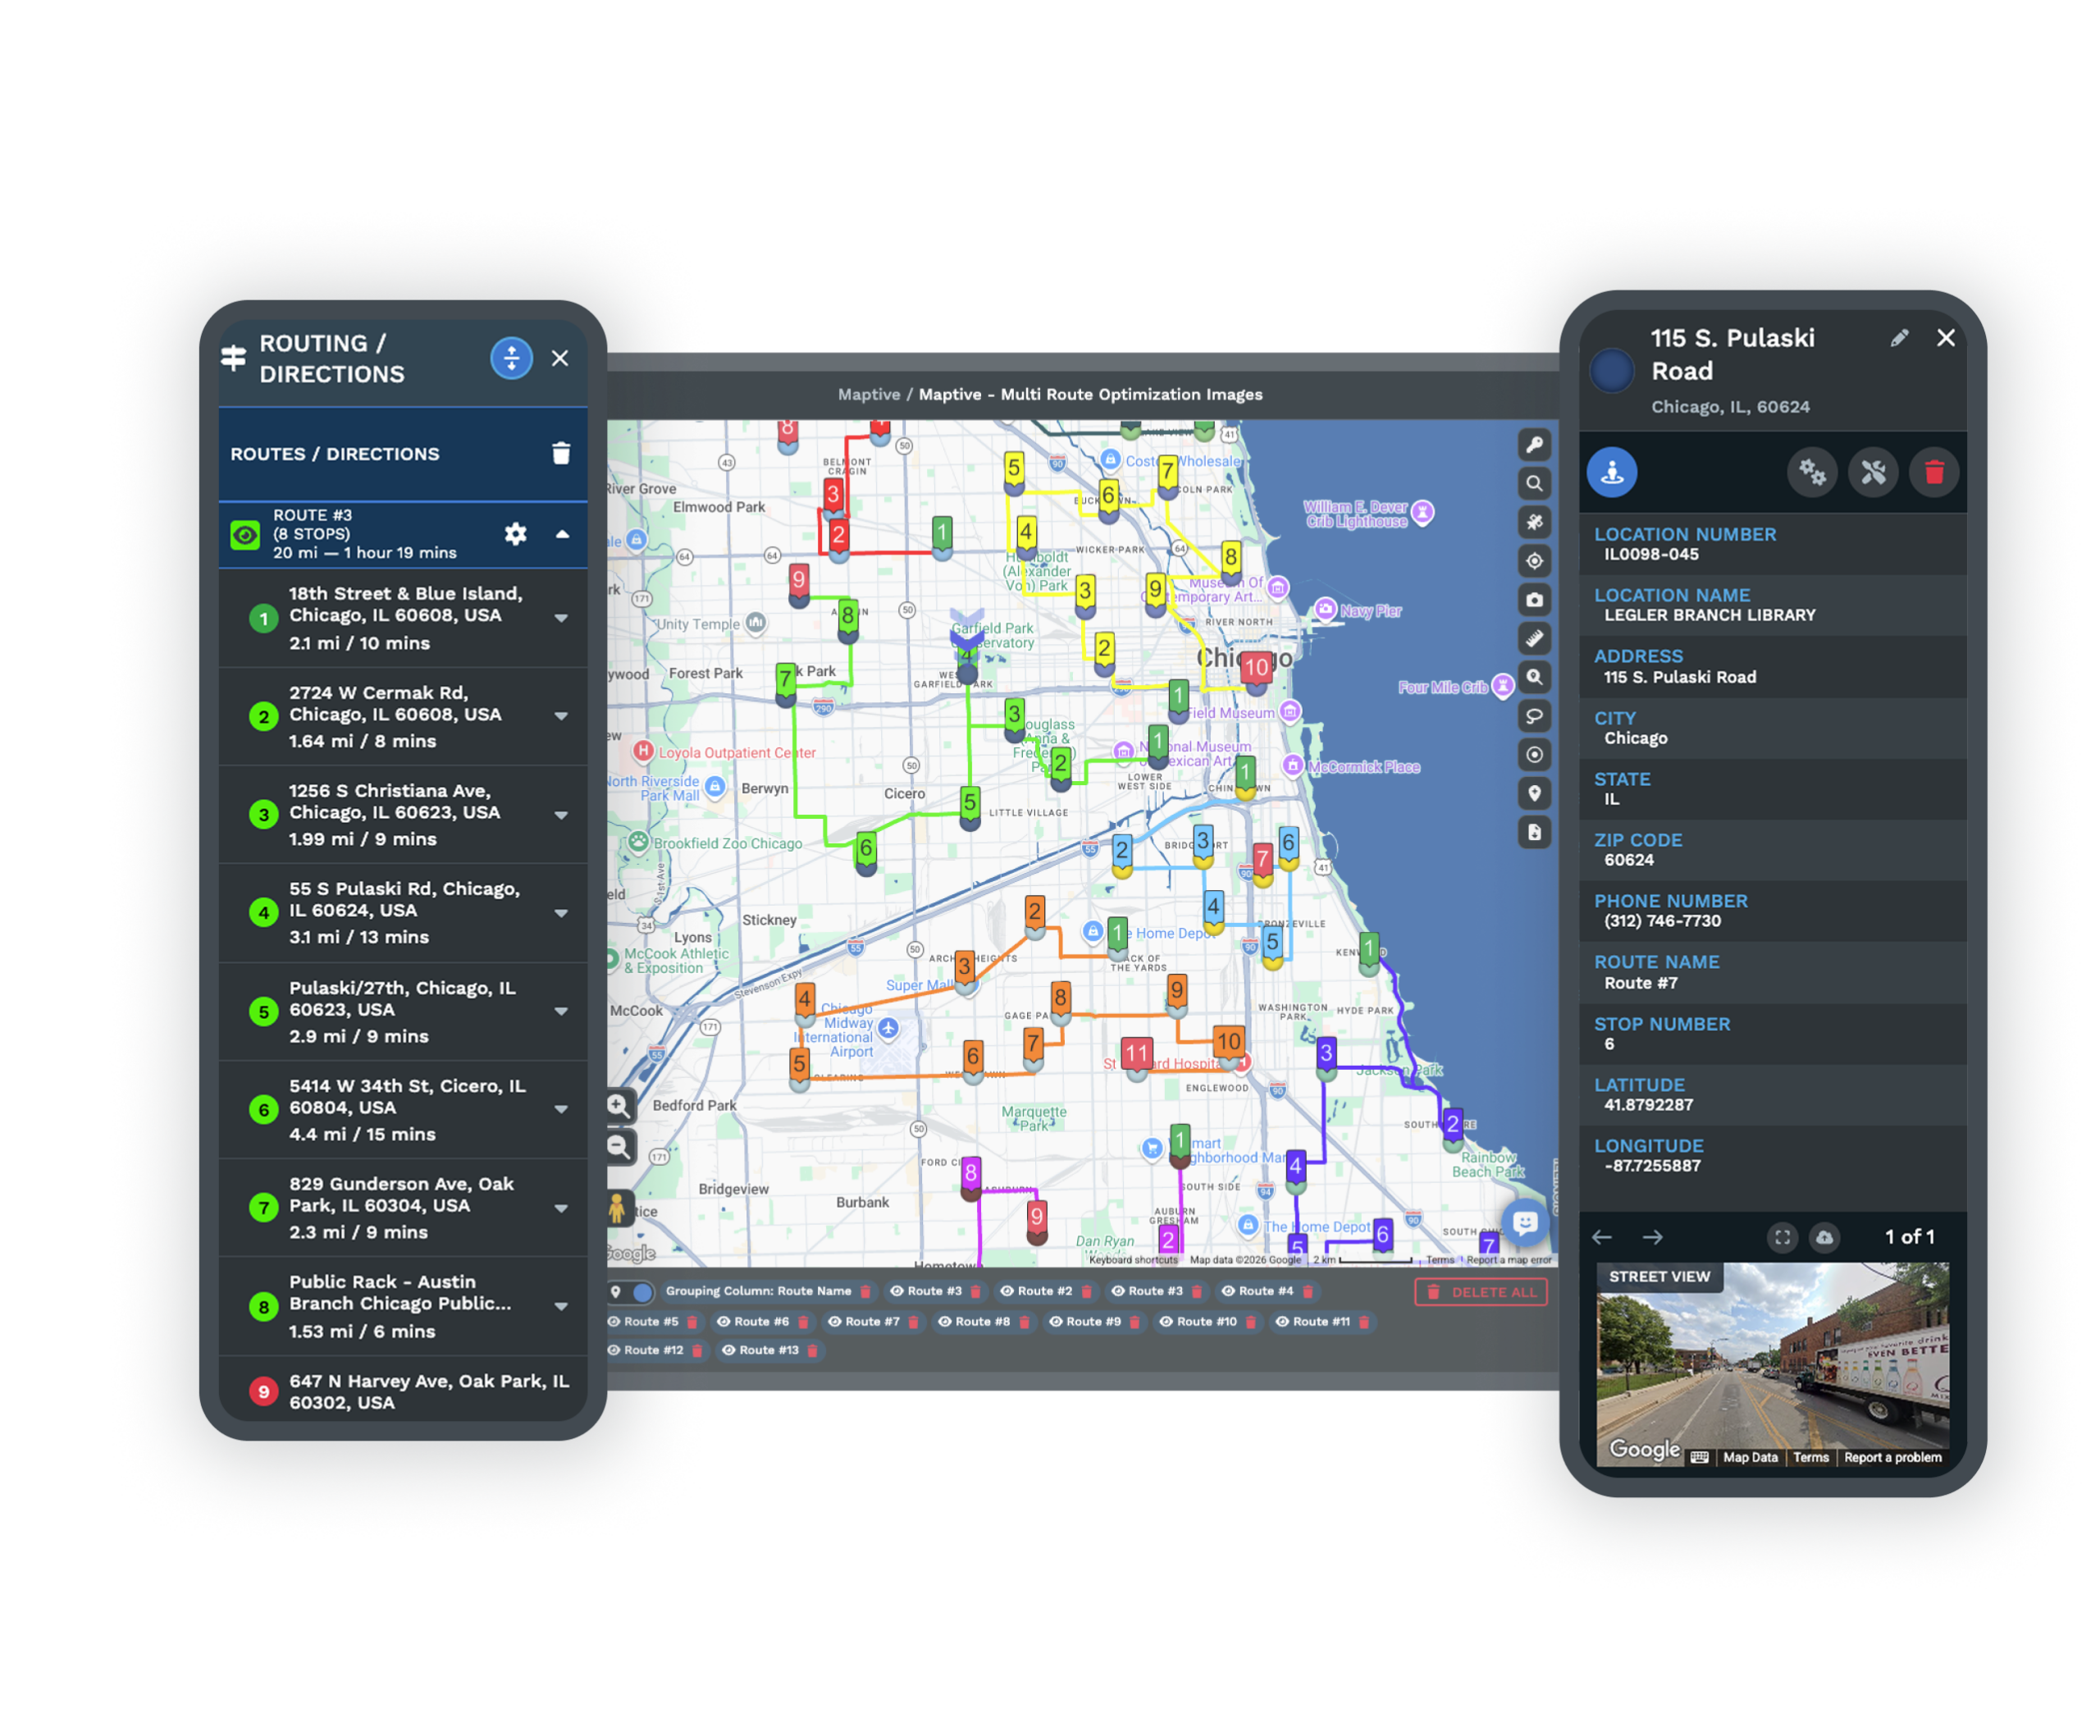
Want these locations on a live map instead? Maptive plots them in minutes.
Trusted by teams at


How it works
Three Steps From GeoJSON to Excel
The tool is free and there is nothing to download or install. Everything happens in the box at the top of this page.
Add your GeoJSON
Drop in the file or browse for it. Anything that follows the GeoJSON standard, from an API or a GIS export, works.
Build the workbook
A click reads every feature and writes a true .xlsx in your browser, each feature a row and each property a column.
Open it in Excel
Download the workbook and dive in with Microsoft Excel, Google Sheets, or Numbers.
Before and after
From a Feature Collection to a Workbook
A GeoJSON feature buries its details inside braces meant for code. The converter lifts them out and arranges them as a spreadsheet ready for real analysis.
{
  "type": "Feature",
  "properties": { "name": "Denver HQ" },
  "geometry": {
    "type": "Point",
    "coordinates": [-104.99, 39.73]
  }
}
| Name | Latitude | Longitude |
|---|---|---|
| Denver HQ | 39.73 | -104.99 |
| Austin Branch | 30.27 | -97.74 |
| Chicago Store | 41.88 | -87.63 |
There is more under the hood. Your workbook adds a column for every property your features carry, plus Latitude, Longitude, a Geometry label, and a WKT column for the full shape.
Why convert
Why Move GeoJSON Into Excel
Developers speak GeoJSON. Analysts and managers speak Excel. A workbook turns a feed meant for code into something a whole team can sort, total, and chart. When it is time to visualize again, Maptive maps the data straight from the file.
Hand developers and analysts one file
An .xlsx is the meeting point where the people who fetch the data and the people who interpret it can finally look at the same thing.
Calculate across your features
With each feature on a row, sums, averages, and lookups all work, turning a raw feed into figures you can act on.
Summarize with pivot tables
Group thousands of features by a property in seconds and let a pivot table surface the patterns in the feed.
Chart it for a report
A property column becomes a chart with a couple of clicks, so a GeoJSON export can headline a slide deck.
Format and annotate
Color a status, freeze the headers, add a notes column. A workbook can be dressed up in ways raw JSON never allows.
Bring shapes along too
Lines and polygons convert beside your points, each with a geometry label and the full outline stored as WKT.
Built On Your Machine
Both the parsing and the workbook creation run inside your browser on your own copy of the file. Nothing is uploaded and nothing is kept once you navigate away, which keeps a proprietary feed or a private dataset off any server. With no round trip, the .xlsx appears at once, and you can convert file after file without paying anything.
The difference
GeoJSON Compared to Excel
One is the language web maps trade in. The other is where people sit down to actually work the numbers.
GeoJSON
- The common language of web mapping
- Stores features as geometry plus properties
- Passed between APIs, code, and map libraries
- Readable by machines more than by people
Excel
- A native Excel workbook in .xlsx
- Columns you can format and total
- Built for pivots, charts, and reports
- Opens in Excel, Google Sheets, and Numbers
Next step
Put Your Locations Back on a Live Map
Once the analysis is done, show it on a map. Import the workbook into Maptive and use these.
Heat Mapping Tool
Weight your features by any value in the sheet and let the dense areas glow, turning a column of numbers into a clear picture.
Explore →Demographic Overlays
Lay US and Canada census data behind your points to judge the market around each one, right alongside your own figures.
Explore →Territory Map Maker
Group the mapped features into balanced territories, working from the very data you just analyzed in the workbook.
Explore →Free trial with the full platform and no credit card
Turn the Analysis Into a Map
Excel is where the feed becomes findings, and Maptive is where the findings become a map. The ten-day trial opens everything, so you can import your workbook, weight a heat map, overlay demographics, and build territories. No credit card to get going.
FAQ
Frequently Asked Questions
How do I convert a GeoJSON file to Excel?
Drop your GeoJSON onto the converter or browse to it and click convert. It reads each feature and assembles a real Excel workbook with a row per feature, then offers the .xlsx for download. It all runs in the browser in seconds.
Is the output a genuine .xlsx?
Yes. It is a true Excel workbook, not a CSV with a swapped extension. The data sits on a real sheet with headers, so formulas, pivots, and charts work the moment you open it in Excel, Google Sheets, or Numbers.
What is GeoJSON, briefly?
It is a JSON format for geographic features, each combining a geometry with a bag of properties. APIs, web maps, and GIS tools use it heavily because it travels well between systems, even though it is hard to read by eye.
Any cost or account required?
None. Convert as many GeoJSON files as you need, free and without signing up. Maptive offers a ten-day trial for mapping the data, but this tool stands alone.
Does my file leave my computer?
No. The workbook is generated locally and the GeoJSON never goes to a server. When the page closes, nothing is left behind, so private data stays private.
How are the columns arranged?
One column per property found across your features, then Latitude, Longitude, a Geometry label, and a WKT column for the full shape. Blank cells fill in wherever a feature lacks a property.
Will it accept files from any source?
Yes, provided they follow the GeoJSON standard. A FeatureCollection or a lone feature from an API, a web map, or a GIS export all convert identically.
Does it keep every property?
It does. Each property becomes its own column, so the attributes attached to a feature stay lined up with its coordinates in the workbook.
Can I visualize the workbook on a map?
Yes. Import it into Maptive and each row becomes a marker you can weight, overlay with demographics, group into territories, and share.

