
Mapping out sales territories is not only about drawing lines on a map. The success of a sales team depends on how well accounts and areas are split between people. When territories are unbalanced, some sales representatives get overwhelmed, while others do not have enough contacts to meet targets. Using data about who lives where and how they live can help companies manage their territories.
Thank you for reading this post, don't forget to subscribe!Sales teams often look at location and geography first. But data about income levels, age ranges, and spending behavior can have more value than location alone. Maptive helps managers adjust their territories using both location and demographic traits, so the territories reflect real potential.
Using Demographic Data in Territory Planning
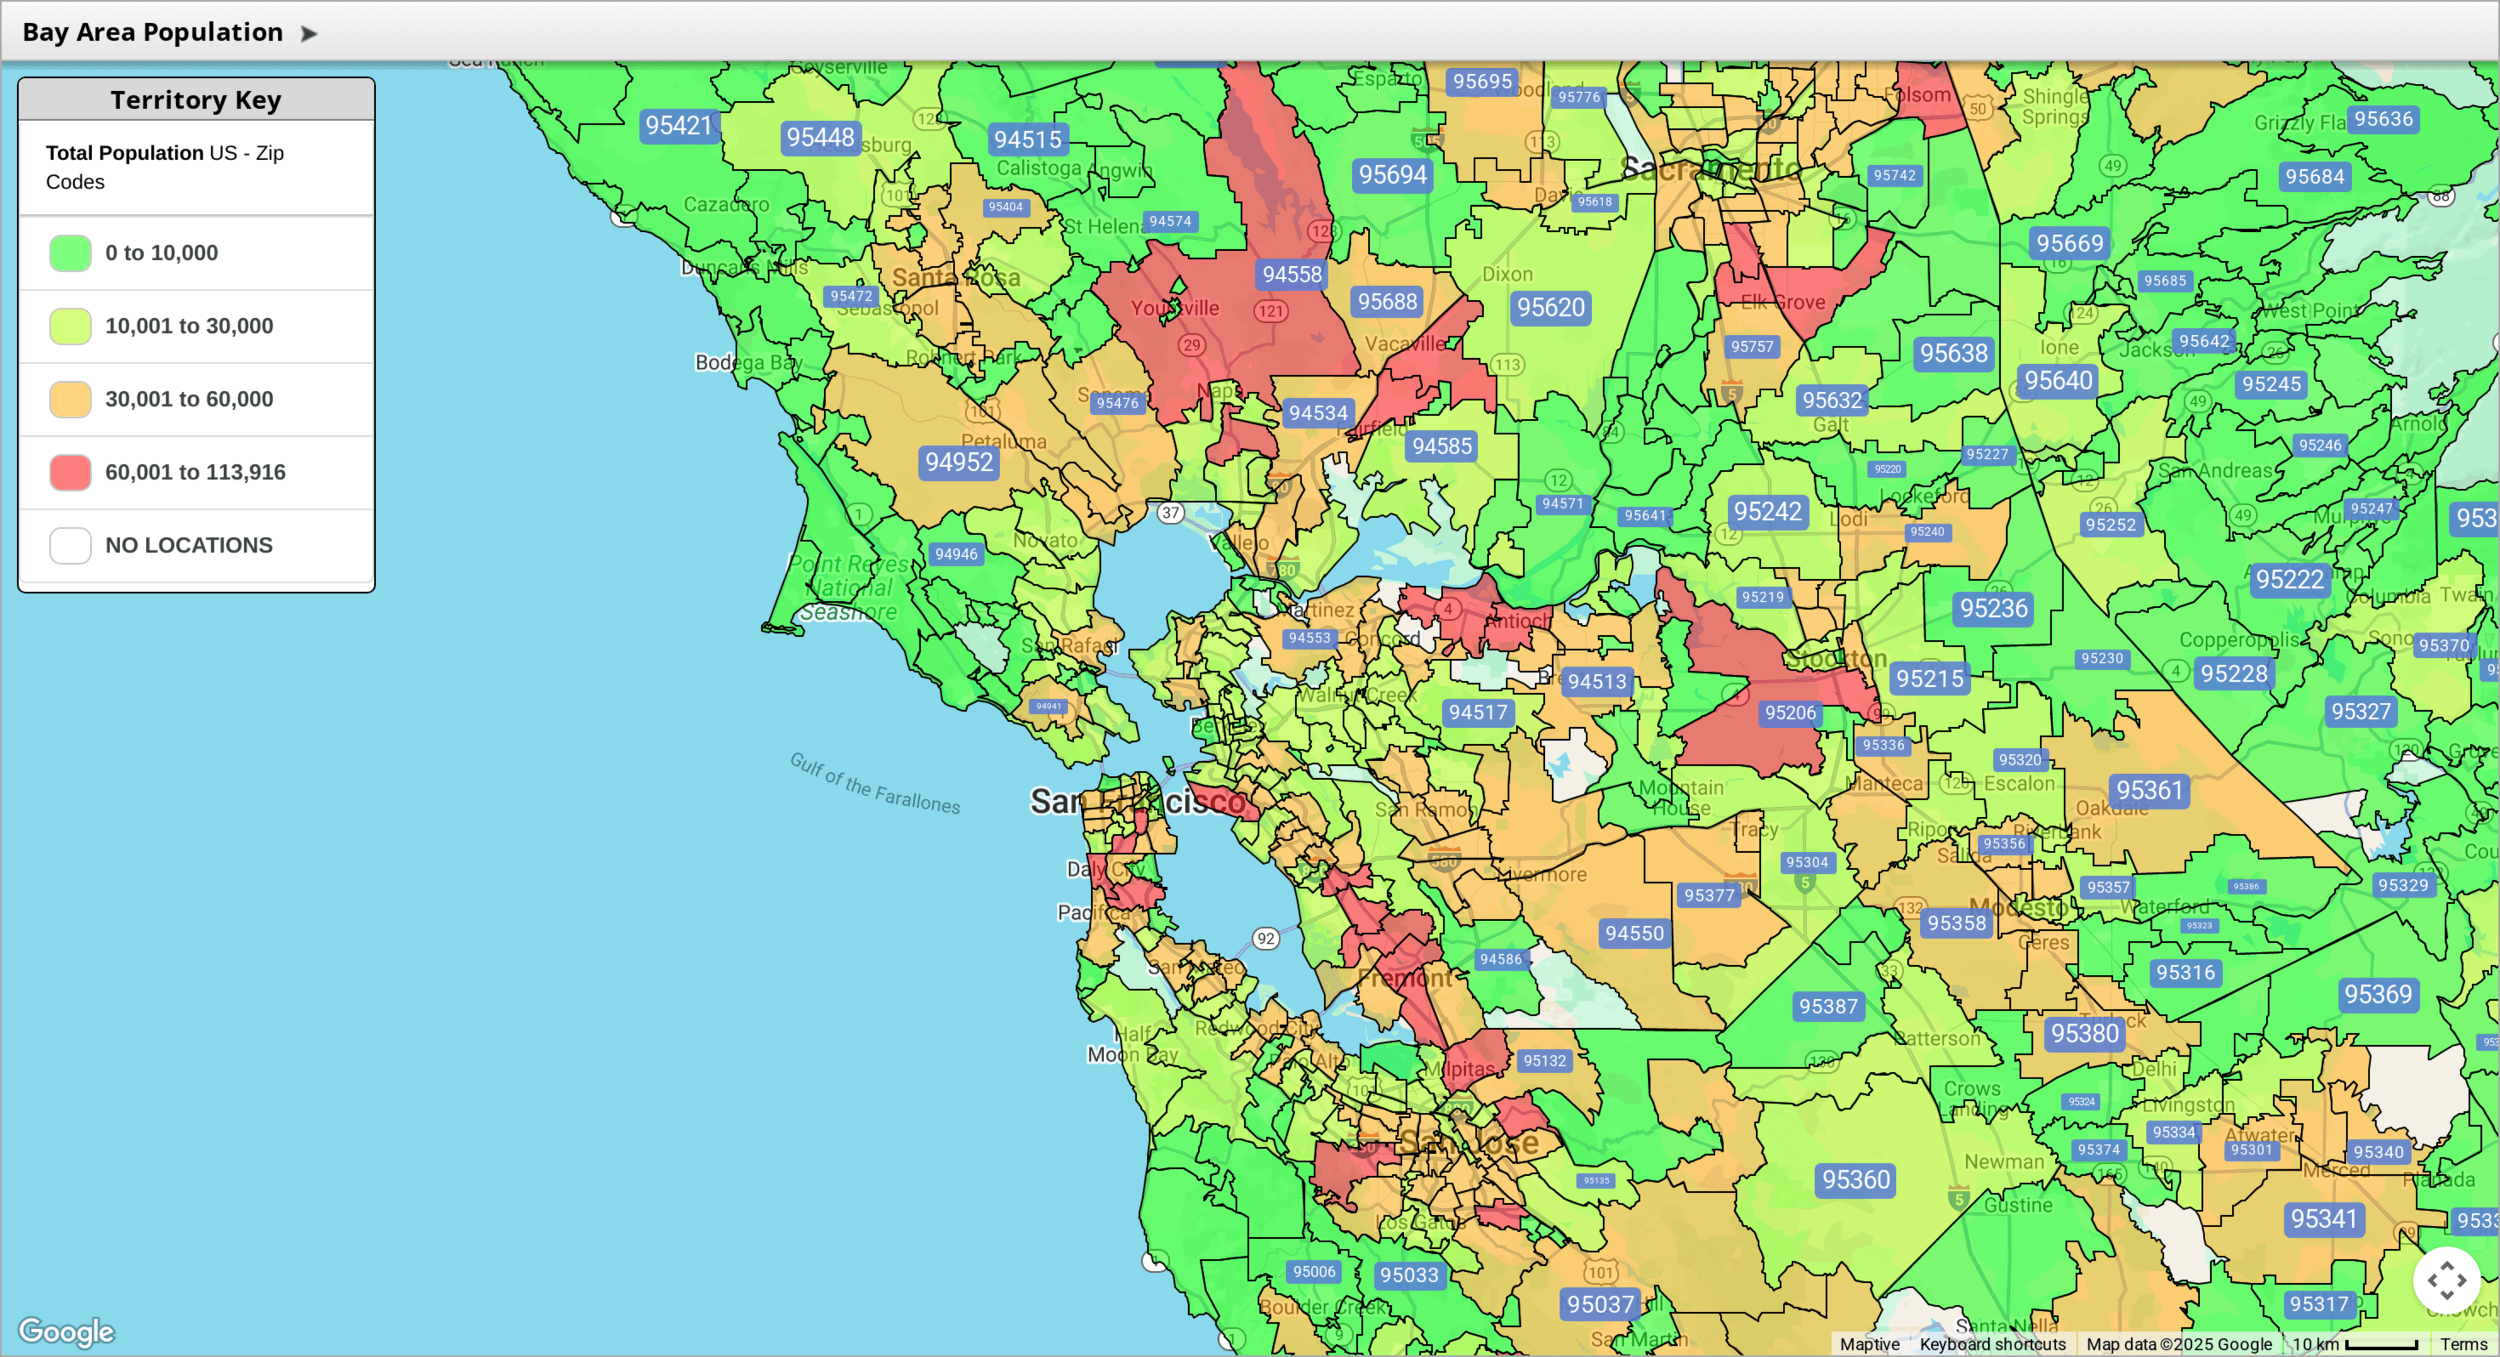
Data about people helps companies find patterns. For example, a team can look at average household income or the percentage of people in an age group within a zip code. If a product does well in high-income neighborhoods, those areas should be the focus for that sales team. Maptive lets you connect external demographic data, such as census figures, with your customer map. With these tools, you can quickly spot areas that are likely to have more high-value customers.
Education level is another factor. If a product or service is more popular with college graduates, then highlighting those regions allows a manager to create more targeted territories. Several businesses also use demographic data to avoid assigning too many accounts to one team member, leading to better outcomes.
Importing and Visualizing Sales Data
In many companies, data lives in spreadsheets. Maptive lets users import these lists straight from Excel or Google Sheets. The mapping tool then plots each location automatically. If your spreadsheet includes customer types or buying history, you can also show those on the map. By layering sales data on top of demographic data, you see how your current reach matches with high-potential markets.
For example, suppose a company sells home improvement products. The team can upload a list of all current customers, then overlay a map that shows average home values by neighborhood. Regions with both current customers and higher home values will then emerge, revealing where to focus efforts or assign more resources.
With Maptive, you can also organize customers by size, buying frequency, or industry, letting you weigh these factors as you plan assignments.
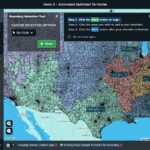
Drawing Balanced Territory Boundaries
To split territories fairly, it helps to use a tool that lets you draw borders by city, county, or postal code. Maptive makes this process direct. First, choose a geographic shape as your basis. Next, add layers such as projected revenue, customer count, or prospecting potential. The tool shows how many current and potential customers fall within each area, so sales reps have about the same workload.
Drive time can be another way to define balance. If a rep’s territory is spread out, travel time should be shorter in each zone. Maptive can draw boundaries based on drive time instead of distance, using real road data. This helps salespeople work efficiently, spend less time on the road, and devote more time to selling.
Several companies also use recorded sales performance and account growth as part of their territory design. With Maptive, you set custom formulas for what counts toward balance, so territories are not split on geography alone.
Advanced Features for Better Planning
Maptive includes several advanced features that go beyond forming territories. Heat maps are available to show density or concentration. For instance, if you want to see clusters of high-income neighborhoods, you can generate a heat layer over your map. This picture lets you guide representatives toward untapped neighborhoods or cities.
Multi-stop route maps help with planning daily sales visits. After territories are created, a sales rep can use Maptive to plan the shortest and fastest path between all accounts in their assigned area. This reduces wasted time. Sales planners can also spot gaps or overlaps between territories that might not have been obvious from data tables only.
Maptive’s integration with official population data boosts accuracy when targeting prospects and building customer profiles. Census data available for the United States and Canada can be layered over account locations, providing more detail than lists alone.
Optimizing Routes and Field Activities
Once boundaries are set, travel gets easier to manage using Maptive’s route optimizer. It plans stops along the shortest or quickest path, reducing fuel use and drive time. This tool factors in meeting length and the best available order of visits. Sales teams do not have to work out routes by hand or risk missing appointments because of poor planning.
Location finders also help teams react to last-minute changes. For example, if a rep needs to visit the nearest account from their current spot, the platform can calculate the fastest option. Distance calculations happen within the map, supporting quick adjustments on the fly.
Simple Design and Customization
Ease of use matters when assigning work in a busy sales office. Maptive does not require programming or mapping skills. Managers and representatives alike can access it from any phone, tablet, or computer.
Customization is also simple. You can upload a company logo, choose a specific pin color, and set different map styles to match your brand. This personal touch is helpful for presentations or sharing maps with clients. The platform supports these changes so that every map matches a company’s identity.
Security for Customer Data
Sales leads and account details need protection. Maptive uses 256-bit Secure Sockets Layer encryption on all data entering or leaving the platform. This step helps keep sensitive data away from unauthorized parties.
Large companies typically have stricter standards for privacy. With Maptive’s security setups, enterprise-level clients can store, view, and share their territory plans as needed, without fear of data leaks.
Exporting and Sharing Territory Maps
Teams need maps for reports, reviews, or meetings. Maptive lets users export maps as high-resolution pictures or embed them in slide decks such as PowerPoint. You can also print directions for sales reps who are headed out into the field.
Sharing tools helps teams collaborate. Managers can send interactive maps to team members or share access for feedback. This streamlines the planning process and builds consistency, since all users are working from the same data.
If teams use the maps in external presentations, the branding and styles carry over, providing a more professional look.
Practical Outcomes
Many businesses have improved resource allocation after mapping territories with demographic inputs. When companies use Maptive, they report that sales reps are more able to cover assigned accounts, and performance aligns better with company goals.
One example is a retail supply business. They mapped out prospects using both sales histories and income data. After reassigning territories, each sales rep handled about the same revenue potential, cutting severe workload imbalances. As a result, sales increased in previously less-covered regions.
Another use case involves service companies. By integrating drive time and census data, some teams found that certain reps had too much territory to manage because of travel. Rebalancing zones based on drive data helped lower missed appointments and kept the workload even.
Getting Started With Maptive
To begin balancing sales territories, bring together your location lists and any demographic details you want to add. Upload these to Maptive from a spreadsheet. Next, explore the mapping tools to set boundaries, apply demographic filters, and add route planning features. Review the maps with your team and gather feedback. As business needs shift, you can easily update or redraw territory maps.
Maptive’s mapping platform serves organizations looking for more detailed and fair territory assignments. With options to use demographic, performance, and location data in planning, companies achieve improved sales management. Routine tasks such as assigning, reporting, and optimizing routes become easier, which helps teams act with more focus and accuracy.
In summary, balancing sales territories means matching the right factors to the right areas while considering account numbers, drive time, and market data. With Maptive, companies can use practical tools to see where value lies and set up their teams for consistent work. The result is a sales structure that relies on real data and a mapping platform built to handle both simple and advanced planning needs.


