New technologies are allowing businesses to have access to more sales data than ever before. As a result, companies are gaining actionable insights into their performance and capitalizing on exciting opportunities.
If your business isn’t currently performing sales data analysis then you’re likely falling behind the competition. So, how do you go about getting started?
We’ll cover everything you need to know about sales data analysis, including what it is and how to do it effectively.
What is Sales Data?
Sales data is a broad term that refers to any metrics or information you collect related to your sales. This could include basic information like total sales, revenue, and sales representative statistics, or KPIs such as customer lifetime value.
You can collect data for your business as a whole, or gather it for individual territories, locations, and sales reps.
How useful your sales data is will depend on the data you’re using and how you’re analyzing it. When done properly, sales data analysis is often the difference between a growing business and one that’s underperforming.
How Do You Collect Sales Data?
In order to properly analyze your sales data, you need to establish a reliable way to collect it. There’s plenty of software available to help you collect and track your data. This includes POS systems, eCommerce software, and online marketing analytics.
You may also use old-school tactics like surveys to gather valuable information. Collecting customers’ emails and phone numbers lets you reach out to them after they’ve made their purchase and gather valuable data, such as customer satisfaction levels.
Assess your goals and resources and settle on a data collection that strategy that makes sense for your business.
Why Monitor Sales Analytics?
You may know what you want to achieve, but without access to the proper information, it’s hard to tell whether or not your business is performing how it should be. This is why sales data analysis is so important.
By monitoring your sales analytics you’ll have a better understanding of what’s going on inside your company, allowing you to adapt to changing conditions.
Here are three reasons to track your sales data:
- Monitor Your Sales Goals: Use sales data analysis to see how you’re doing in regards to the goals you’ve set. Are you on pace to reach your desired sales numbers, or are you falling behind? Your data will tell this.
- Find Out What You Do Well: Look for areas you’re excelling in and double down on those. Is your new product a hit with customers? Then increase your advertising to maximize your revenue.
- Discover Your Shortcomings: Find out what’s not working in your sales pipeline. Correct any issues or scrap projects and campaigns that are generating a negative return on investment.
How to Perform Sales Data Analysis: A 4 Step Process
Now that you know why you should perform sales data analysis we’ll go over how to actually do it. Below is a simple process that will help you get started and develop a plan for your business.
Step 1: Identify the Data You Want to Collect
Before you begin you have to decide what type of information you want to collect. We recommend establishing a sales plan and goals first. Then select the data that will accurately measure your targets.
Some examples of different types of sales data you might collect are:
- Total Sales: The total number of sales your business has generated over a given time period.
- Revenue: The total sales revenue generated over a given time period.
- Sales Per Location: The total number of sales generated by a specific business location over a given time period.
- Sales Per Representative: The total number of sales generated by one of your reps over a given time period.
- Lead-to-Sale %: The average rate at which you’re able to convert a prospect into a sale.
- Average Purchase Value: The average revenue generated per sale.
- Cost Per Sale: Your average cost incurred per sale. This includes product costs, labor, etc.
- Sales Growth: The amount your sales have grown over a set period of time. Use this to track past sales trends and forecast future growth.
Choose a good mix of data and try to select metrics that go deeper and give you information about customer behavior.
Step 2: Choose a Method for Collecting Data
We’ve already discussed several data collection methods for you to consider. The one you choose will largely depend on what you’re trying to achieve and the type of business you run.
Smaller operations might opt for simpler more cost-effective solutions, while larger ones may require something more automated.
Whatever method you end up using, just ensure it’s able to provide you with the type of real-time sales data you need when you need it.
Step 3: Track Your Sales Data
Check your sales data regularly. Identify areas where you’re succeeding in order to capitalize on potential new opportunities. Most importantly, pay attention to areas where you’re falling behind and make changes as needed.
Some sales metrics need reviewing daily, while others can be checked weekly, monthly, or quarterly.
For example, if there’s an online component of your sales funnel it’s a good idea to look at that data on a daily basis just to make sure everything is functioning correctly. However, if you want to monitor the sales performance of a marketing campaign it’s best to check it weekly to get an accurate sample of data.
How often you check your reporting dashboards will also depend on your goals. You may have monthly, quarterly, and yearly sales targets, so not all data points need constant monitoring.
Step 4: Share Your Results with Relative Stakeholders
Your sales data is most valuable when it’s used as a tool for collaboration. The more people that have access to your analytics the better chance you have of discovering important insights. This means finding the best way to share your data is extremely important.
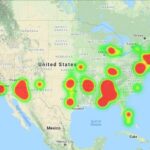
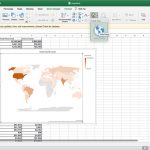
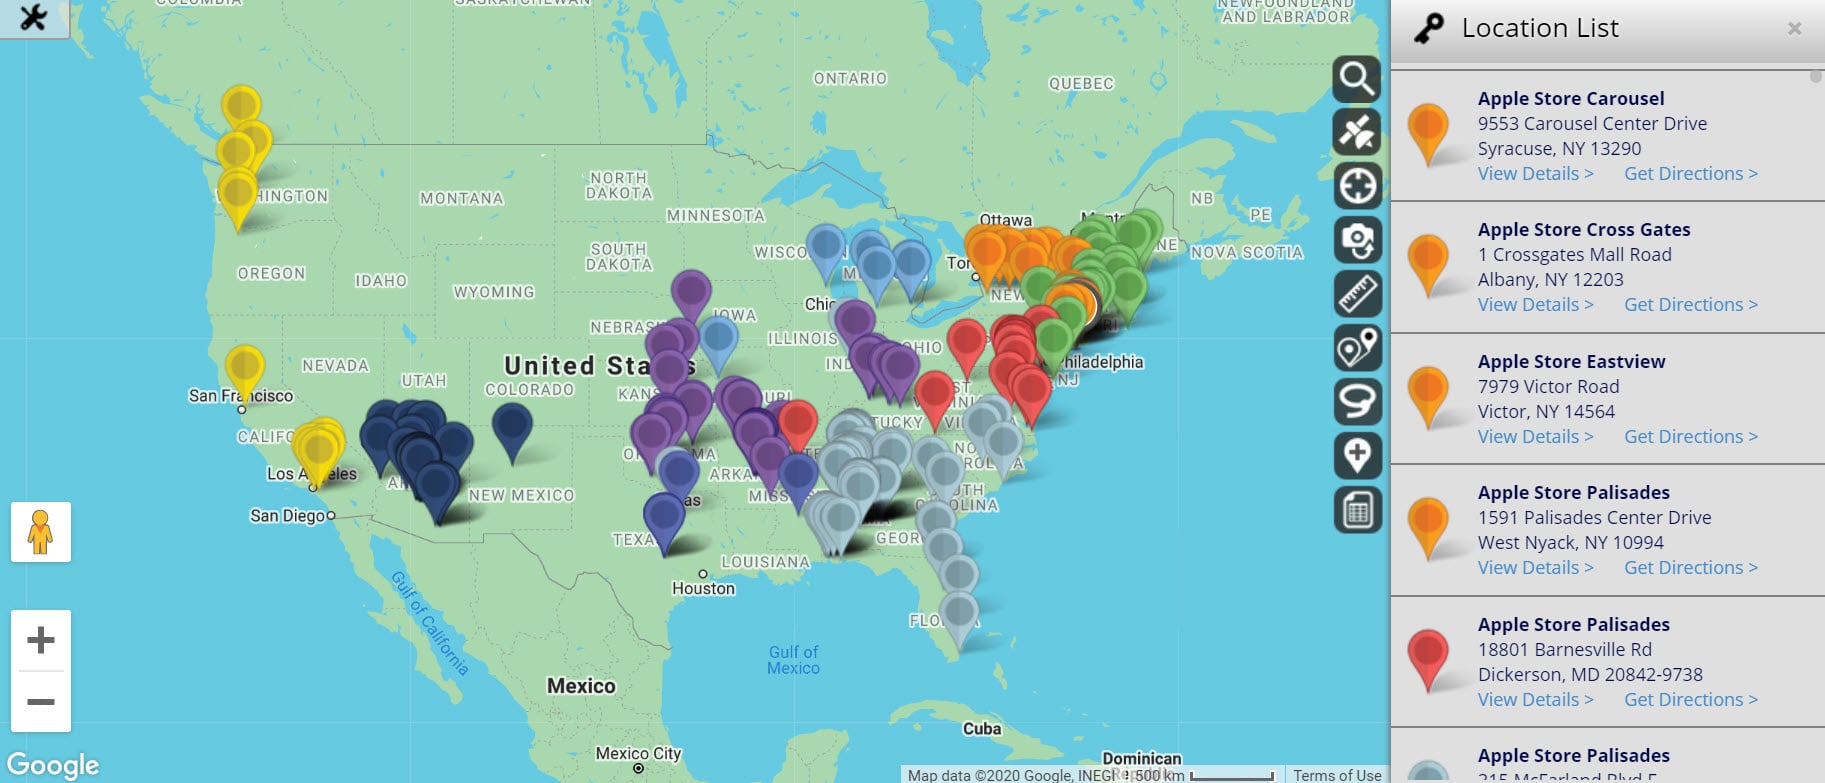
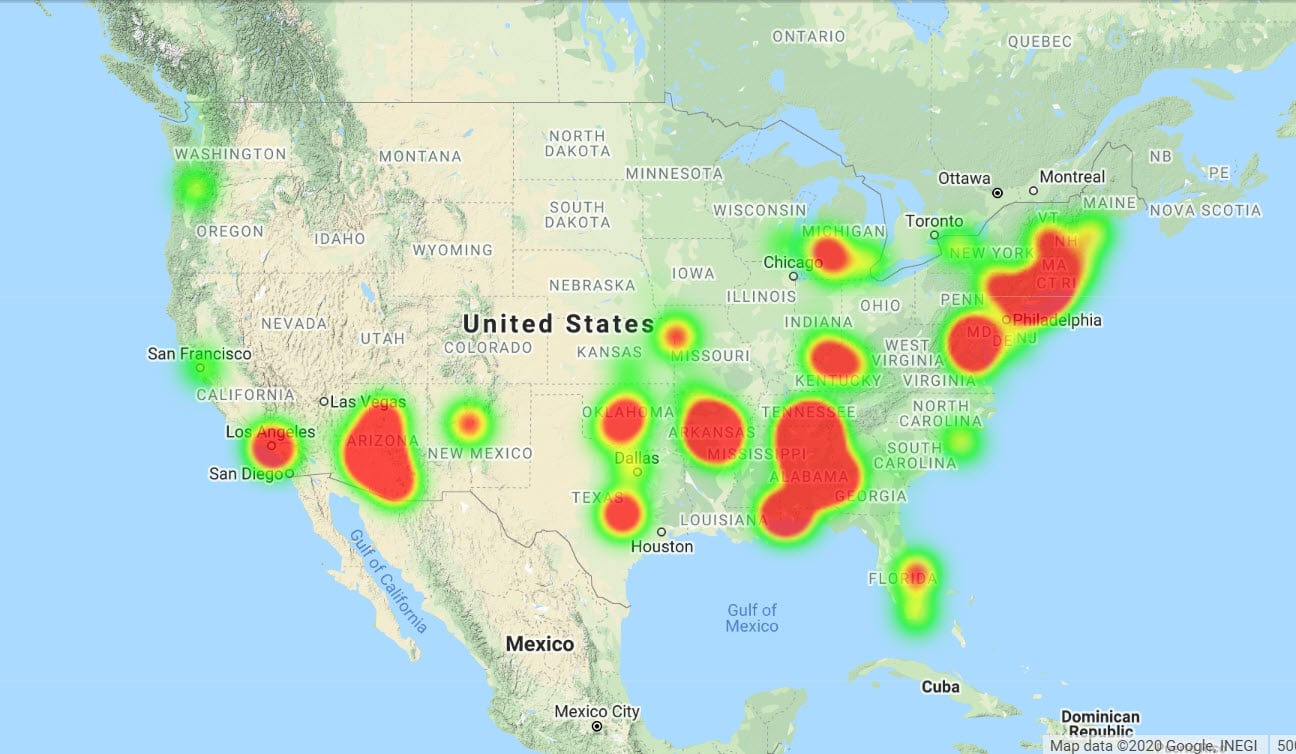
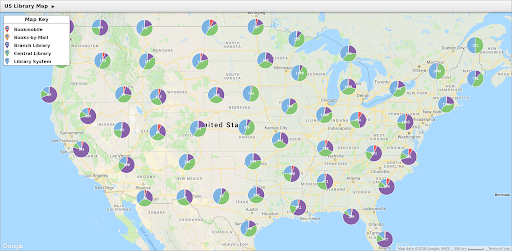
Some formats are more engaging than others, so explore all your options. For example, using your data to create an interactive map will likely spark a lot more conversation than simply submitting a sales analysis report. These sorts of visual presentations also allow your data to be accessible to a larger number of people.
Get creative and share your data in ways that everyone can understand.
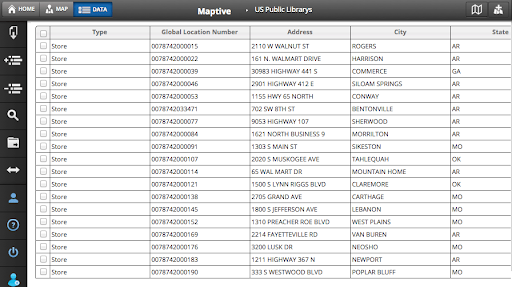
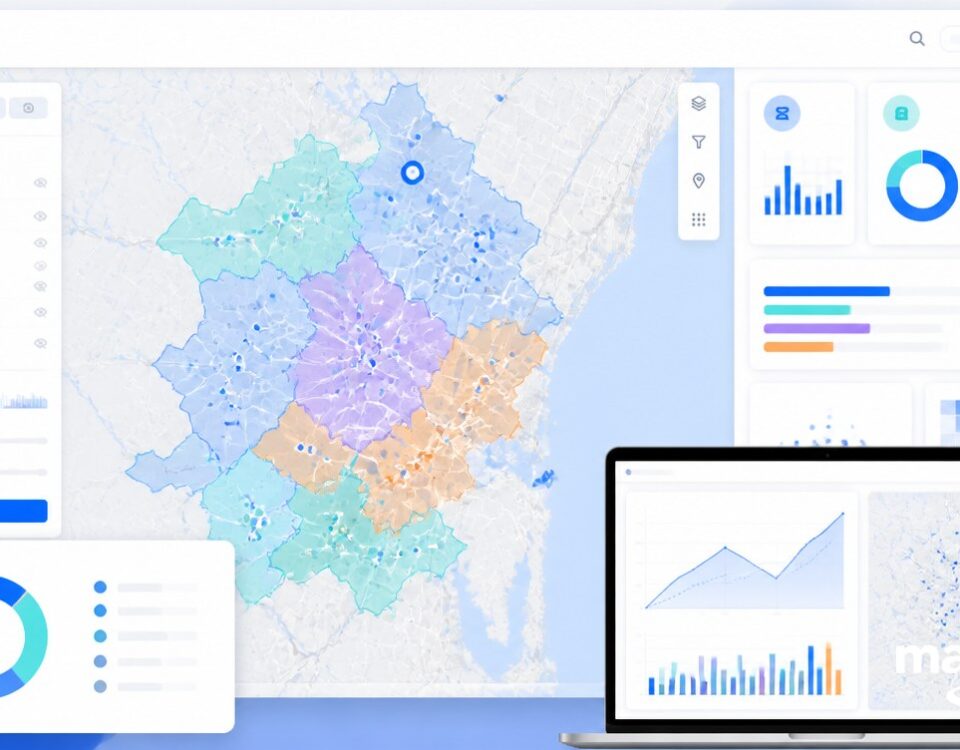
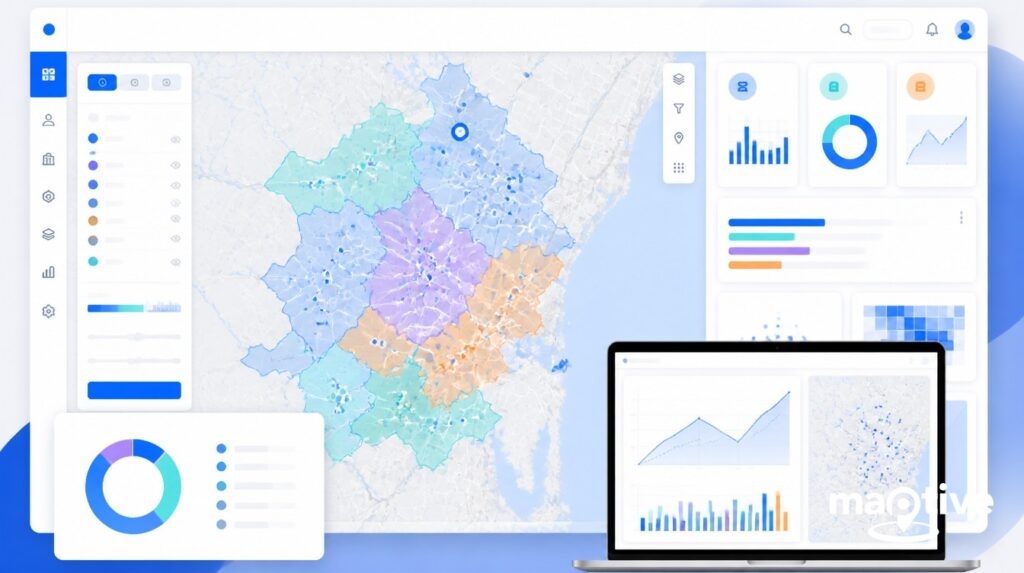
Perform Better Sales Data Analysis with Maptive
Upload your sales data to instantly map locations, salespeople, customers, and more. Use a variety of features to customize your map and share it with your sales team, sales managers, and decision-makers.
Sign up for a free trial of Maptive and create your map today.


