Create a Map from Excel Data
Turn a spreadsheet of addresses into a clean, interactive Google map in minutes. Upload your Excel file, CSV, or Google Sheet and Maptive plots every location for you, ready to filter, group, route, and share.
No credit card required
- Excel, CSV & Google Sheets
- Automatic geocoding
- Ready in minutes
- No coding required
- Live Google Sheets sync
- Free 10-day trial
Trusted by teams at


Turn an Excel Spreadsheet Into a Live Map
A spreadsheet full of addresses is hard to act on. Scrolling the rows tells you what you have, but not where it sits, which customers cluster together, or which territory is stretched too thin. Maptive turns that same file into an interactive Google map, so the geography you could never see in a table becomes obvious at a glance.
There is nothing to install and no formulas to write. Upload an Excel file, CSV, or Google Sheet and Maptive geocodes every row, whether you have full street addresses, cities, zip and postal codes, or latitude and longitude. Within seconds each record becomes a marker you can filter, group, route, and share with your team.
Map Your Excel Data in Four Steps
No formulas, no plugins, no coding. Here is the whole process from upload to finished map.
Start a free trial
Create a free Maptive account in seconds. The 10-day trial unlocks every feature and needs no credit card to begin.
Create a new map
Click Create Your First Map, give it a name, and you have a blank, interactive canvas ready for your data.
Upload your spreadsheet
Drag in an Excel file, CSV, or Google Sheet. Maptive imports the whole list and gets it ready to plot.
Match your columns
Maptive auto-detects your address or coordinate columns, geocodes every row, and plots them on a Google map in seconds.
Prefer another route? Connect a live Google Sheet so edits sync to the map automatically, push records through the Maptive API for real-time updates, or start from a blank map and drop pins in by hand.
What You Can Do With Your Excel Map
Once your locations are on the map, hundreds of tools turn raw rows into decisions. A few of the most popular:
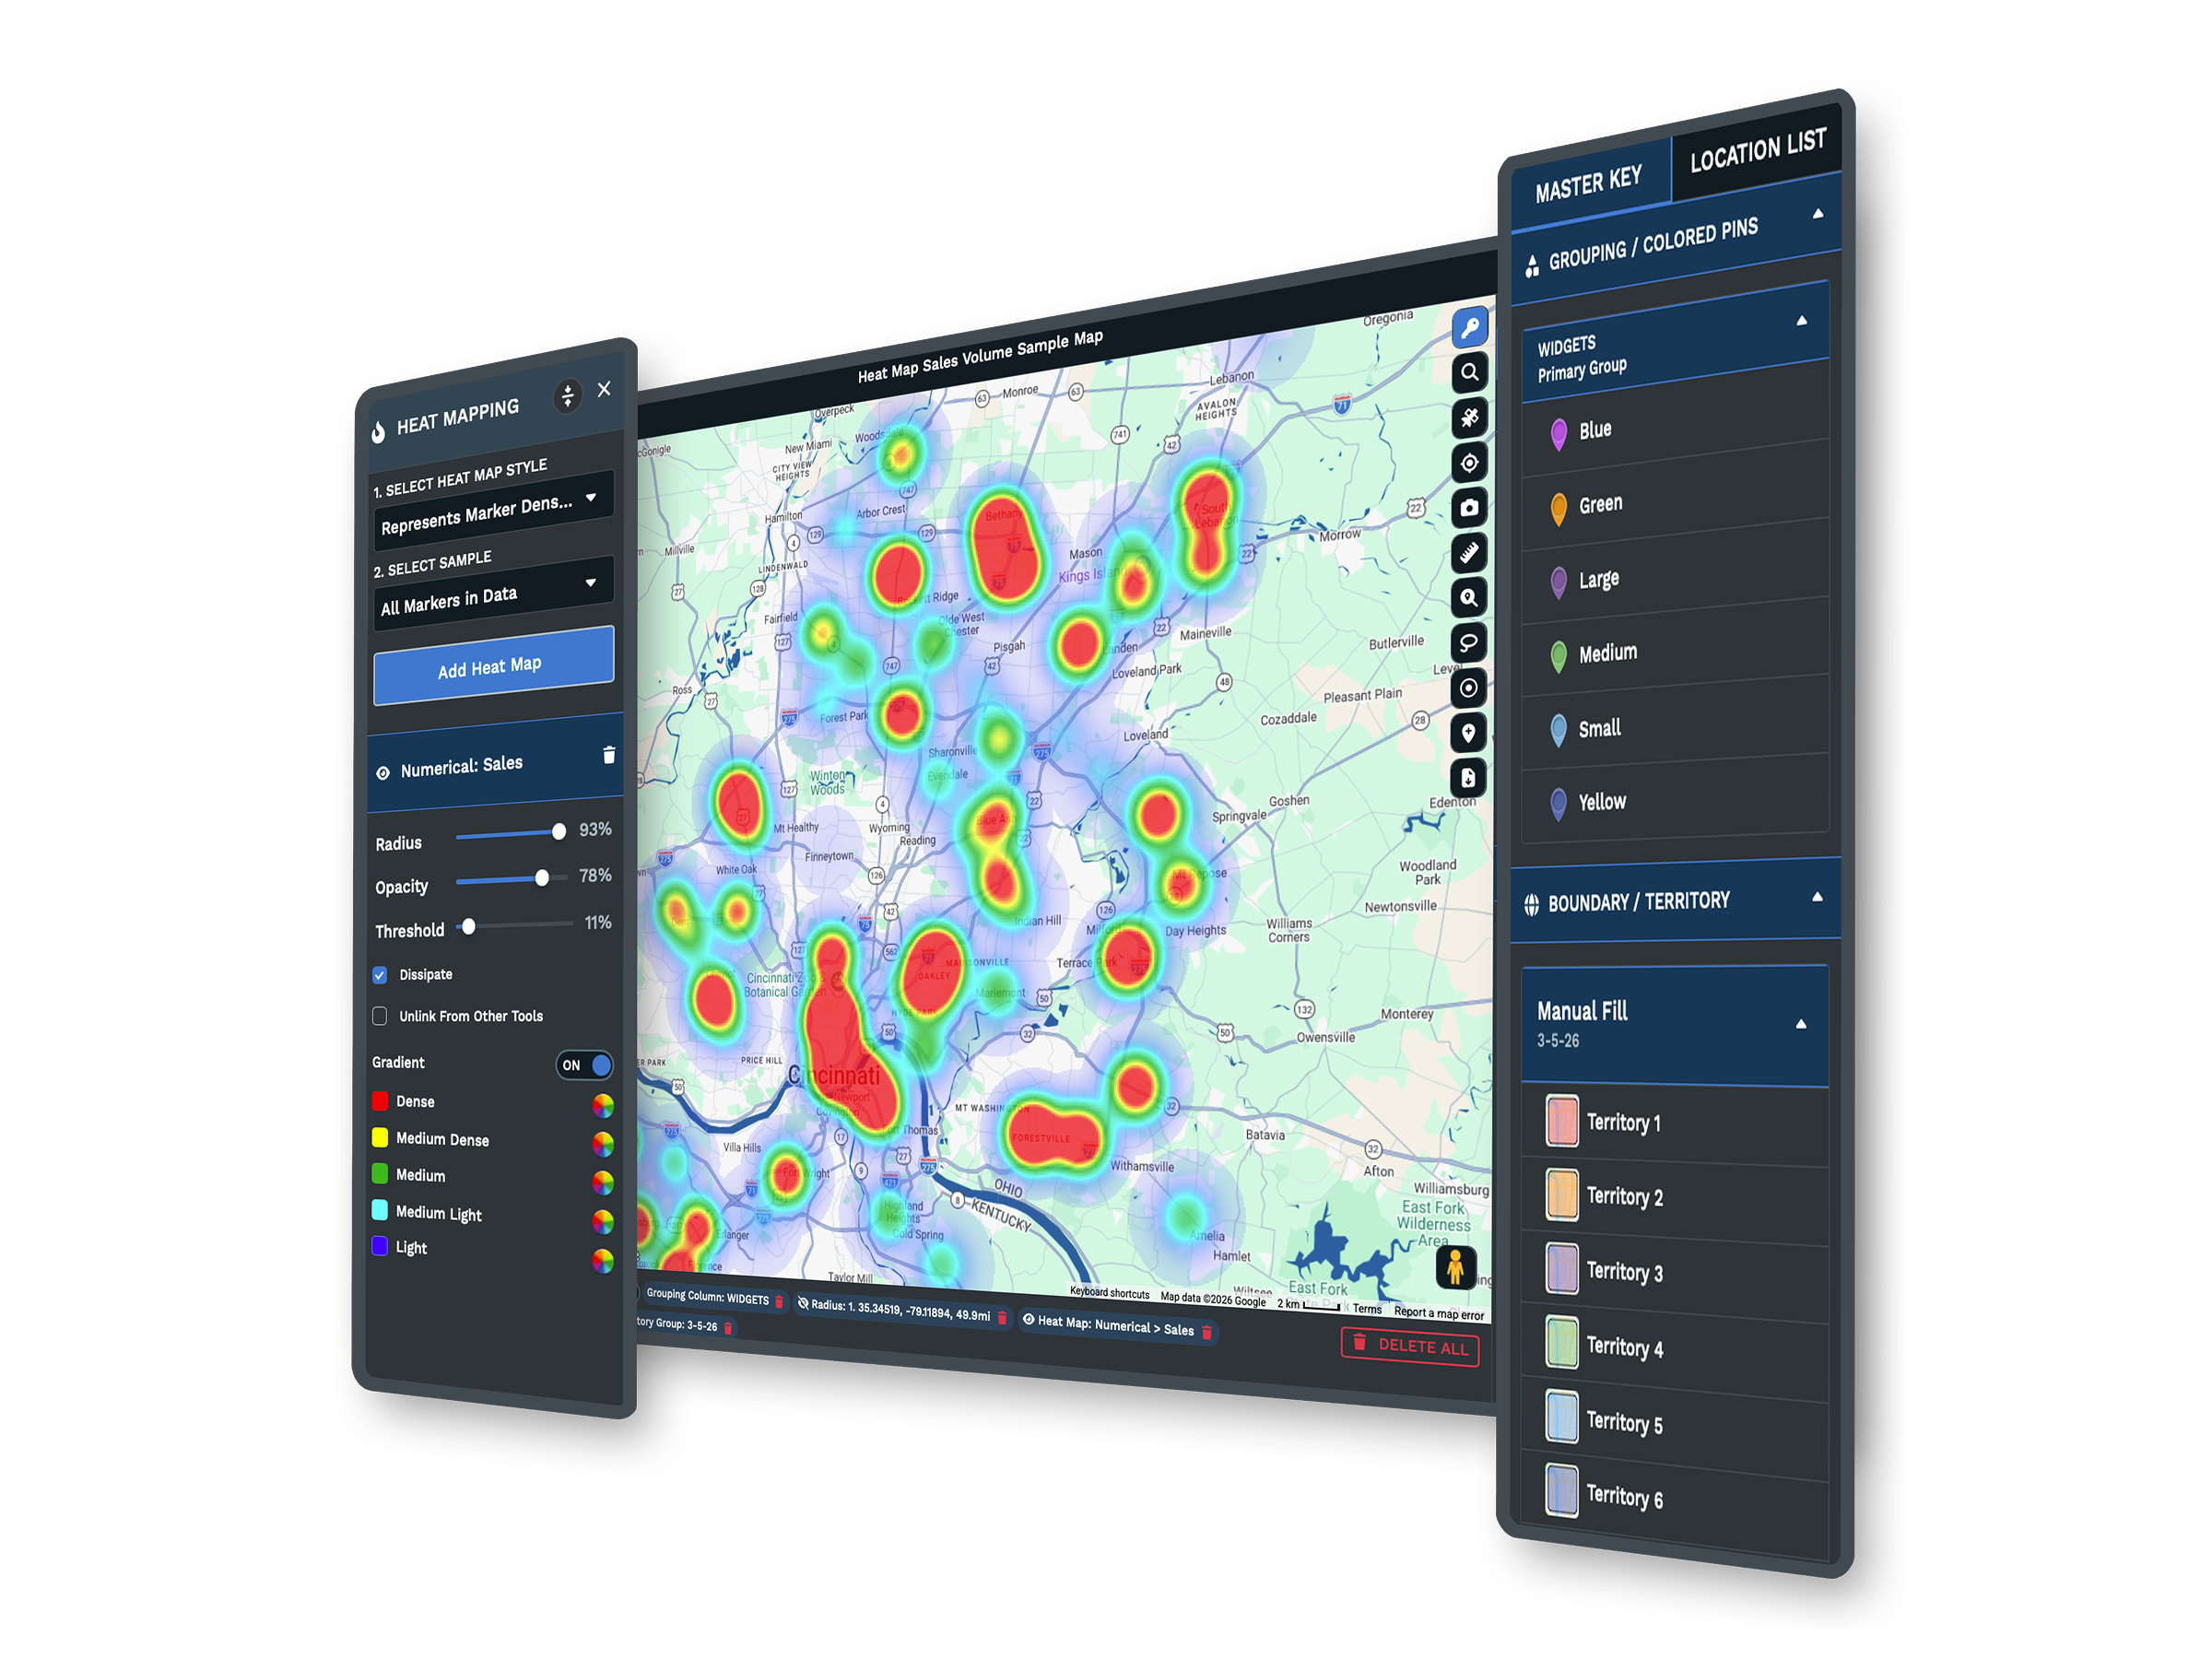
See where your data concentrates
Turn thousands of rows into a heat map that shades hot and cold zones across your territory. Weight it by a column such as sales, revenue, or client count, and the busiest areas glow while quiet ones fade.
It is the fastest way to spot demand, gaps, and outliers that stay invisible in a list of numbers.
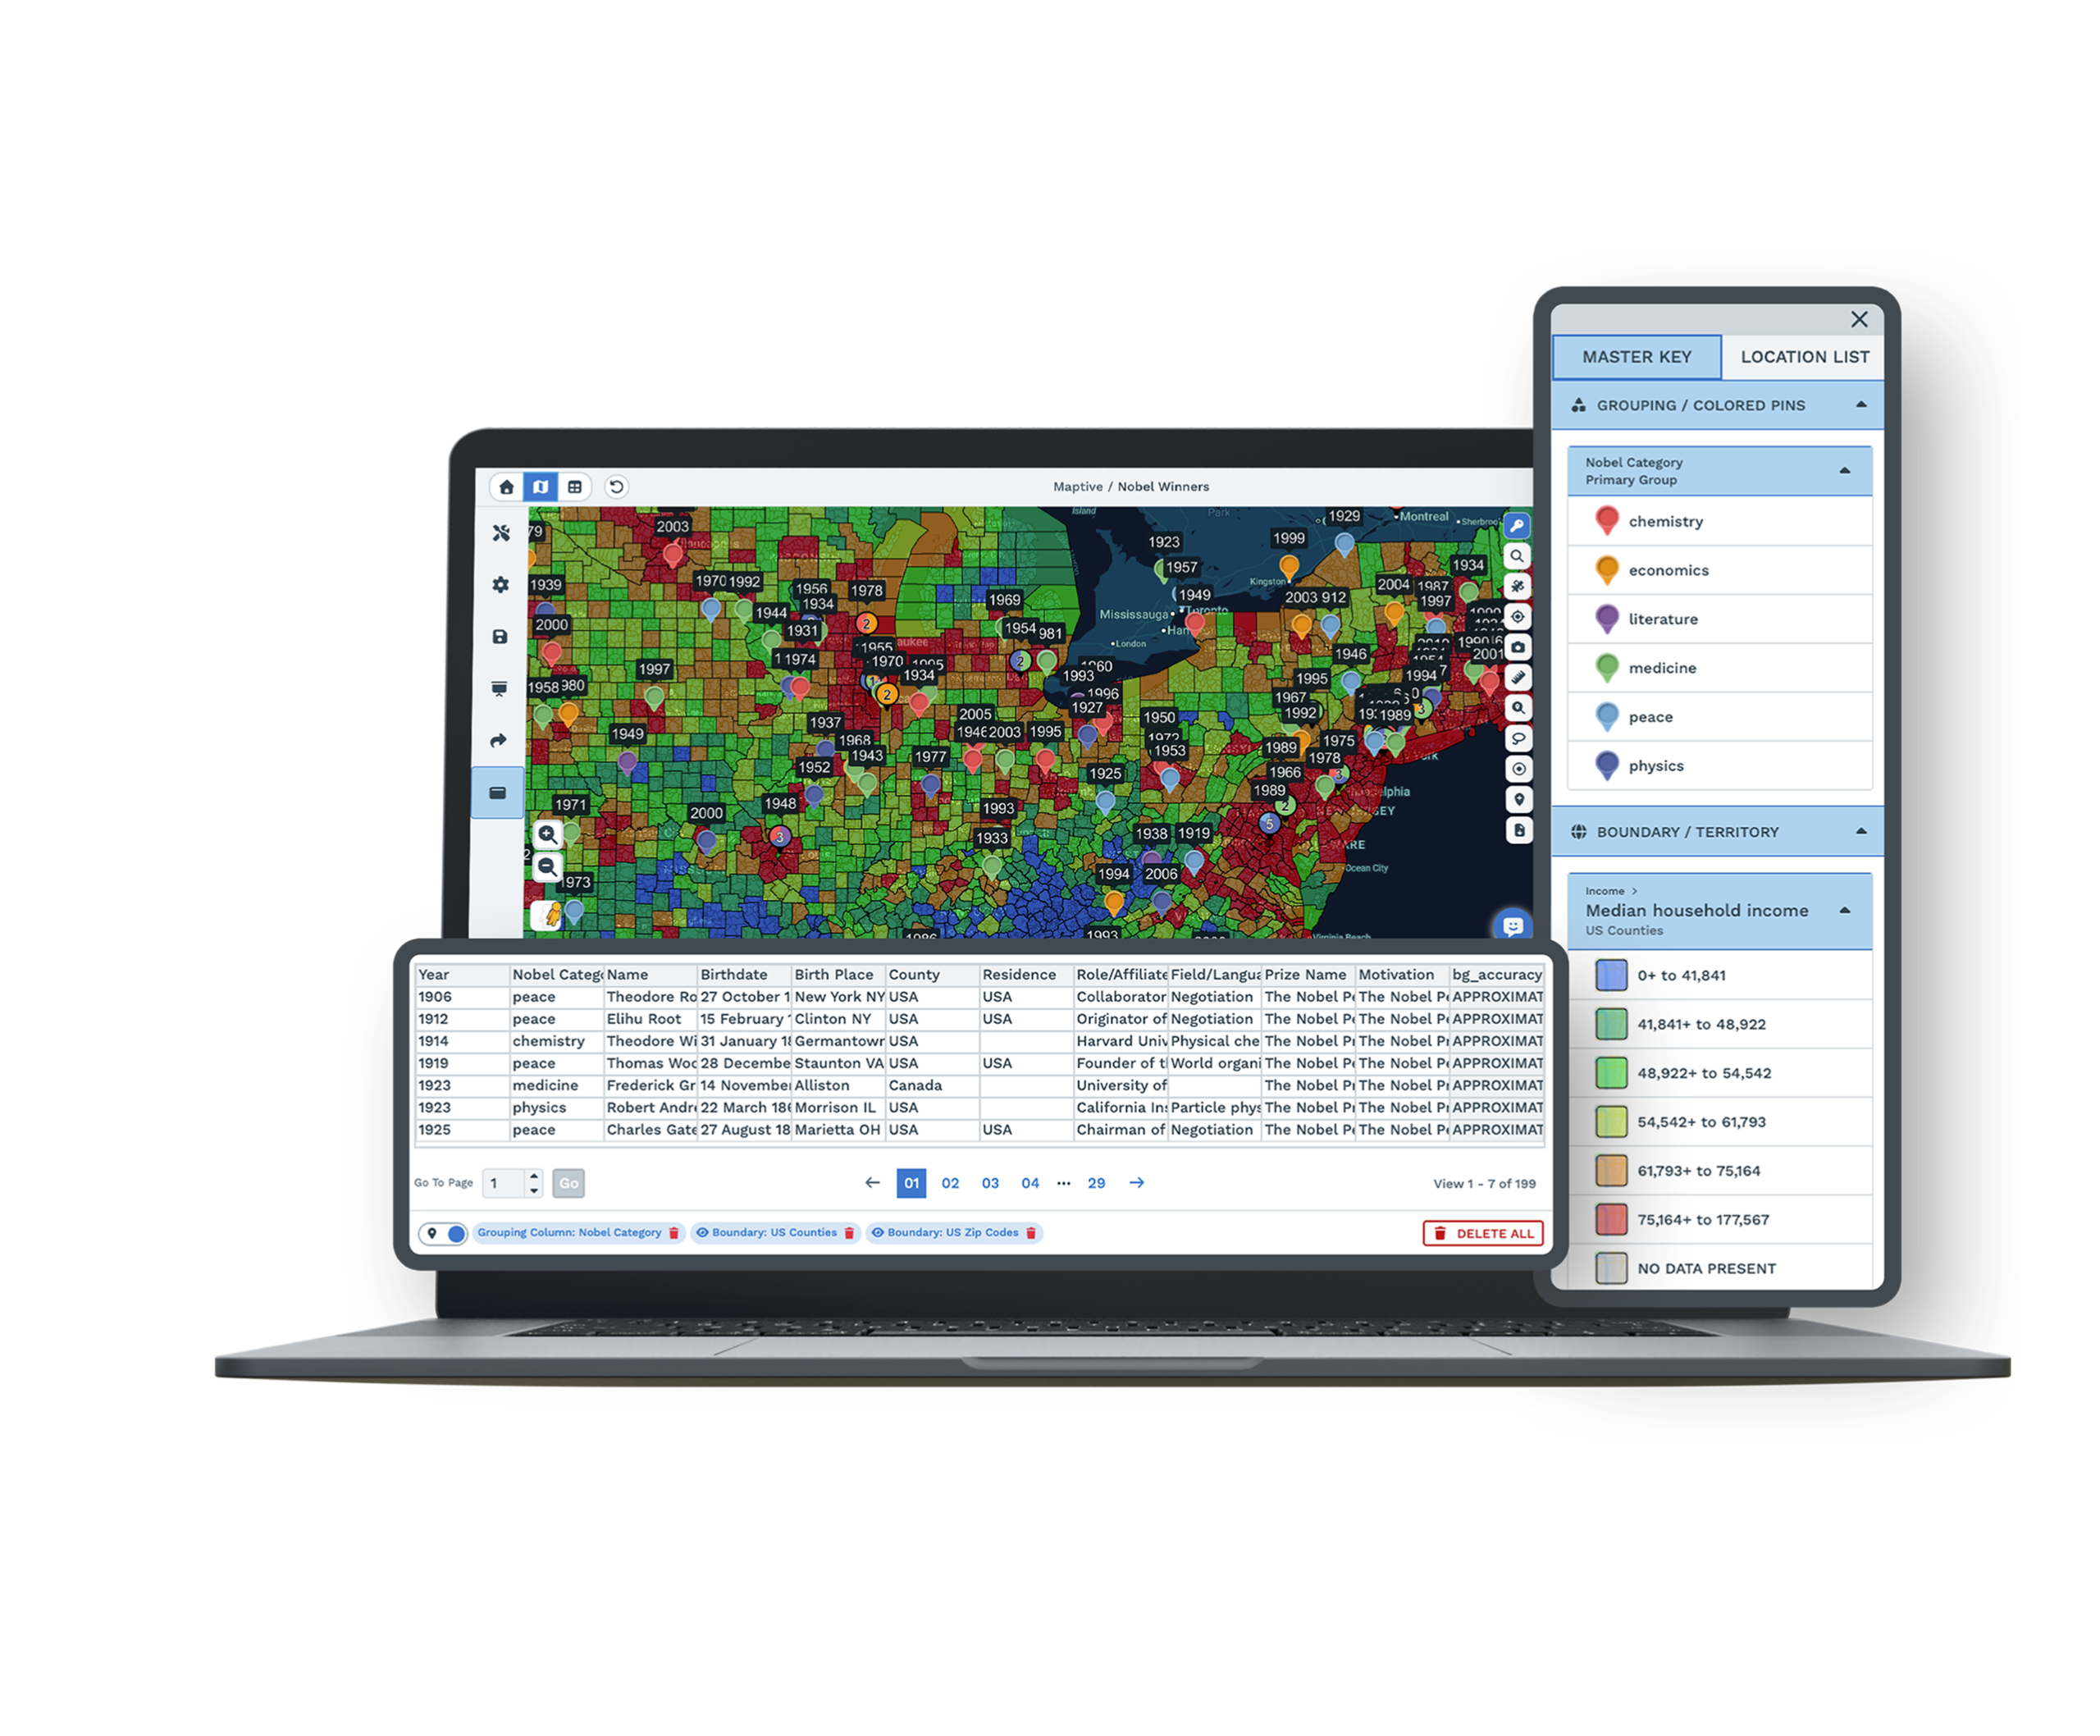
Color-code every category
Pick a column and Maptive finds each unique value, then drops a color-coded marker for every row. Customer type, status, rep, or product line becomes a legend on the map.
Patterns by segment jump out instantly, without building a single pivot table.
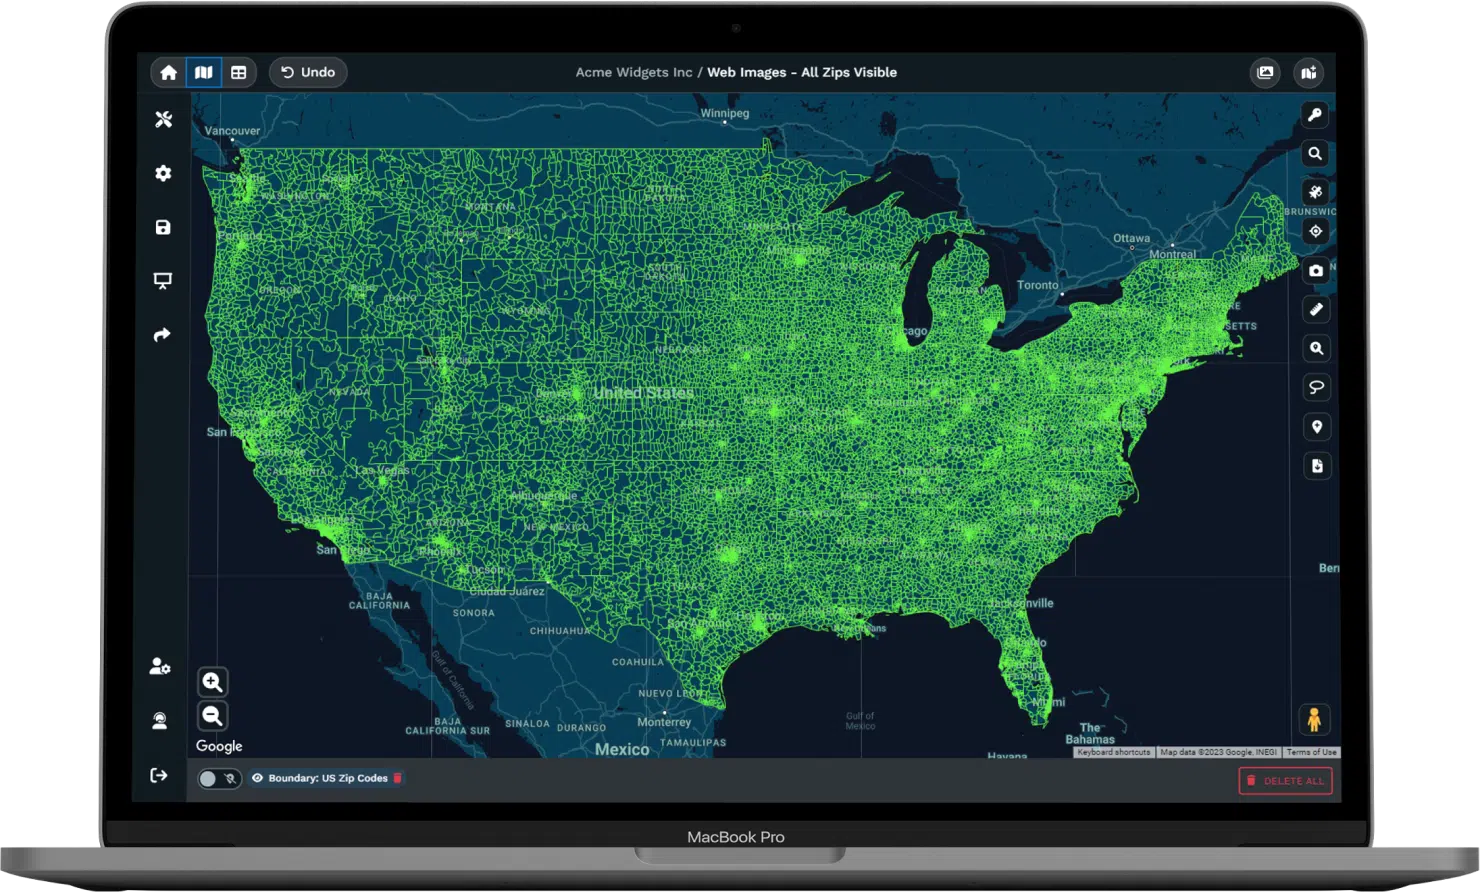
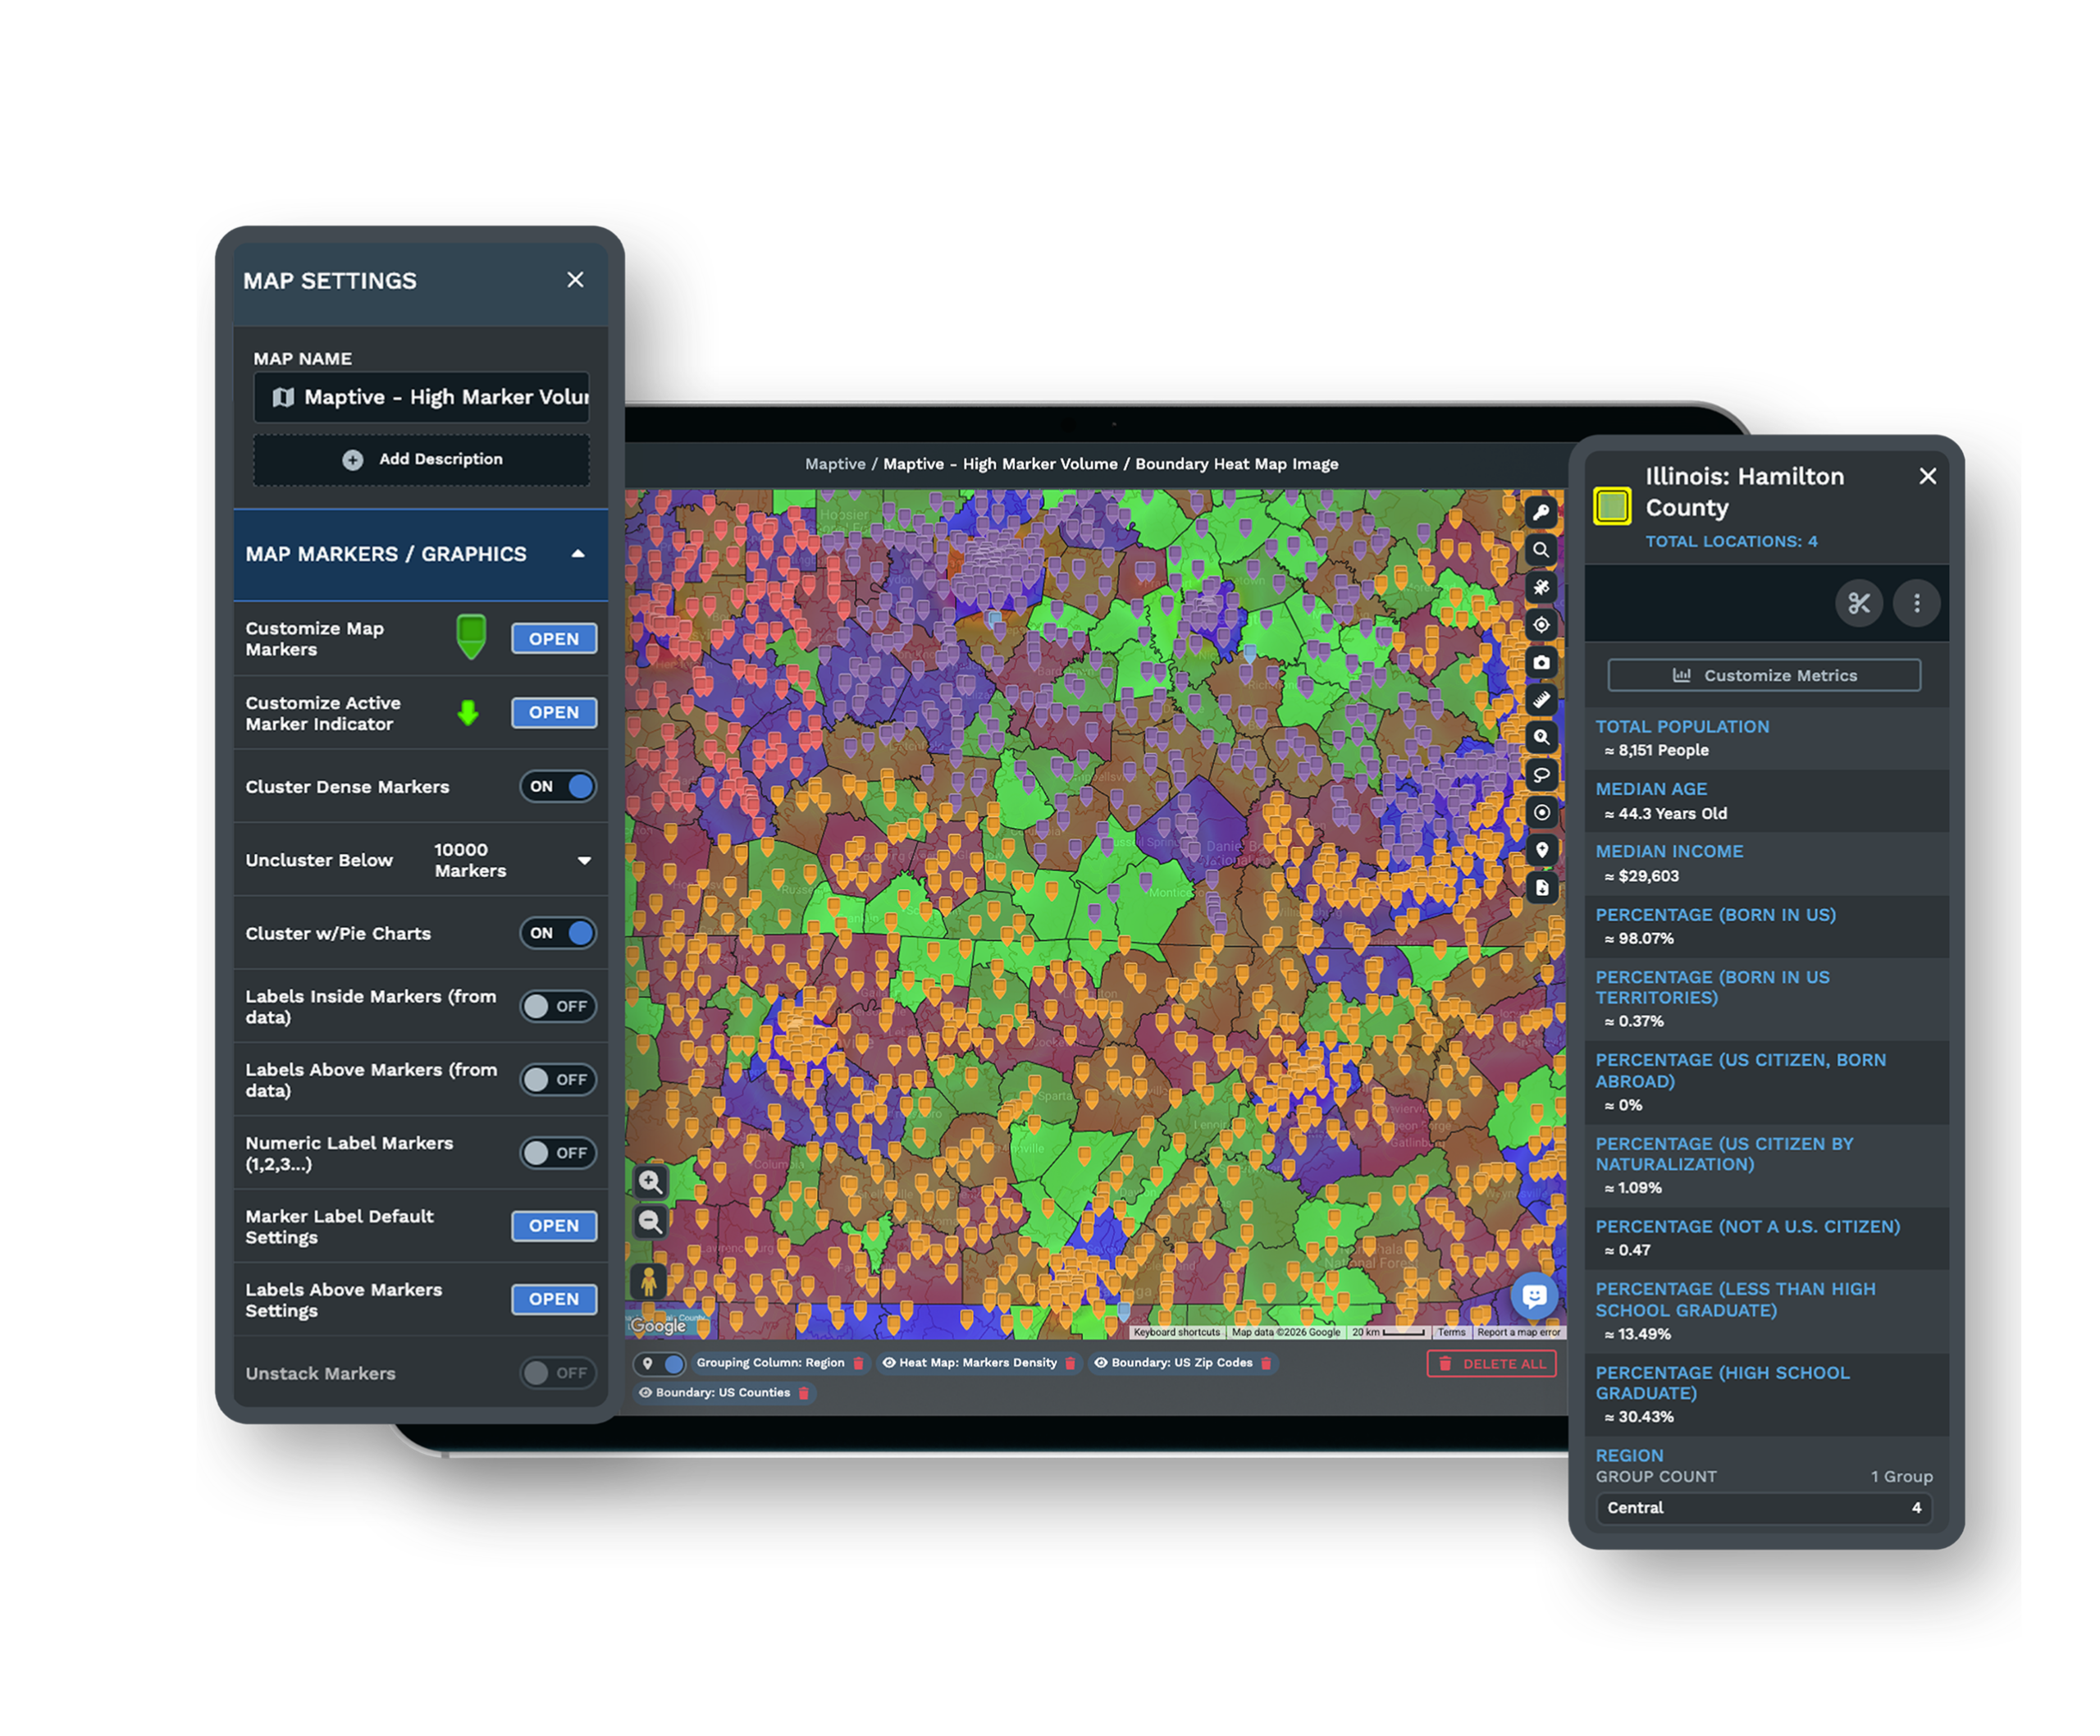
Map zip codes and regions
The boundary tool overlays roughly 43,000 US zip codes plus counties and states, with postal areas for Canada, the UK, and Australia too.
Shade each region by the data inside it and combine your spreadsheet with current census figures for instant context.
Mapping Excel Data: FAQs
What file types can I upload?
Do I need latitude and longitude, or just addresses?
Can I map international locations?
How long does it take to build the map?
Will the map update when my spreadsheet changes?
How many locations can I map at once?
Can I change how the map and markers look?
Is my data secure?
Is it free to try?
Free trial, every tool, no credit card
Turn Your Spreadsheet Into a Map Today
Start a 10-day free trial and upload your first Excel file, or book a demo to see Maptive on your own data.

