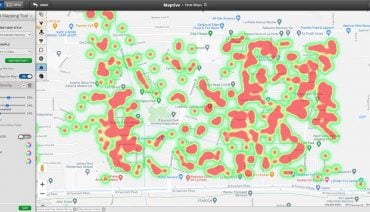
Executives hunt for useful data, not busywork. Maps are handy, but most people stare at them without grabbing much that matters. Pull up five Maptive maps, though, and you start seeing patterns. These maps do not fill up your dashboard for show, they point to what you might do next. We will break out five maps that lead to real growth moves, boss decisions, and fewer dead ends. I won’t pad this out. Here is what works.
Table of Contents
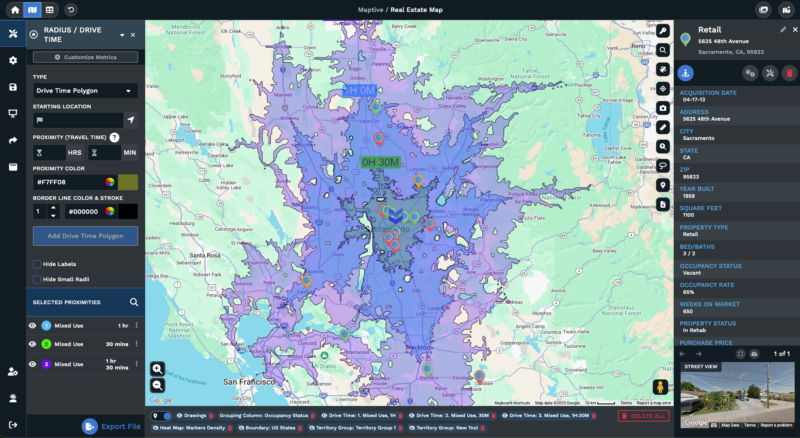
If your service or products depend on people coming to you, you need to know more than how far your stores are. Miles do not mean much to a customer who counts minutes on the road, not distance. Using Maptive iQ’s drive time tool, you can map real routes. With the new four-hour accuracy and sharply defined travel edges, you are not taking a guess at who can get to you.
Take a fast-casual restaurant chain with three stores in a mid-sized city. Old models circle a ten-mile radius and call it good. But with Maptive iQ, you set the drive time. The latest update nails it with more calculation points, so you see small differences that matter. Maybe bad traffic in one area means people cannot reach you on their lunch break, but another direction is wide open.
You can sketch out these drive times for four hours if needed. Plenty of executives need these long-haul stats for things like delivery, regional sales, and supply chain checks. Counties or cities with better overall access show up fast. You can plug in delivery windows for couriers or rep routes for sales teams. More accuracy, more profit, less fuel, shorter hours wasted.
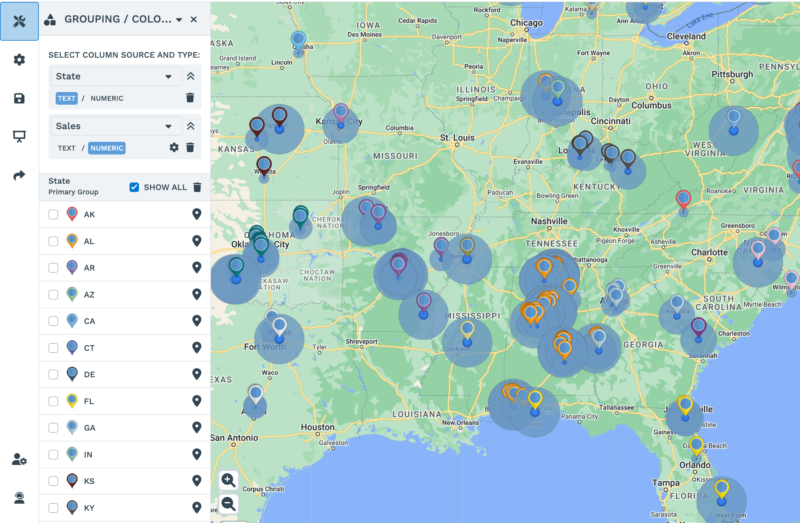
Picking store sites or expanding a sales force based on old census blocks wastes money. Maptive iQ gives you a live demographic view, every tweak you make on the map updates the data instantly. This means if you shift a boundary or carve out new territory, you see new totals for age, income, household count, race, and any other tracked field right away.
Let’s use a chain of clinics. The health care market keeps changing as new apartment complexes fill up and older suburbs empty. Yesterday’s market is gone. The real-time demo update snaps to the latest numbers, and you see changes even as you redraw a service area. Compare a few areas fast, sort by what matters (maybe kids under 12, maybe adults over 65), and plan your outreach.
You do not need to open another window or run a report. See the effects of a closed boundary, or an expanded one, in the main split-screen display. If you need to pitch a change to the board, bring this up on your screen. No need for after-the-fact excuses, the data is current as you make your choices.
Opening a new store, office, or warehouse costs money. Picking a bad spot drains your cash faster than any supply chain issue. Maptive iQ brings site scoring powered by AI. Load in potential locations, and the tool evaluates them using updated stats across dozens of fields: local spending, traffic flow, average household income, competition, even population direction.
A retail executive at a growing sneaker shop brand can upload a list of candidate addresses. The AI tool then sorts out which locations have the highest scores based on combinations of factors that actually matter for sales. No gut feeling, no preconceived idea about which neighborhood is “coming up.” The machine checks trends, compares against current customers, and ranks your sites.
It also sidesteps bias. If you want new stores near public transit, the tool weighs that fact instead of a manager’s hunch about “good” corners. Each map shows why a location gets a good or poor score, so you do not make calls in the dark. You can share the AI rankings in meetings, letting everyone see why a site passes or fails the bar.
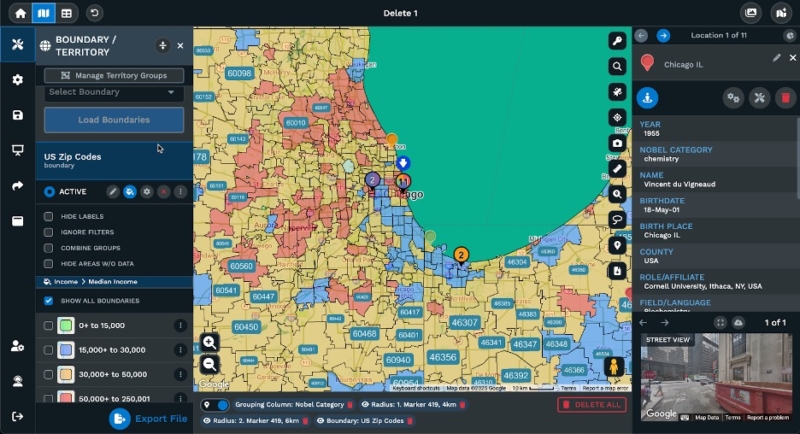
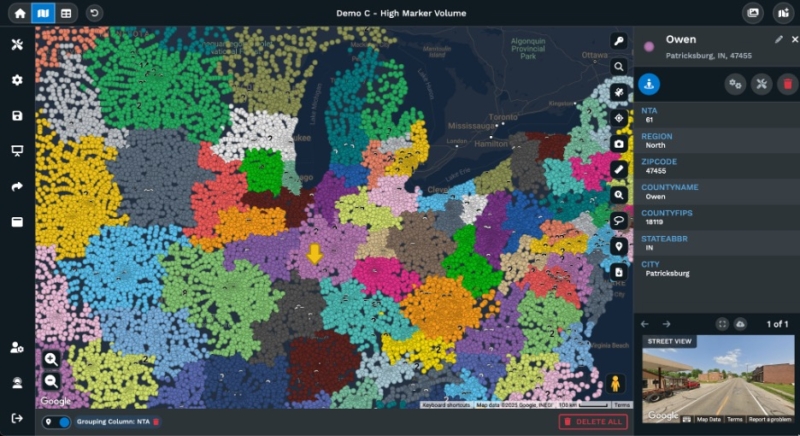
Bad boundaries eat profits. If two sales reps fight over the same cluster of stores, or if a field team drives past each other to hit the same neighborhood, you burn hours and lose edge to competitors. Maptive iQ’s territory tools let you draw, merge, and split sales regions or service zones, using states, counties, saved regions, or hand-built custom polygons.
Here is where Maptive has rebuilt its tool. You can take territories based on boundaries, then flip them into editable polygons. If your business changes or sales force grows, you can cut or join new regions in minutes. Hide zones that do not matter for your current review, and focus only on the ones with growth upside.
The territory feature integrates with the split-screen. While you adjust regions for your sales or service teams, the updates reflect on the live map and summary tables. You see which rep or service manager gets which client or account, fine-tune until you have no overlap, and send out clean assignments. No accidental double coverage, no gray areas.
This beats old spreadsheet work and dry-slide presentations. Anyone who has fought through the old “whose client is this?” pain will see the value in five minutes.
If your expansion plans hinge on not being wiped out by competitors with deeper pockets, pay attention to how your market looks with live layers. Maptive iQ lets you upload and layer competitor sites, then match them to current sales zones. This is where the map shows truth.
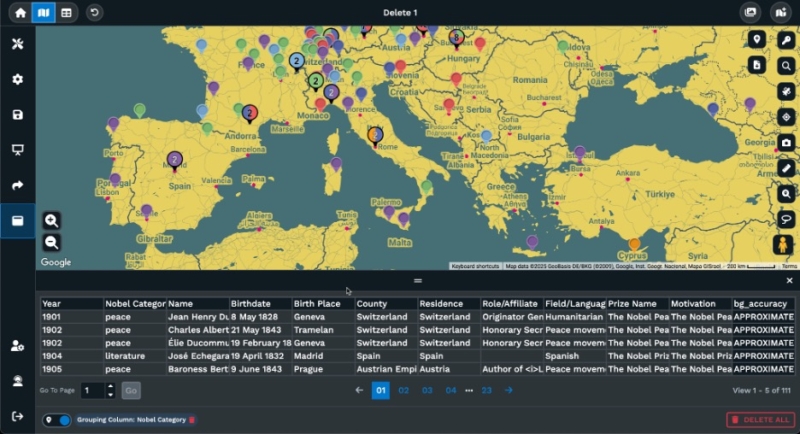
Franchise operators, chain retailers, and even service companies can use this. Drop pins for every rival in your county or city. Layer your actual sales data or delivery counts over those points. The platform supports thousands of markers now, thanks to new WebGL rendering, so the system does not get bogged down.
The area with high competition but flat sales? Maybe you pull back, cut marketing, and let the other firm spend. Regions where few players compete but you see above-average sales point to room for another store, an extra sales rep, or more ad spend.
Tech teams can use the open API to connect Maptive iQ with live dashboards or supplier feeds. As new competitor stores open or market share changes, your internal map updates automatically. Link sales figures, delivery schedules, or supply chain routes, and anyone on your team can see who owns which zone.
You can color-code markets by performance, mark weak rivals, watch for upstart brands, and direct your energy where the most future growth lives. This leads to more smart planning and less waste.
A few details matter if you sit in the office making calls or run a field team that hates waiting for laggy maps. Maptive iQ now runs on WebGL. This means maps load with hundreds, even thousands, of service routes, store locations, or customer addresses without freezing. The performance lets your team work with more data, and not lose half the day staring at a loading screen.
Real-time collaboration is part of the package. Several people on your team can edit one map at once. Changes show up for everyone, live. Managers turn staff access on or off with a click, using a simple control panel. Audit trails let you follow who made which call, which keeps the work honest.
The split-screen view means you test territory setups and see numbers update instantly. For managers trying different store area plans, this is faster than old exported workbooks or PowerPoint rounds. You get fewer mistakes when everyone can see the true changes as they go.
For companies needing specialized work, think construction, urban planning, or large property managers, Maptive will soon offer 3D visualization through point cloud data. That is coming in the next phase, but is worth mentioning for buyers needing heavy-duty options.
Offline work mode is coming in 2025. You will be able to load maps and work when your connection is down and sync the changes once you are back online. Data packages aimed at researchers and analysts will roll out soon after, with new stats tools.
You need decisions to be based on reality, not guesswork or hope. Maptive works where you run out of patience for reports that do not add new detail. These five map types mean you do not have to ask yet another analyst to pull an extra summary. You see the numbers and the layout at the same time you tweak a region or filter customer data.
For a retail chain, You can quickly see where your customers drive from, how locations link to their homes, and where competitors draw the line. If the market gets saturated over time, you do not chase sunk costs; instead, you pull the lever where your rivals are weak.
For service companies: You move delivery lines or repair zones so you do not pay for drivers to zigzag across town. You know new construction will change demand, so with live demographic shifts, you adjust before you get undercut.
For teams that do not sit in the same office, you grant access for map edits. You limit errors, keep all hands on track during busy times, and react to market moves within the hour, not next quarter.
For boards and investors: Maps become more than pictures. They give you the total of “where the growth is hiding” and show what might happen with every scenario you check.
Pull in your customer file, your sales regions, or list of candidate sites. Set your filters: drive time, income range, age bracket, customer type. Use AI site scoring to rank locations. Flip boundaries and polish sales zones in the split view, watching totals shift as you move the lines.
Upload competitor locations to check market risks. Use WebGL to display all your stores, rivals, and customers at once, no lag, no frozen screens. If your team is large or on the road, give access with two clicks. Plan for repairs or service calls using drive time calculations up to four hours.
Report to leadership with the split-screen, using live demographic layers. Show every scenario as it happens. Share links or static reports if needed for documentation.
The people in the big chairs do not want more theory. They want options backed by data that is updated and clear. Maptive iQ lets you use these five map strategies: drive time, real-time demographics, AI site scoring, flexible territory planning, and market saturation checks. Each tool takes only a few clicks to set up. Each one leads to answers that matter to your bottom line.
You can keep guessing, or you can see the rules of your market as they are, even as they change each week. Most people stare at data and hope. Executives who win use tools that turn maps into action. Maptive iQ does that job.
Brad Crisp is the CEO at Maptive.com, based in Denver, CO and born in San Francisco, CA. He has extensive experience in Business Mapping, GIS, Data Visualization, Mapping Data Analytics and all forms of software development. His career includes Software Development and Venture Capital dating back to 1998 at businesses like Maptive, GlobalMojo (now Giving Assistant), KPG Ventures, Loopnet, NextCard, and Banking.