
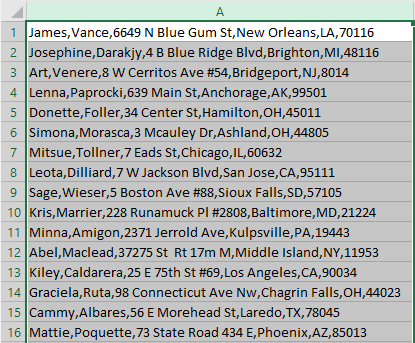
You have a list of customers and leads in an Excel spreadsheet, but the entire address including their first name, last name, street number, street name, and zip code is all in the same column.
A long string of text like this isn’t very useful when you’re trying to sort your data, or you just need to extract one part of the address.
Maybe the tool you’re using to collect this info just outputs .xlsx files that way, or someone sent you the list and didn’t take the time to separate the data. Either way, it’s a common problem that needs fixing before you can get the most out of the information.
Luckily, it’s fairly easy to split addresses and other data apart without using any complicated Excel formulas.
How to Separate Addresses in Excel
Follow the steps below to parse address data in Excel:
Select Your Column: Click the letter above the column you want to separate to highlight the entire column:
Convert Text to Columns: Click “Data” along the top of the screen, then click the “Text to Columns” feature from the formula bar:
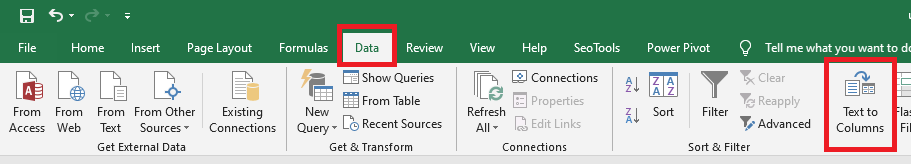
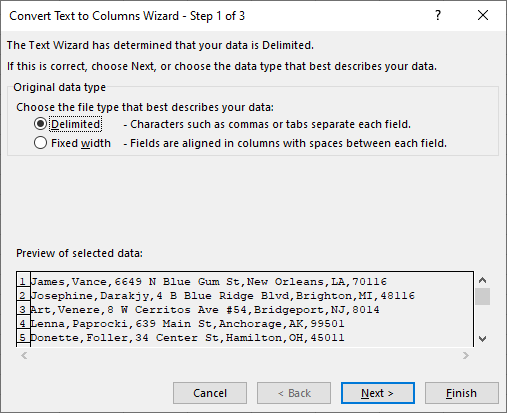
Choose How to Separate Your Data: Within the Text to Columns Wizard, choose the delimited option, then click the next button:
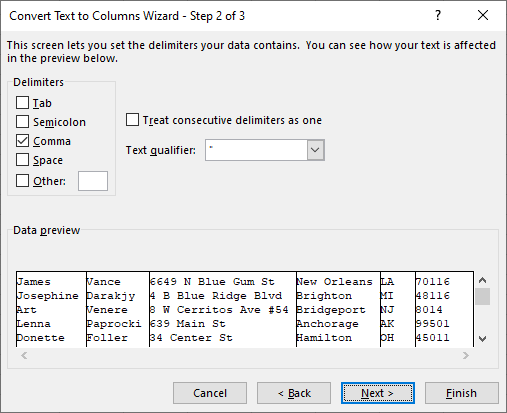
Choose Your Delimiters: For addresses separated by commas (example: 123 Main St., New York City, New York, 10001) choose comma delimiters. This means new columns will be created in place of the commas. You can also select tabs, semicolons, or spaces and split your text string that way if you prefer:
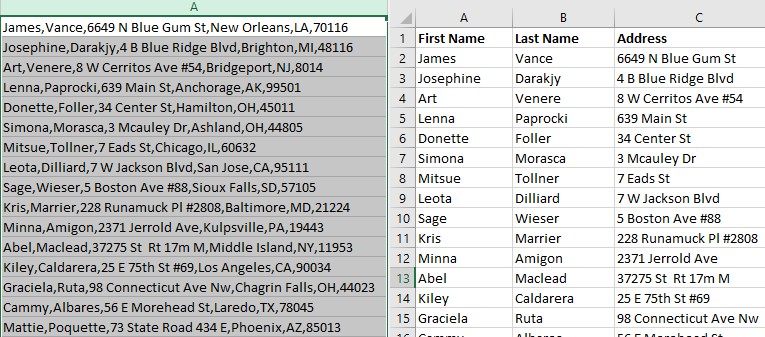
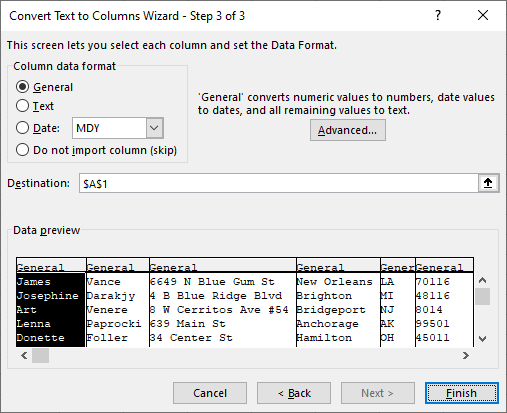
Preview Your Columns: Excel will show you a preview of how your columns will look. If everything appears correct click “Finish.” If you want to make changes, click “Back.”:
Create Headers for Your Data: Create headers at the top of each column (name, address, city, state, etc.). This step is necessary if you plan to upload your data to mapping software.
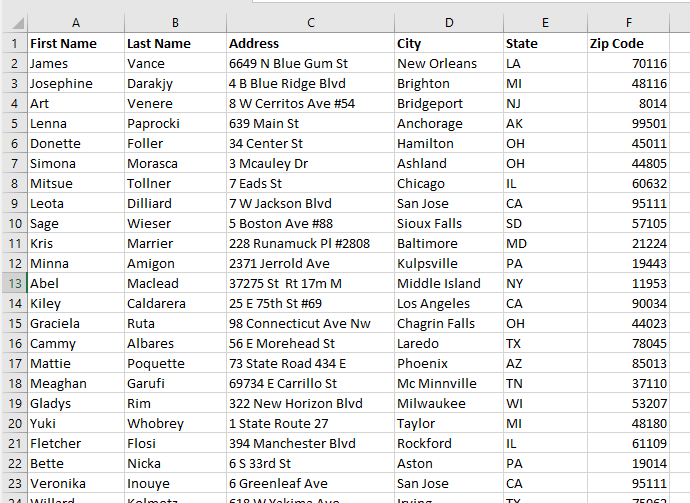
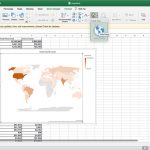
With your information separated it will be much easier organize your data and plot the locations of your customers and leads.
How to Visualize Your Data with Maptive
Once this process is complete, upload your location data to Maptive and instantly plot it on an interactive map.
Here’s how to do it:
- Sign Up to Maptive: Create a Maptive account and start your free trial to explore our many mapping tools.
- Create a New Map: Log in and select “Create My First Map.”
- Name Your Map: Enter a name and description for your map, then click “Continue.”
- Upload Your Data: You can enter your data manually, copy and paste it into Maptive, or upload an Excel spreadsheet directly to our software.
- Plot Your Location Data: Click “Map” in the top left corner to view your map and plot your addresses.
In addition to addresses, you can also include information like names, emails, phone numbers, sales, and more. This information will appear as a popup when you click on the map marker for that address. Just make sure to separate each data point into its own column with the proper header when you upload your spreadsheet.
Maptive also offers a wide range of tools that allow you to customize your map, including:
As you can see, once your addresses are properly split beautiful interactive maps are just a few clicks away. Sign up for a free trial account and start mapping today.


