Dot density maps are one of the most common maps we use to visualize the concentration of a specific demographic or type of business or building in a given area.
What is a Dot Density Map?
Dot density maps are a type of data visualization that uses dots as a symbol to represent individual data points. The dot placement on the map can communicate a lot of information about the data, such as its density or distribution.
Every dot on a dot density map can represent either a one-to-one or one-to-many value. That might sound confusing, but it’s really very simple:
- In a one-to-one dot map, each dot represents the actual locations of an individual business, building, data point, or occurrence of a phenomenon.
- In a one-to-many dot map, each dot represents aggregate data values. This becomes very helpful when the amount of individual data points becomes too great to be displayed individually.
It might be helpful to know that dot density maps are sometimes also referred to as dot distribution maps. They are ideal for seeing how things are distributed over a geographical region and the relative density of data sets.
If you are looking for the best tool to create a dot density map, Maptive is world-class mapping software that offers a variety of features that make the process easy and efficient.
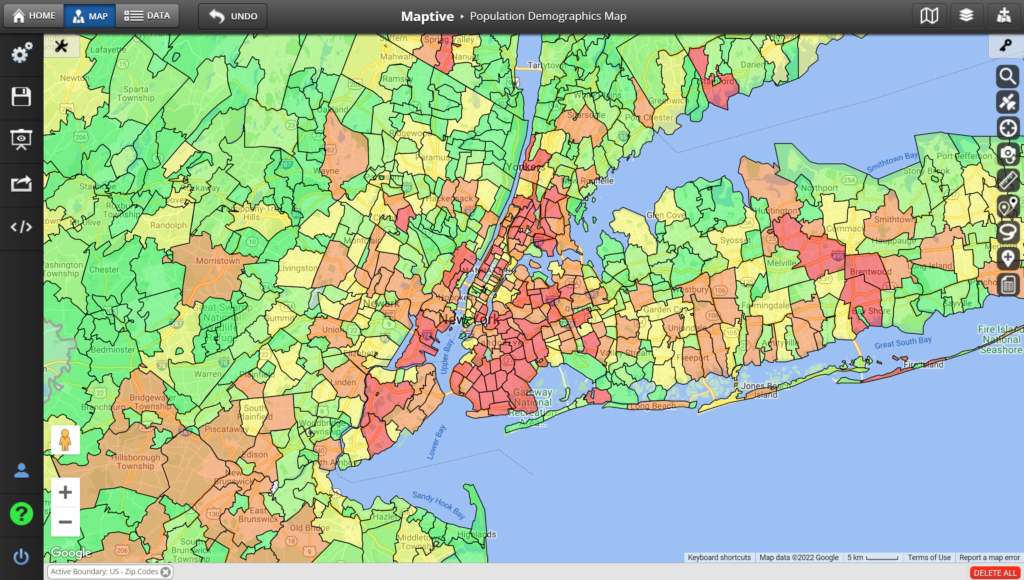
#1 – Dot Density Map for Urban Planning
Dot density maps come in very handy when, for example, we are trying to quickly grasp where the majority of a certain population lives. When looking at the dot density map of a city’s population we can easily tell that the vast majority of people are concentrated within the city borders and as we pan out into the suburbs the dots appear further apart, indicating that those areas are less densely populated.
Urban planners can rely on dot density maps to monitor shifts in densest areas across states and counties, and determine the need for new infrastructure, parks, schools, and more public services.
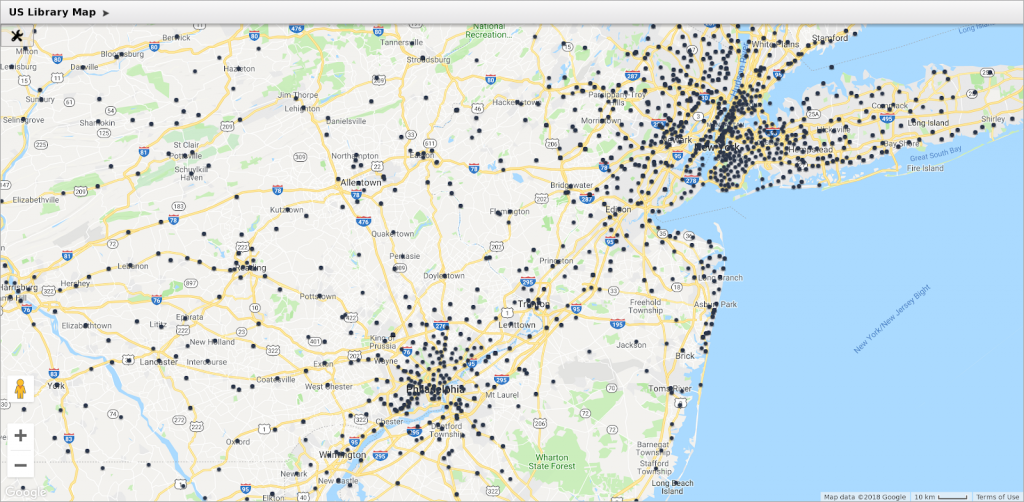
#2 – Dot Density Maps for New Business Planning
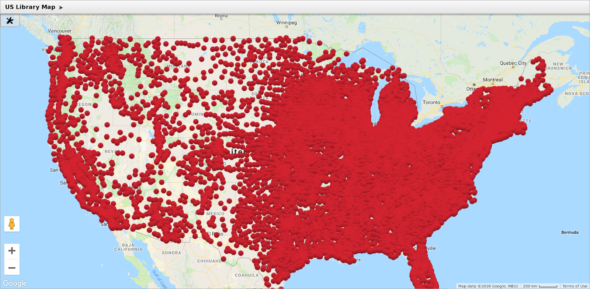
Dot density maps can also be crucial in business planning. Say that, for example, you plan on opening a new location for your bookstore franchise; one of the factors you’ll be considering is the proximity to similar businesses and how many libraries are present in a given neighborhood.
With a dot density map, the individual points mapped will quickly reveal how many competitors are present and areas that might be underserved.
You are able to easily visualize which neighborhoods might have fewer destinations for book lovers, making your business decision easier and setting your future location up for success.
#3 – Dot Density Maps for Business Strategy
Businesses can rely on a dot distribution map to determine if they should launch a new marketing campaign or hire more salespeople to capitalize on an opportunity.
For example, if you are selling hiking gear and a dot density map reveals that the majority of the population within driving distance of your store is under 35 years old, you might choose to advertise on social media channels that attract users in that age range like TikTok and Instagram.
By that same logic, if you look at a distribution map of your competitors and realize that there are fewer of them, you might decide to boost your sales team so they can capture the territories of your former business rivals.

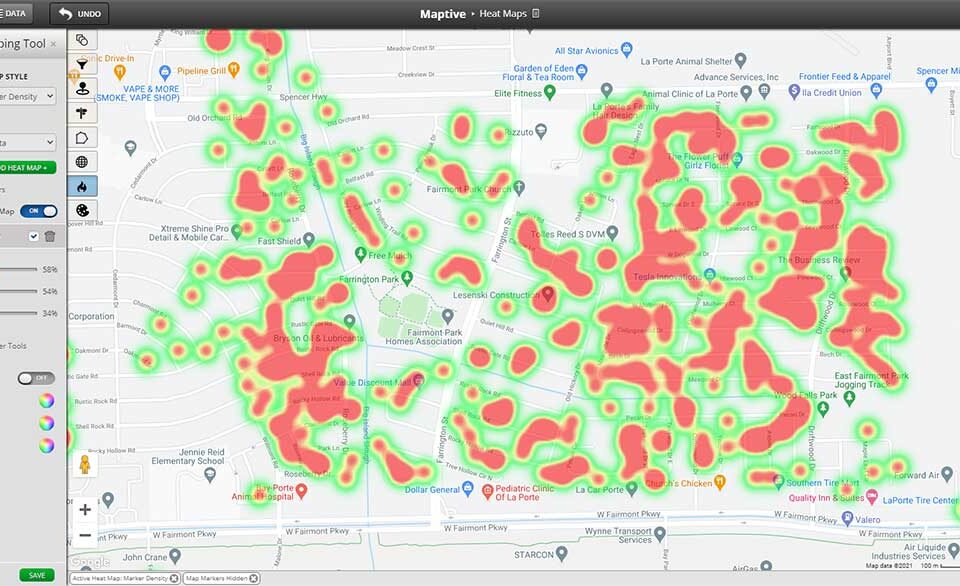
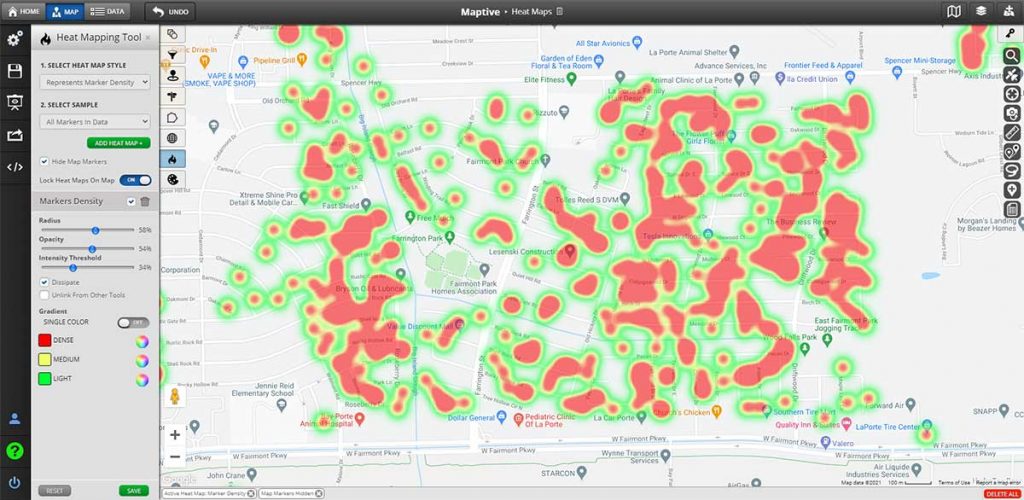
How Can You Create Dot Density Maps with Maptive
Thanks to Maptive, creating dot density maps has never been easier.
Step 1: Create a Maptive account. Signing up is free and easy, so you can experience all the platform’s tools and features at no cost.
Step 2: Upload your location data. You can use your own data, and it doesn’t matter whether it’s on a spreadsheet or other file type. You can even copy-paste it directly into Maptive.
Step 3: Transform your markers into dots. With Maptive, you can customize the map markers representing your location data into anything you’d like–but for creating a dot distribution map, you should be using dots.
Step 4: Generate your map. Now you have an easy way to visualize your data on a map so you can effortlessly identify trends and patterns that can help your business or research projects.
Step 5: Share your map with others. Dot density maps built with Maptive are easy to share or embed and can be customized to fit the specific needs of your business or organization.
The Benefits of Dot Density Maps
While it ultimately depends on your business goals, using dot density maps can yield many benefits.
- They are a powerful tool to visualize data and provide an immediate snapshot of spatial patterns and dot locations even if you started with very different data sources.
- Map readers can use the dot placement to understand everything from population density to consumer spending habits.
- The geographic distributions of the dot values can help businesses and organizations gain profound insights into their customer base or target market.
- Dot density maps generated with Maptive software are easy to share and can be customized to fit the specific needs of any business or organization.
Put simply, whether you are a business owner, marketing professional, sales leader, urban planner, or researcher, dot density maps are the perfect tool to visualize data, trends, and patterns.
They can help you gain insights that would otherwise stay buried deep into your excel sheets.
With Maptive software, dot density maps are easy to create and customize, making them the perfect tool for any business or organization looking to understand their market better.
Try using Maptive to create dot density maps today and see the benefits for yourself!
Ready to get started?


