
“A picture is worth 1,000 words.”
You know the phrase. It’s the belief that an idea, story, or concept can be explained or conveyed with one single image. You’ve probably heard or used it in conversation yourself more times than you could count, but have you ever thought about how it could apply to your business? Consider the following statistics shared in a blog post published last year on the power of visuals:
- The brain can see images that last for just 13 milliseconds.
- Our eyes can register 36,000 visual messages per hour.
- We can get the sense of a visual scene in less than 1/10 of a second.
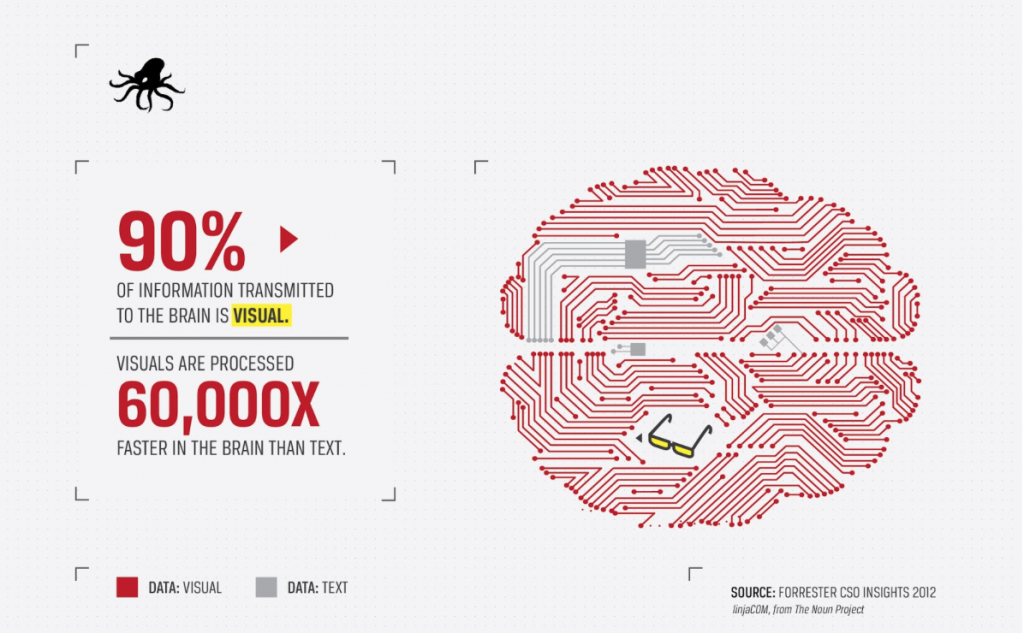
- 90% of information transmitted to the brain is visual.
- Visuals are processed 60,000X faster in the brain than text.
As a society, we turn to and rely on visuals when we want to be entertained, when we want to socialize with others, and when we want to learn.
If you’re looking for ways to better communicate, educate, or connect with your current and prospective customers, your employees, or your investors, one great way to do it is by taking the time to visualize the raw data you collect and share.
Here are 6 powerful reasons why your business should visualize data:
1. Visuals are processed faster by the brain
Our brains have the ability to process visuals a lot faster than text. It’s been reported that 70 percent of all our sensory receptors are in our eyes, and that we can usually get the sense of a visual scene in less than 1/10 of a second. That’s a lot faster than how long it typically takes us to read and comprehend text-only information. The world has caught on to this fact, and as a result, the use of visualized information has increased by 400% in literature since 1990, and by a whopping 9900% percent on the internet since 2007.
Source: http://blog.thestarrconspiracy.com
2. Visuals are committed to long-term memory easier than text
Visuals are powerful when it comes to our ability to remember information. As infants, we’re able to see and process visuals before we’re able to read or speak. Understanding visuals comes naturally to us. As a result, we’re able to start storing visual memories at a very young age—and can remember and recall some of them throughout our entire lives as we age. This is because our brains can commit visuals to long-term memory a lot easier than text. According to one article, “words are processed by our short-term memory where we can only retain about 7 bits of information (plus or minus 2). Images, on the other hand, go directly into long-term memory where they are indelibly etched.”
3. Visuals can tell stories
Visuals have been used throughout history as tools to help us tell stories. Today, you can find visuals everywhere—in the films you watch, on the albums you listen to, in the books you read, in the advertisements you see, and on the websites you visit. Brands, agencies, authors, entertainers, bloggers, artists, teachers, and politicians all use visuals as a way to connect with people on a deeper human level. When it comes to presenting data to others, it can be hard to get your point across and make the argument you’re trying to make. But when you visualize your data, you can paint a better picture in the minds of the people you’re trying to inform and give them something that they can have an easier time relating to.
Here’s a great example that illustrates the growth and expansion of Walmart in the U.S. from 1960 to 2006:
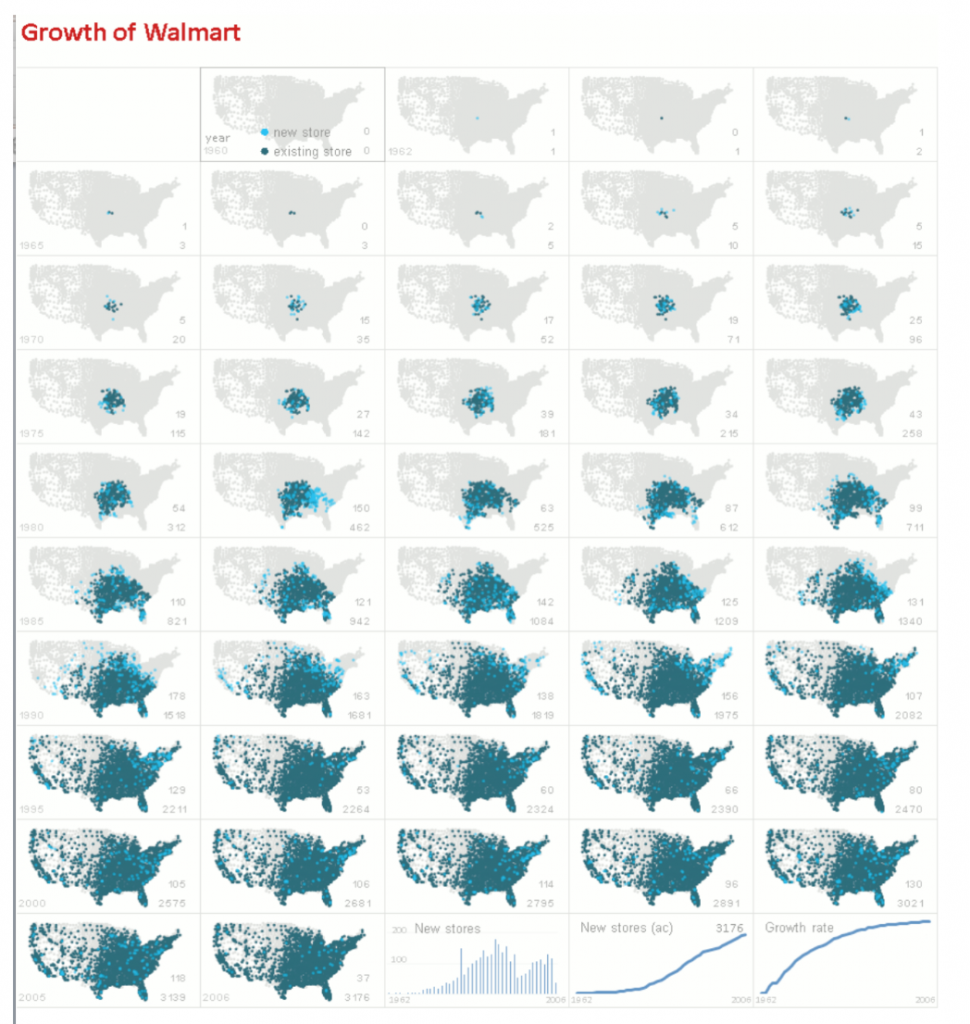
The Growth of Walmart from 1960 to 2006 (Source)
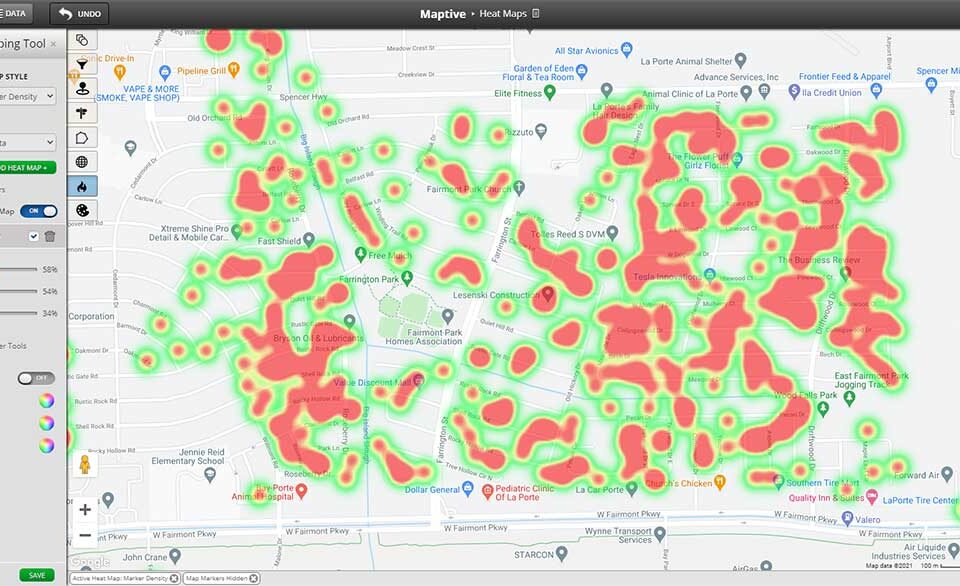
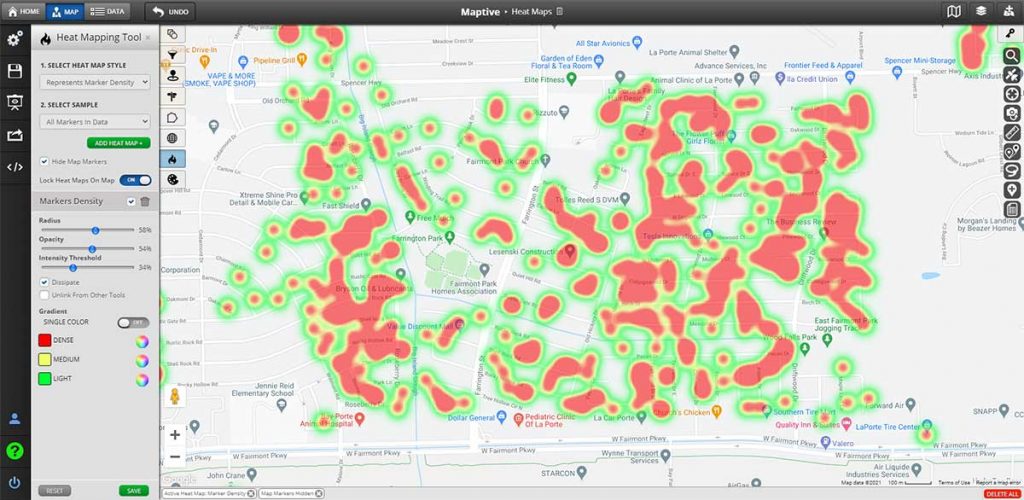
4. Visuals can reveal patterns, trends, changes, and correlations
Have you ever tried to identify patterns while looking through hundreds if not thousands of lines in a spreadsheet? It’s not easy! By taking the time to map out data visually, it’s not only a lot easier to digest and interpret information, it’s also a lot easier to find and recognize important patterns, trends, and correlations which would have otherwise been nearly impossible to see.
5. Visuals can help simplify complex information
Visuals can make sharing a large amount of data all at once with your audience a lot easier. This is especially true when you’re presenting information and findings to parties who weren’t as closely involved in working with the data as you were.
Here’s a great example that illustrates the varied success of films released between June 2007 and February 2008:
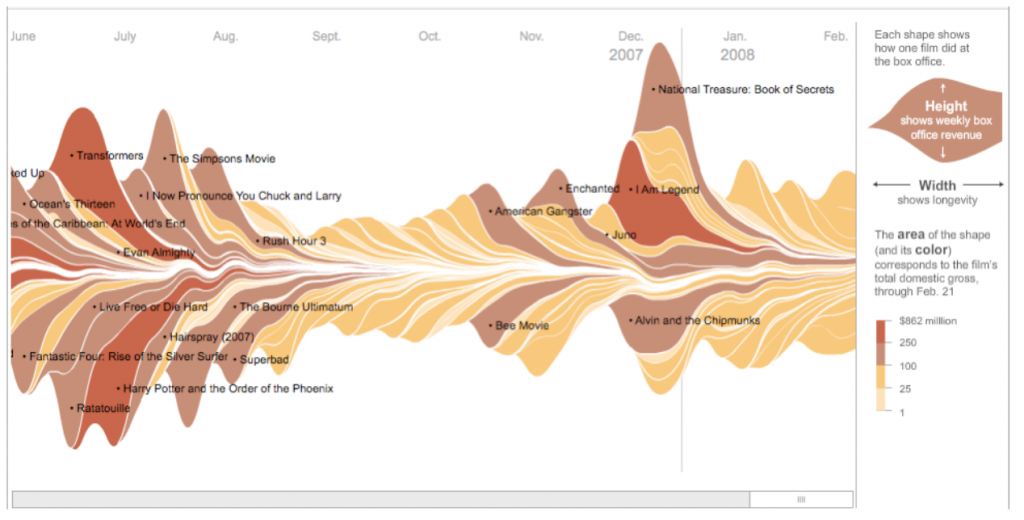
Source: http://uxmag.com/articles/its-about-time
6. Visuals can often be more effective than words at changing people’s minds
Finally, it’s been proven that visuals can be a lot more effective at persuading people and changing their minds than words. In 1986, a 3M-sponsored study at the University of Minnesota School of Management found that presenters who use visual aids are 43% more effective in persuading audience members than those who didn’t use visual aids.
Do you visualize data at your business? If so, tell us about it in the comments section below. We’d love to hear what kind of data you visualize, why you do it, and how it helps your business.


