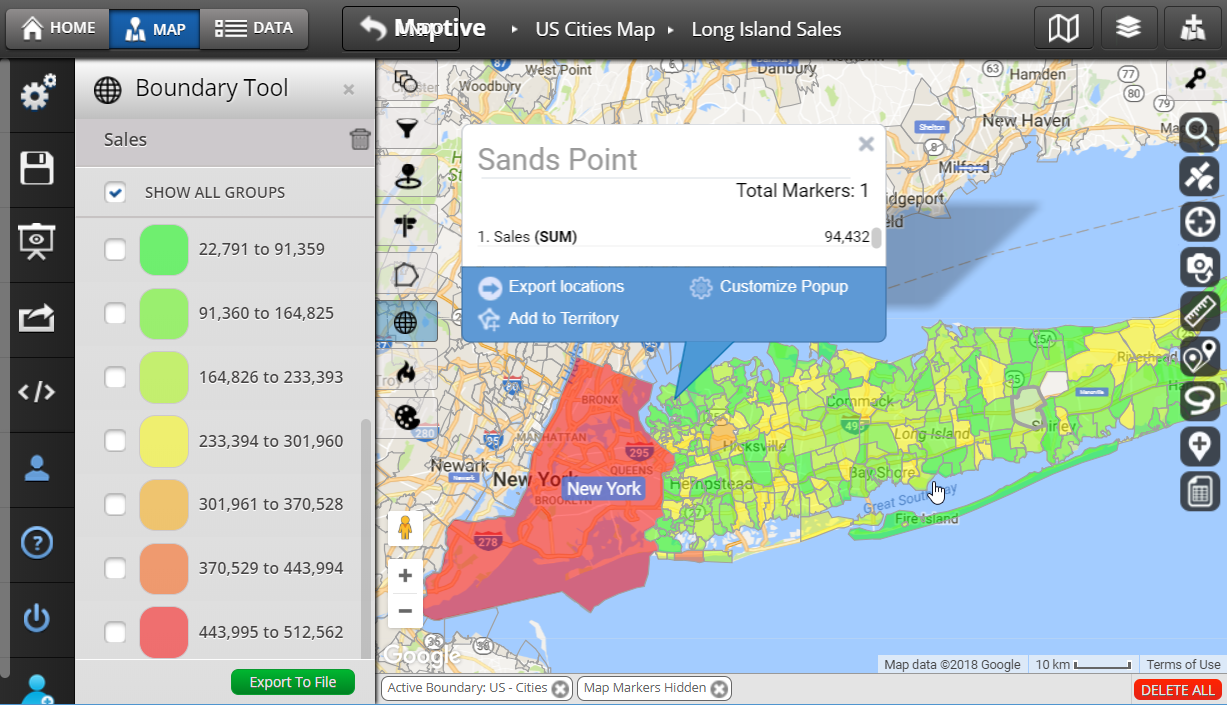
Display US cities on a Map Using Maptive
The US City Boundaries are part of Maptive’s boundary tool, and provides the outline of approximately 30,000 cities and towns in the United States of America. With this tool you can display the borders of the cities or you can color them in based on your spreadsheet data.
It is just as easy to set the colors of the US city boundaries based on your own data. This can help you create informative maps that let you see patterns in your spreadsheet data that you might otherwise easily miss. The city mapping software also makes an effective presentation tool. You can take images of the map and add them to a PowerPoint presentation or show the live map in a meeting to quickly and effectively make your point.
Create a US City Map using the following steps:
- Create a Trial with Maptive
- Click “Create My First Map”
- Name Your Map then click “Continue”
- Upload your Data or Start with a Blank Map
- Go to the Boundary Tool and select US Cities
- Click “Add Boundary”
Aggregate your data into City boundaries
If you chose to load your own spreadsheet data you can link it to the cities by selecting either “My Group Data” or “My Numerical Data” in the “Boundary Fill Type” drop down menu. After you have connected your data to the map, Maptive will automatically map your data and choose colors to fill in the cities where you have data. Maptive can also aggregate multiple lines of data into one city. This allows you to click on a city and see your aggregated data. Information like total sales in a city and number of locations in a city are some of the most popular data aggregations in Maptive. However we can aggregate any numeric or text data in your Excel spreadsheet. For step by step instructions on how to use all the features of the boundary tool click here.