County Map Maker from Maptive
Create completely customizable & interactive maps of US Counties using Maptive’s Geographic Boundary Tool.
How to Create a US County Map with Maptive
County maps are a valuable asset to a lot of different businesses and industries. Because of most counties’ size, many companies use them as the basis for their sales territories. Dividing a map into counties also allows you to analyze the demographics of that region.
Maptive’s cloud-based mapping software allows you to build interactive county maps in minutes. Use our many mapping tools to create sales territories, analyze local demographics, track the county’s sales data, and more.
What Are Counties?
Most US states are divided into geographic regions known as counties (Louisiana and Alaska refer to these as boroughs and parishes). Each county has its own form of government and administration, and the nature and powers of these governments vary from state to state.
There are currently 3,143 counties in the United States.
What Can You Do with US County Maps?
A US counties map serves many purposes, but the two primary functions for businesses are:
- Creating Sales Territories: Counties are often the ideal size for sales territories, so using these established boundaries is a quick and easy way to create territories for your business. Sales territories offer several benefits, such as creating an even playing field for sales reps, ensuring better customer service, and easily tracking different regions’ performance.
- Analyzing Demographics: Dividing your map this way makes it easy to analyze citizens’ demographics at the county level, including population, education levels, income, and housing. This information allows you to understand your customer base better, more effectively target your marketing, and make more informed decisions about where to place new stores.
Why Should You Choose Maptive?
Maptive offers a user-friendly interface and dozens of tools, which is why so many businesses choose our software to create their US county maps.
When you use Maptive, you’ll enjoy a number of advantages, including:
- Demographic Data Included: There’s no need to purchase additional data packages. Maptive comes with 10 different types of US demographic census data that can be incorporated into your map.
- Many Different Mapping Tools: In addition to county maps and demographic data, Maptive includes a number of valuable features, such as heat maps, optimized routes, distance radii, a filter tool, satellite maps, and more.
- Cloud-Based: Maptive is entirely cloud-based, meaning you can access your map anywhere from any device. Updates happen instantaneously and are viewable by your team in real-time.
- Easy to Share: Once your map is complete, create a link to share with your team, embed your map on a website, or export your data to a spreadsheet.
Creating US County Maps with Maptive
Maptive’s GIS software makes creating county maps simple. Just follow the steps below to create beautiful interactive maps in minutes:
Step 1: Sign up for a Maptive free trial account. Try Maptive for free and explore the many map features we have to offer.
Step 2: Upload or input your data. You can upload data directly from your data source, including a Google or Excel spreadsheet, or copy and paste your data into Maptive.
Step 3: Select “Create Map” to view your map. Your location data is now plotted on a beautiful interactive map.
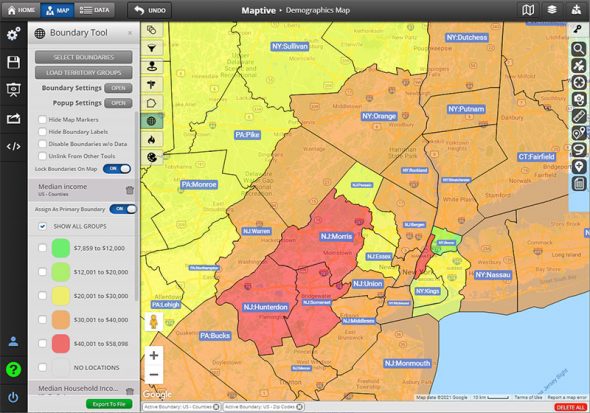
Step 4: Select the boundary tool. Click the tools icon in the upper lefthand corner, then select the Boundary / Geographic Territory Tool from the menu.
Step 5: Select “US Counties.” Under “Select Boundary Type,” select “US Counties.”
Step 6: Select your boundary fill type. Choose what type of data you’d like to display inside each county.
Your choices are:
- No Fill: Choose this if you don’t want to display any data.
- My Numerical Data: Choose this to display any data you have that’s located within that county.
- My Group / Territory Data: Choose to display data from your groups or territories.
- Marker Count / Location Density: Choose this to display the number of markers located within a county.
- Demographic Census Data: Choose this to display demographic insights.
Step 6: Select your boundary fill data. If you selected “My Numerical Data” or “My Group / Territory Data,” you’ll need to choose what data you’d like to display inside each county. Your choices will depend on the data you’ve uploaded to Maptive.
Step 7: Select your demographic group. If you selected “Demographic Census Data,” you’ll need to select which demographic group you want to display. Your options are:
- Population
- Race
- Housing
- Age
- Citizenship Status
- Education
- Income
- Transportation
- Labor
- Gender
Step 8: Click “Add Boundary.” Click “Add Boundary” to create your US County Map.
Get Started with a Free Trial Account Today
Are you ready to start creating US county maps? Create your free trial account and start mapping today.
Start Your Free, No Risk, 10 Day Trial
No credit card required. No surprises. Just Results.

