
All successful businesses, from small startups to conglomerates, need to understand their market and its dynamics. And market research is an indispensable tool to gain a competitive edge.
But traditional market research methods often fall short when it comes to analyzing complex geographic data and extracting meaningful insights.
That’s where sales mapping software tools come in.
Sales territory mapping software is a game-changer for businesses of all sizes. It provides powerful tools to visualize and analyze business data in a spatial context.
Benefits of Using Map Software for Market Research
Customer Segmentation
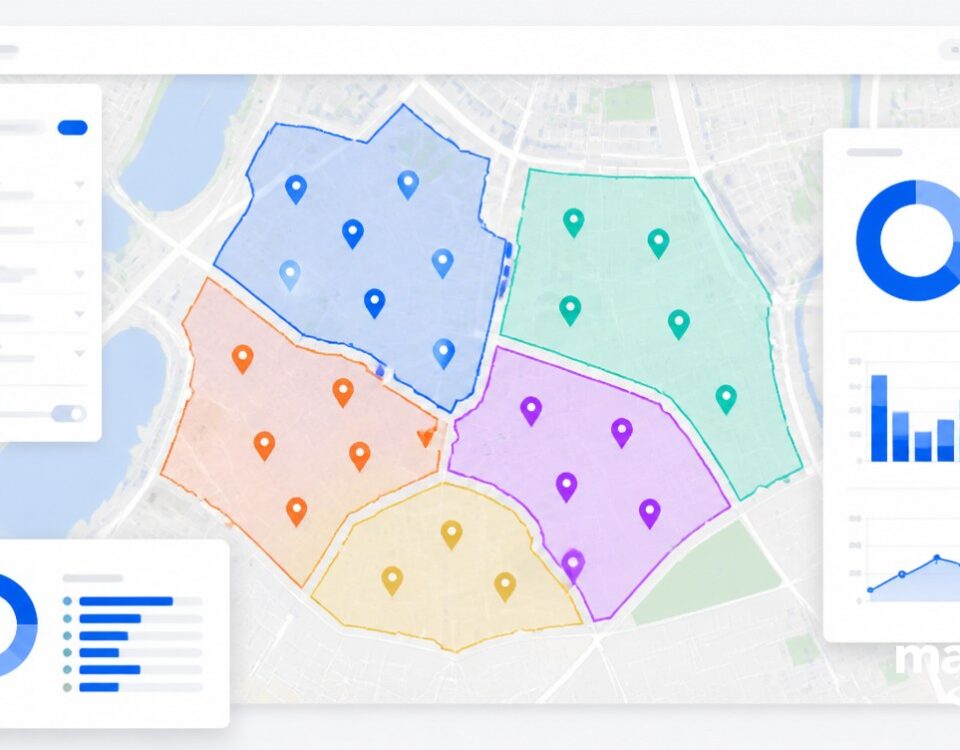
Sales territory mapping software is the perfect tool if you’re trying to segment your customers by demographics, behavior, and other factors. By overlaying customer and business data onto maps, you’ll be able to identify clusters of customers with similar characteristics–which can then help them tailor their marketing strategies, develop personalized messaging, and target specific customer groups with precision.
Demographic Analysis
Also known as the holy grail of sales strategy. Sales mapping software offers insights into population distribution, age groups, income levels, and other relevant demographic factors within sales territories. You can then use that information to identify areas with high concentrations of target customers, niche markets, potential growth markets, or underserved regions.
Data Visualization
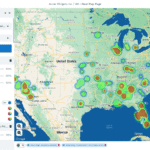
Are you trying to identify trends, patterns, and relationships in your data? Then mapping software can help you uncover what might otherwise go unnoticed. Seeing business data displayed on a map can lead to quicker and more intuitive insights, essentially transforming raw data points into actionable information.
Competitive Analysis
Knowing where your competitors are and how you compare to them can make or break businesses. With sales mapping software, your sales team can visualize the spatial distribution of competitors and their market influence across sales territory. You can then use those insights to identify growth opportunities in areas with less competition, untapped markets, or areas where competitors have a stronghold.
Geospatial Analysis
Sales mapping software can help you integrate location-based data with other business data points. This can help you uncover correlations and spatial relationships that drive market dynamics and increase sales productivity.
Types of Map Software for Market Research
Mapping software can help companies visualize business data, identify trends, and make better decisions–capabilities that make it an essential tool for sales teams, marketing managers, and business strategists.
There are three main types of mapping software:
- Geographic Information System (GIS) software: the most comprehensive type of mapping software. It offers advanced spatial analysis tools and it is well-suited for large-scale market research projects that involve complex data points analysis.
- Data visualization tools: they focus on transforming raw data into compelling visual representations. These tools are valuable for creating visually impactful maps and infographics for market research reports or presentations.
- Online mapping platforms: a cost-effective solution for visualizing and analyzing relevant data. They are a great resource for businesses of all sizes across a variety of industries.
Which one might be the best sales mapping software depends on your specific needs. However, among these options, Maptive is a particularly noteworthy mapping software with market research capabilities.
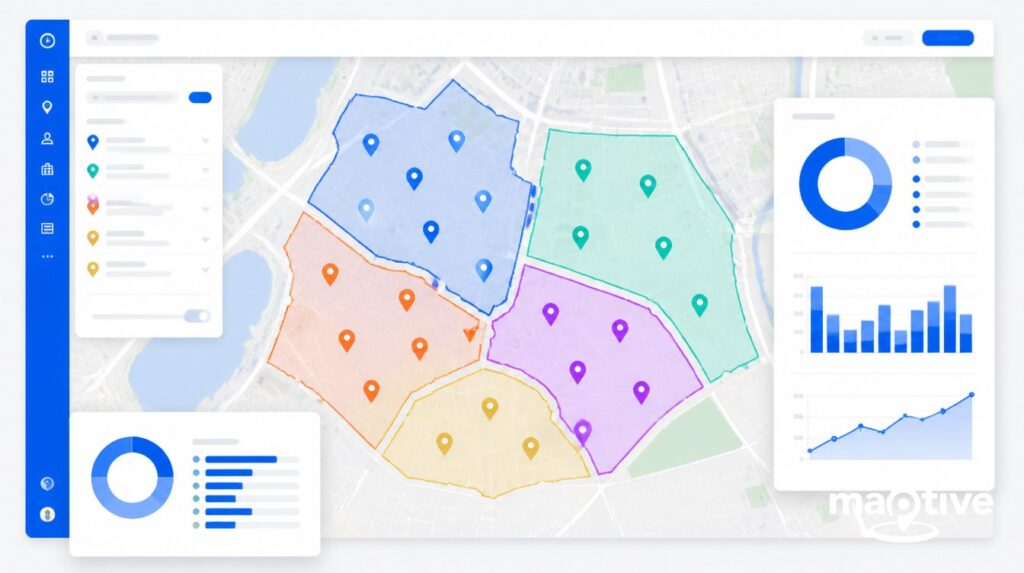
It offers all the features expected from a free sales mapping software while also providing a user-friendly interface, intuitive features, and a range of functionalities specifically designed to support market research endeavors.
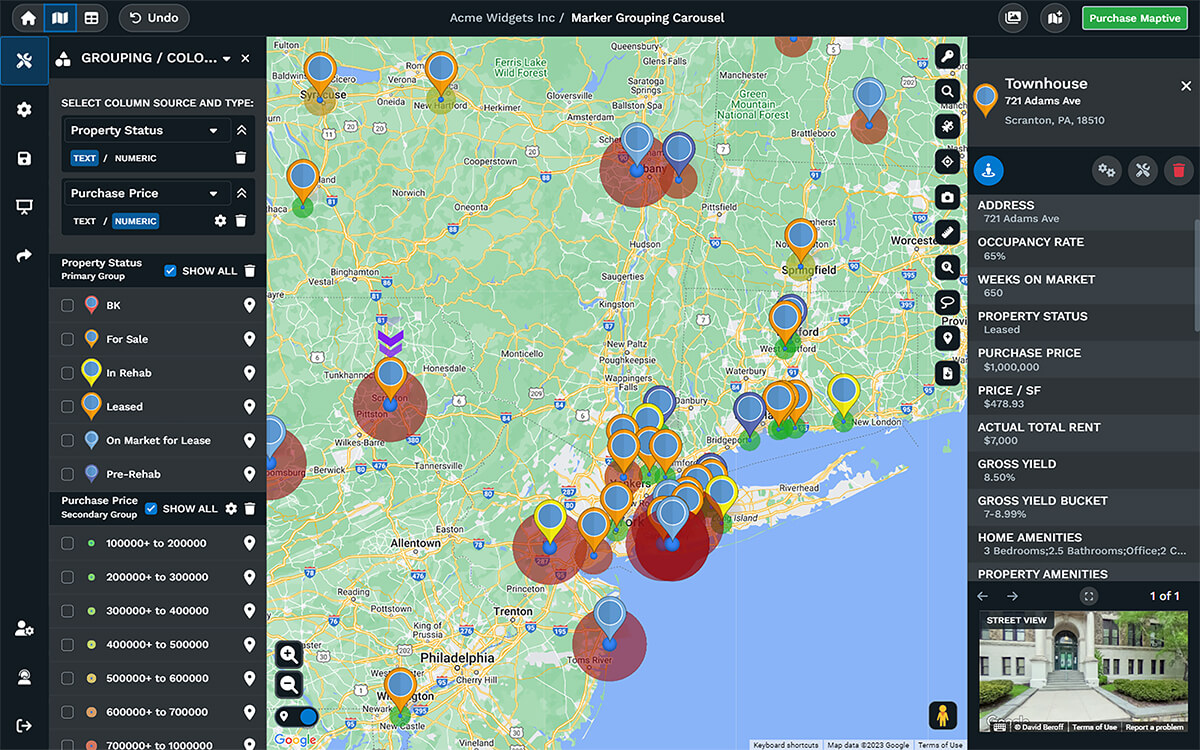
With Maptive, businesses can easily import their own data in, visualize it on interactive maps, apply various filters and overlays, and conduct basic spatial analysis. It also provides robust features for customer segmentation, demographic analysis, data visualization, and competitive analysis.
How to Use Mapping Software for Customer Segmentation
Step 1: Define segmentation criteria.
Common segmentation factors include age, gender, income level, buying behavior, geographic location, or psychographic characteristics. Choose the criteria that are most relevant to your business and align with your marketing goals and sales territory.
Step 2: Visualize customer data on the map.
Once the customer data is imported and segmented, the sales mapping software will allow you to visualize your own data on an interactive map. You will be able to see clusters and patterns of customers in specific areas, understand the geographic distribution of your customer segments, and identify sales territories with high or low customer density.
Step 3: Analyze segmented customer groups.
Using the sales mapping software’s analysis tools, you can apply overlays on the map to represent additional data, such as average purchase value or customer lifetime value. This analysis will help you identify unique traits, preferences, or trends within each customer segment.
Step 4: Create targeted marketing lists.
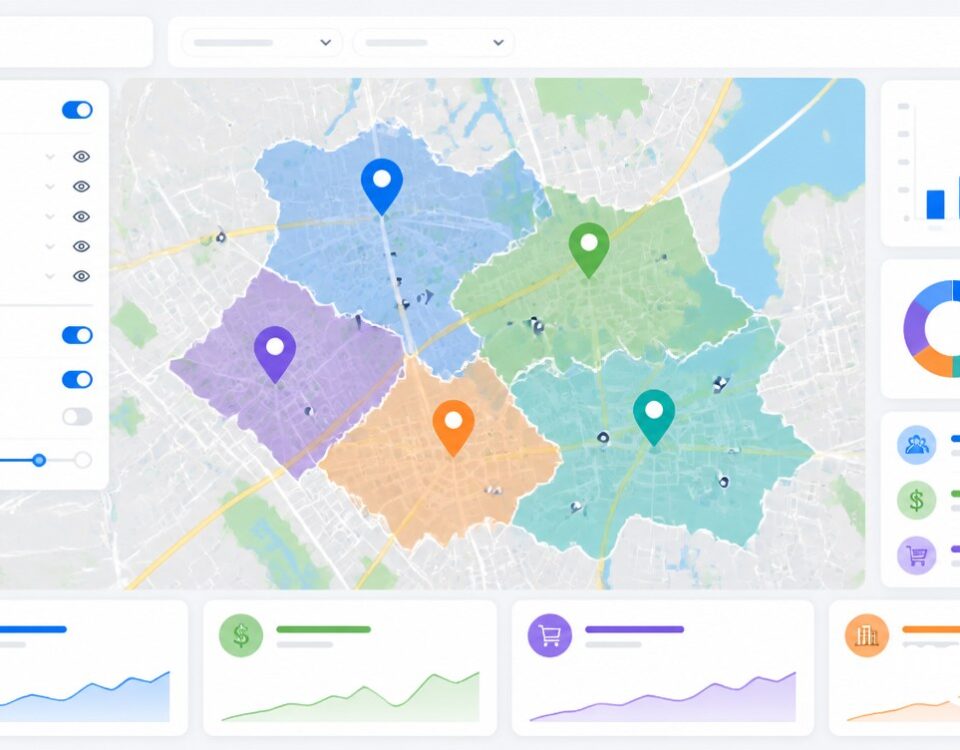
Select specific geographic areas or draw boundaries on the map to define the target regions for each customer segment. The mapping software should provide options to generate lists of customers within those sales territories, which you can then export for personalized marketing campaigns, tailored messaging for sales teams, or targeted advertising and marketing efforts elsewhere.
Step 5: Monitor and refine the segmentation strategy.
Customer segmentation is an ongoing process, and it’s essential to monitor the effectiveness of your segments and refine them as needed. Continuously evaluate the performance of your marketing campaigns, measure customer responses, and gather feedback. Integrates sales data and adjust your segmentation criteria if necessary.
How to Use Mapping Software for Demographic Analysis
Step 1: Gather demographic data.
This may include population density, age groups, income levels, education levels, or other demographic factors corresponding to a sales territory. Ensure that your own data is accurate and organized in a format compatible with the mapping software.
Step 2: Map customer locations.
Import your customer data into the sales mapping software. The software will geocode the addresses or coordinates to plot customer locations on an interactive map across your sales territories.
Step 3: Overlay demographic data.
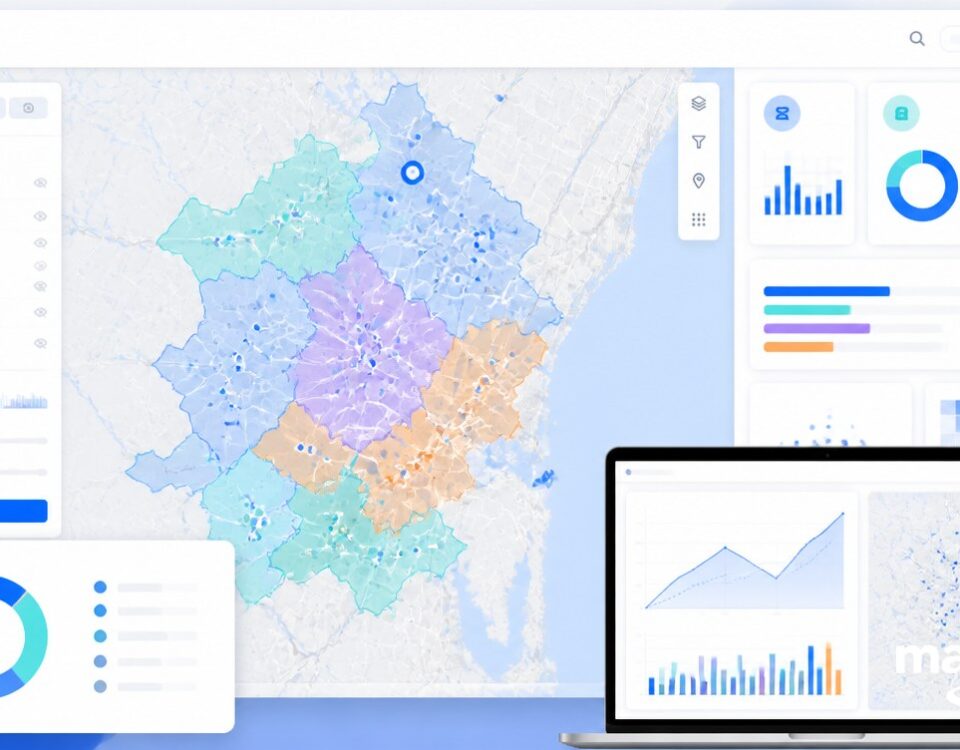
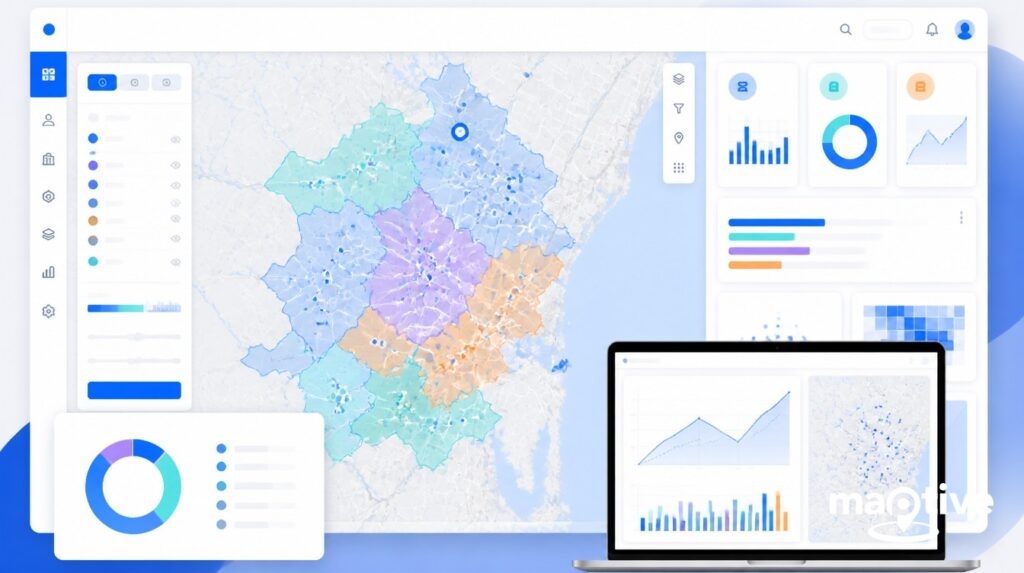
You can use the sales mapping software’s capabilities to overlay the demographic data onto the map. The marketing mapping software will then display the demographic information as color-coded or thematic overlays on the map. For example, you can visualize income levels by shading areas with different colors to indicate high, medium, or low income ranges.
Step 4: Analyze demographic patterns.
Look for concentrations or disparities in demographic characteristics across different geographic areas. Identify sales territories with specific demographic profiles that are of interest to your business or sales territory management team.
Step 5: Identify market trends.
Analyze the relationships between customer locations, demographic data, and other factors of interest. Overlay additional data, such as customer demographics, purchasing behavior, competitor locations, or market performance metrics, to gain deeper insights. Look for correlations or patterns between demographic variables, business locations, and market dynamics.
How to Use Mapping Software for Data Visualization
Step 1: Import data.
Identify all the data you want to visualize and import it into the sales mapping software. Marketing mapping software tools usually provide all the features for user-friendly import options and spreadsheet data manipulation tools.
Step 2: Create maps.
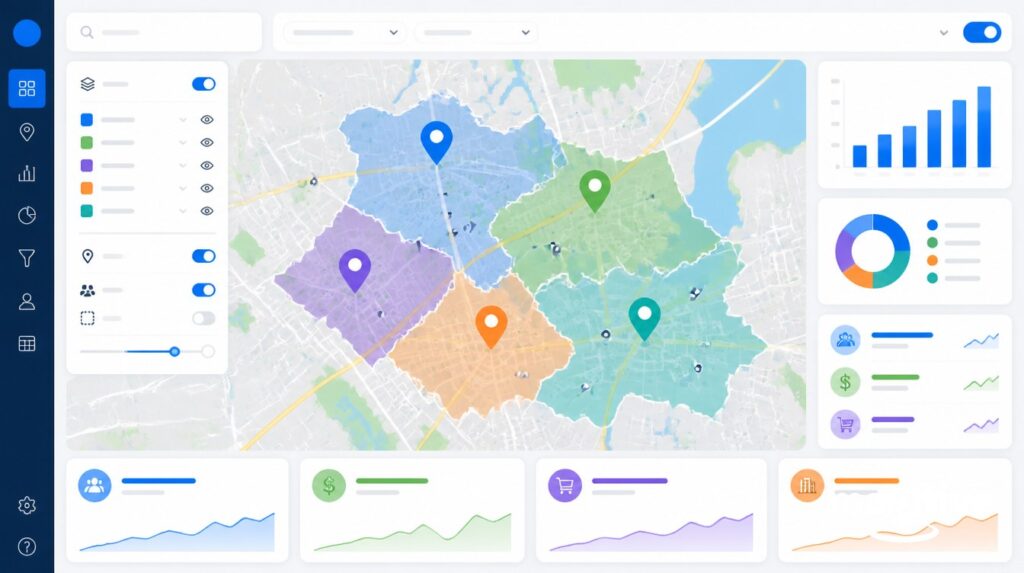
Sales mapping software offers various visualization options, including bubble maps, heat maps, pie charts, bar charts, or line graphs. Set the parameters and options to define how the different data points will be represented visually across your sales territories.
Step 3: Apply filters and customize.
Utilize the filtering and interactivity features of the sales mapping tool to enhance the user experience and provide dynamic data exploration. Customize the visual elements of your maps to align with your brand and presentation needs. Modify colors, font styles, legends, and labels to create a visually appealing and cohesive representation.
Step 4: Present and share.
Once your data visualizations are ready, present and share them with your intended audience. Export the maps and sales territories in various formats, such as images or interactive files, depending on how you plan to share or incorporate them into reports or presentations.
Step 5: Monitor and update.
Data visualization is an iterative process, and it’s important to monitor and update your sales territories and maps as new data becomes available or when insights change. Regularly update the data within the sales mapping software to ensure your visualizations remain current.
Conclusion
Sales mapping software plays a crucial role in market research, providing businesses with valuable tools to gain insights, make informed decisions, and drive success.
It empowers businesses and sales managers to gain valuable insights into customer behavior, demographic trends, and their target market. By leveraging a sales mapping tool, businesses can make informed decisions, optimize resource allocation, manage sales territories, and tailor strategies to meet the demands of an ever-changing marketplace.
FAQ
Q1: What is sales mapping software with market research capabilities?
Sales mapping software with market research capabilities refers to specialized tools that enable businesses to visualize and analyze spatial data related to their target markets, customers, and competitors.
Q2: How can sales mapping software help with customer segmentation?
Sales mapping software provides businesses with the ability to visualize sales data spatially, making it easier to identify patterns and clusters. By plotting customer locations on a map and applying segmentation criteria, businesses can effectively group customers based on shared characteristics.
Q3: How can sales mapping software help with demographic analysis?
Sales mapping software facilitates demographic analysis by overlaying demographic data and sales data on maps. By visualizing population density, age groups, income levels, or other demographic factors, businesses can identify geographic trends and patterns.
Q4: How can sales mapping software be used for data visualization in market research?
Mapping software enables businesses to transform complex sales data sets into visually appealing maps and charts. By visually representing market data, marketing performance metrics, and other critical information, businesses can communicate insights more effectively, make data-driven decisions, and uncover hidden trends.
Q5: What are the best practices for using sales mapping software in market research?
- Start with clear research objectives and identify the specific sales data sets and variables you want to analyze.
- Ensure the data is accurate, organized, and compatible with the sales mapping software.
- Choose the appropriate visualization methods based on the nature of your sales data and the insights you want to convey.
- Regularly update and refine your analysis as new data becomes available or insights evolve.
- Use interactivity and filtering features to allow users to explore the data in a dynamic and targeted manner.
- Customize visualizations to align with your brand and presentation needs, and annotate them with additional information for better understanding.
Q6: How do I integrate mapping software with other market research technologies?
Integration options vary depending on the sales mapping software and the specific market research technologies you’re using. Many mapping software providers offer APIs that allow you to connect and exchange data with other systems or tools. This enables seamless integration with CRM platforms, data analytics tools, or other market research technologies.


