
With COVID-19 case numbers starting to fall in many parts of the world, a number of businesses are starting to reopen. However, most business owners are approaching this gradually as they adapt to the new climate we now live in.
Many businesses with multiple locations are opening some stores while keeping others closed in order to measure the level of demand and test new measures in the time of social distancing. If you find yourself in this situation it can be difficult to determine what the right course of action is.
If you open too many locations too fast you may end up with empty stores and unnecessarily high labor costs. If you open too few locations you might not be able to keep up with the traffic and encounter public health risks. And whatever your reopening strategy might be, you need to find a way to effectively convey it to your customers.
Interactive and customizable COVID-19 maps can solve these issues and help you establish a successful reopening strategy for your business.
Here are four ways mapping software can assist your business during these times:
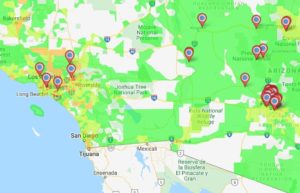
Plotting Population Density to Determine Which Locations to Reopen
If you’re planning to start off by only opening a select few locations you’ll first need to determine which stores to open.
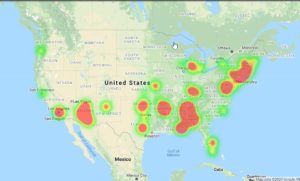
While you surely have data showing you which locations are generally the busiest, population data can also be extremely valuable. A certain location may not have been your busiest before the shutdown, but you may find that it’s more centrally located in a high population area than others, making it a good choice to reopen.
By plotting population data onto a map using heat mapping technology, you’ll quickly be able to determine the most populous regions within your service area. You can then plot your store locations on the map to see which of your stores are best positioned to service your customers.
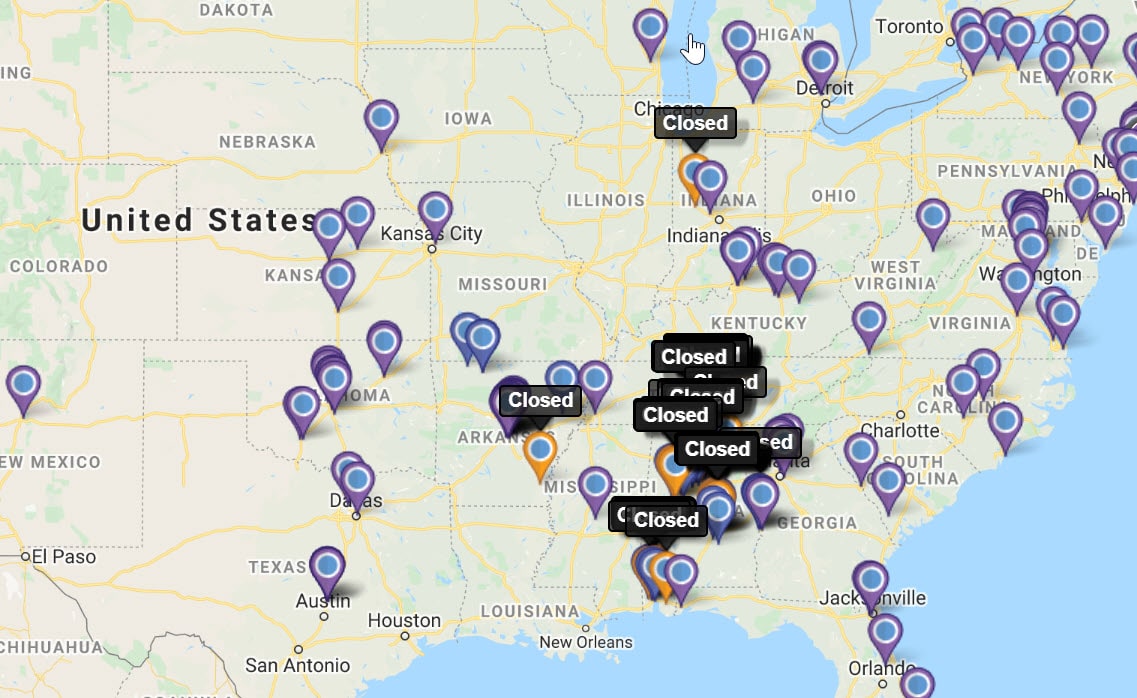
Creating a Map to Let Your Customers Know Which Locations are Open
Once you determine which locations will be opened and which will remain closed, you need to find a way to effectively relay this information to your customers.
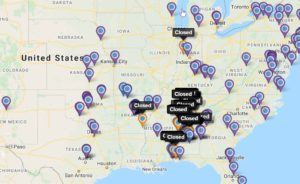
COVID-19 mapping software can allow you to create a visual representation of your reopening strategy. By plotting your locations on an interactive map and indicating which are open and which are closed, your customers can quickly identify the open location nearest to them.
Plotting the Locations of Your Employees to Determine Who Can Be Utilized at Which Locations
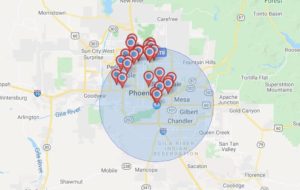
Depending on your reopening strategy, you may need to adjust how you utilize your team. Some employees will need to be transferred to different locations, and you may need to reactivate certain team members as you open more locations.
By plotting the locations of your stores and employees, and creating a driving radius around each team member, you can instantly see which employees can work at which locations. This allows you to quickly make staffing decisions as you adjust your strategy and start opening more stores.
Plotting Sales Density to Help Determine When More Locations Need to be Opened
As the spread of COVID-19 continues to lessen, foot traffic at your locations should begin to increase. You need to have access to the right data so you can accurately assess your demand and determine when it’s the right time to open additional locations.
By plotting your sales density on a map you’ll be able to identify which locations are becoming exceedingly busy and which ones are remaining relatively quiet. If a location begins to experience higher levels of demand you can start looking at opening other nearby locations.
This helps ensure that you reopen the right locations at the right time, giving your business the best chance at success.
COVID-19 Maps by Maptive
Are you looking for a way to visualize your location-based data so you can establish an effective reopening strategy?
Maptive’s interactive mapping software can help you transform your spreadsheet data into a customizable Google map. Simply input or import your data into our software and we’ll take care of the rest. You’ll also have access to a wide array of tools to help you visualize your data exactly how you want.
Reach out to us to learn how our mapping software can help build maps so you can make more informed decisions about your business reopening in the wake of COVID-19.


