One of the most popular ways to analyze large data sets is Microsoft Excel. This spreadsheet tool has a number of functionalities that are very useful for businesses. However, when it comes to visualizing location data, it lags behind other solutions.
This is why more and more businesses are turning to mapping software to create a visual representation of their information. This is especially true when it comes to heat mapping.
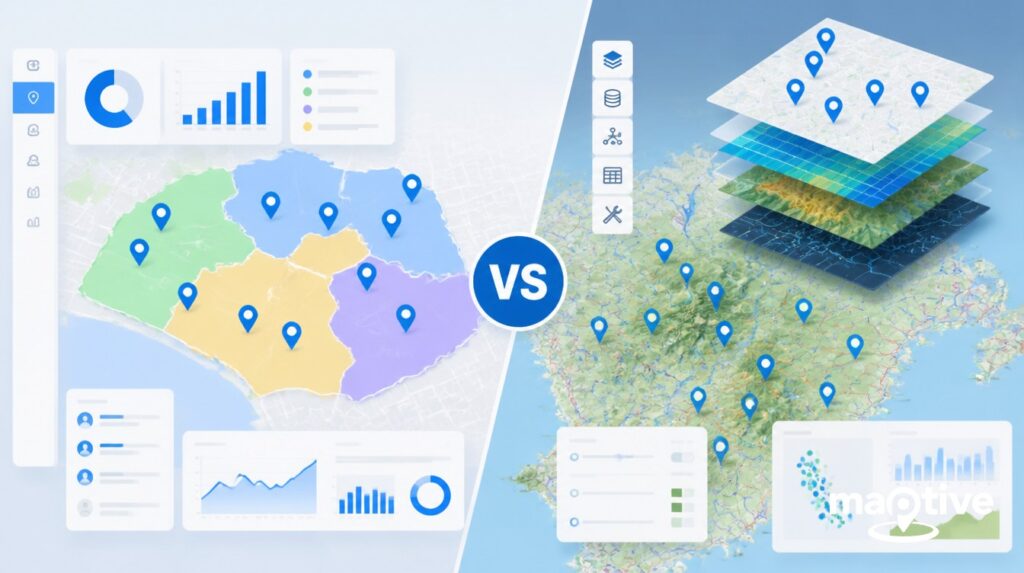
While Excel is able to perform this task, mapping software like Maptive is much more robust and user friendly.
What is a Heat Map?
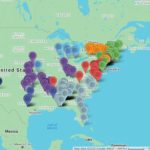
Heat maps use different shades to represent data density in a given area. A 3-color scale is generally utilized, with darker colors representing the highest values and lighter colors representing the lowest values. Heat maps are extremely valuable for businesses that need to quickly determine where their data is most common and where certain events are occurring most often.
They’re used to measure a wide range of data points, including:
- Population
- Customers
- Sales
- Sales representatives
- Locations
- And more
No matter what industry you’re in, heat maps will visualize your data and uncover important insights.
Creating a Heat Map in Excel
Excel offers some basic heat map functionality within their software.
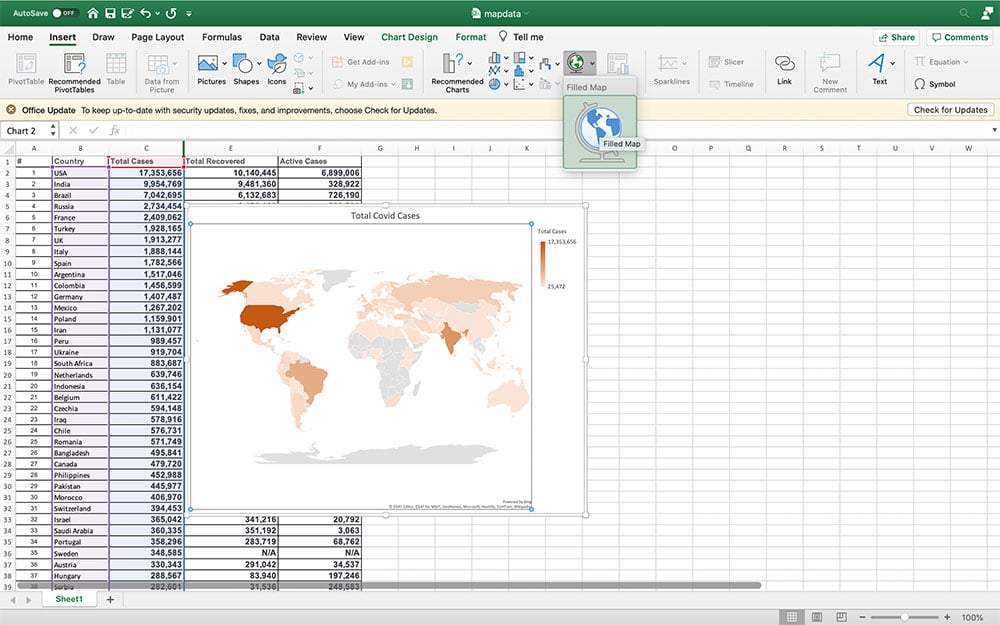
To start, click on “Insert” then click “Maps” and select “Filled Maps.” A blank map will appear on your spreadsheet. Note: This functionality is only enabled on Office365 and may be included in some older versions of Excel.
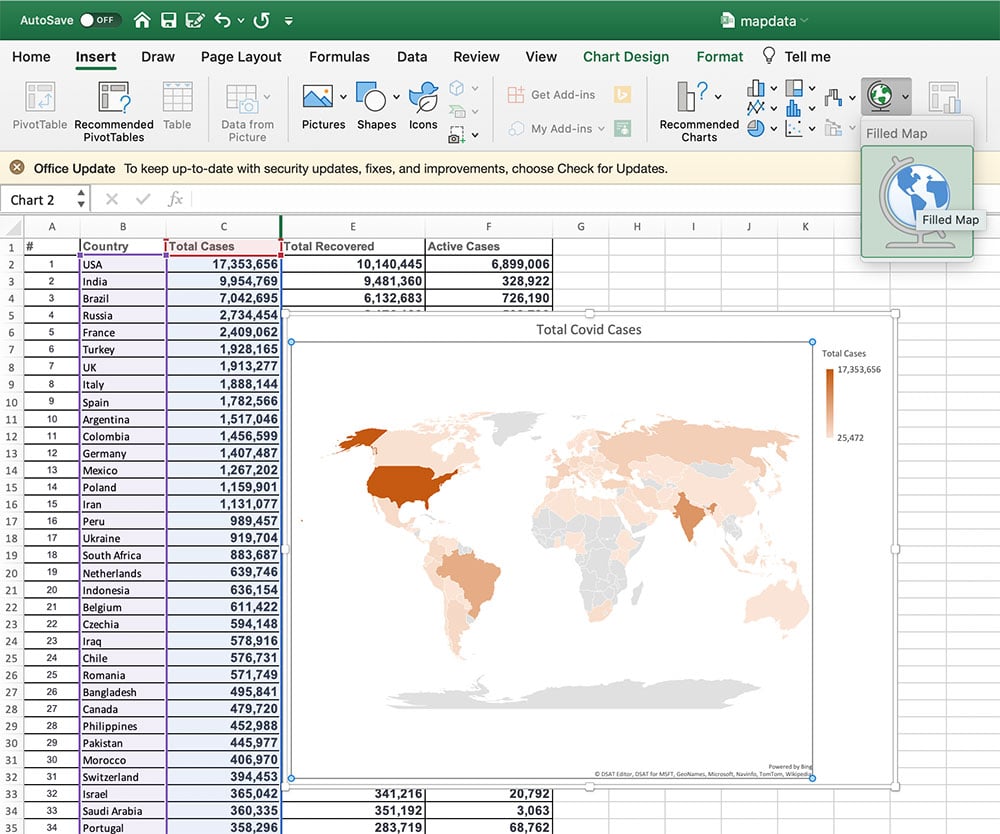
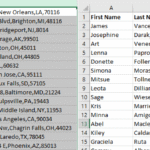
Use one column for your geographic locations and one column for your data. Enter your locations into your worksheet to have them appear on your map. Include data beside your locations to color them in. As data is entered, different color shades will appear inside your locations based on the cell values.
This allows you to create a fairly simply heatmap. However, there are several limitations, the main one being you can’t map cities or addresses. The customization features are also lacking, meaning you have very little control over what your map looks like. There are a lot of conditional formatting rules required to edit these maps, which is very time-consuming.
Creating a Heat Map with Maptive
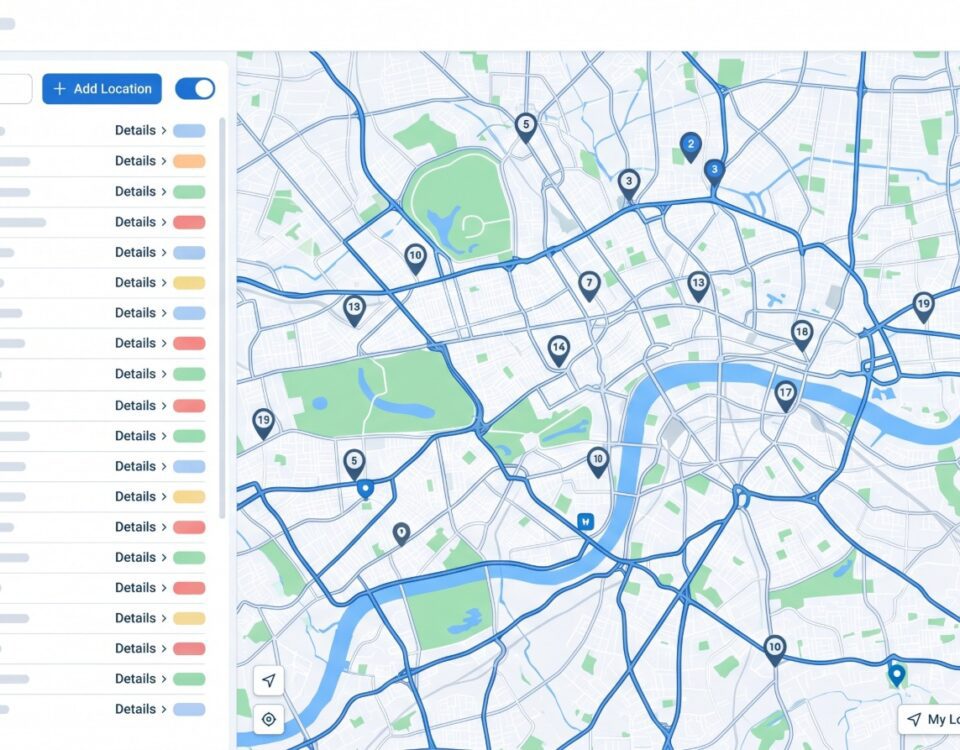
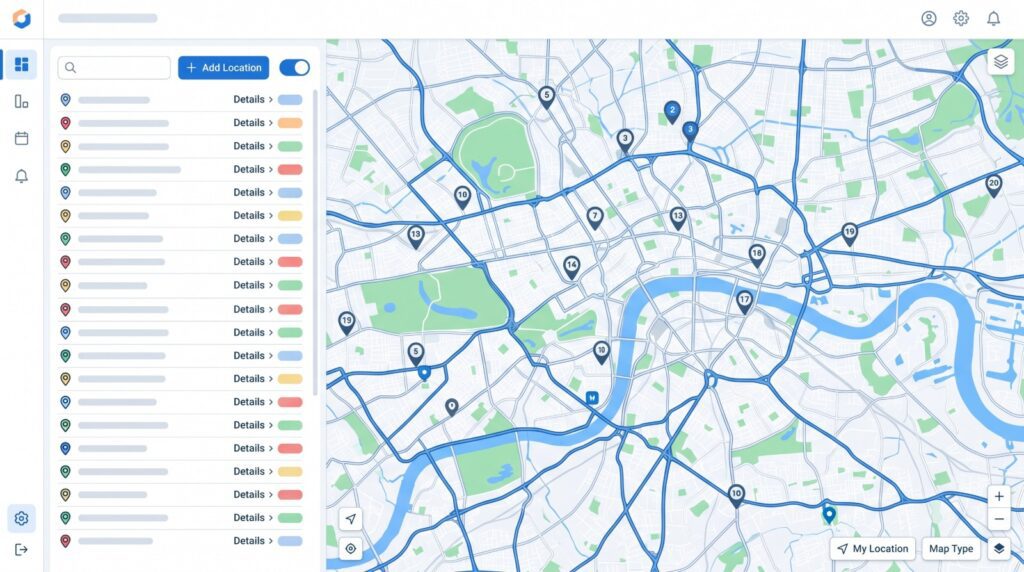
Instead of trying to complete this task in Excel, simply upload your spreadsheet data to Maptive to easily create a dynamic heat map to share amongst your team.
Use the following steps to build your map:
- Sign up for a free trial account with Maptive.
- Click “Create a New Map.” Give your map a name and description, then click “Continue.”
- Upload your spreadsheet data, or manually enter it. Click “Map Now” to plot your location data.
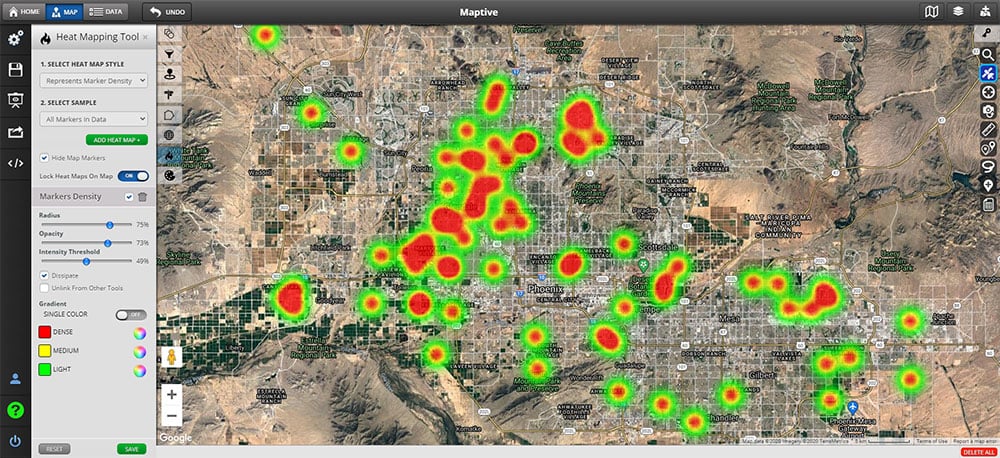
- Click the tools icon in the upper left-hand corner of the screen and select “Heat Map Tool.”
- Under “Select Heat Map Style” choose whether you want to measure marker density or the density of your numerical data.
- Under “Select Sample” decide whether you want to measure all markers or just a specific group of them.
- Click “Add Heat Map” to create your map.
Use the options provided to customize radius, opacity, and intensity. Then choose different color scales for low values and high values. After you’ve finished, click “Share Map” to send a link to friends and colleagues, or embed it on your website.
With Maptive, creating a heat map is done in minutes and the many options mean you can make look exactly the way you want.
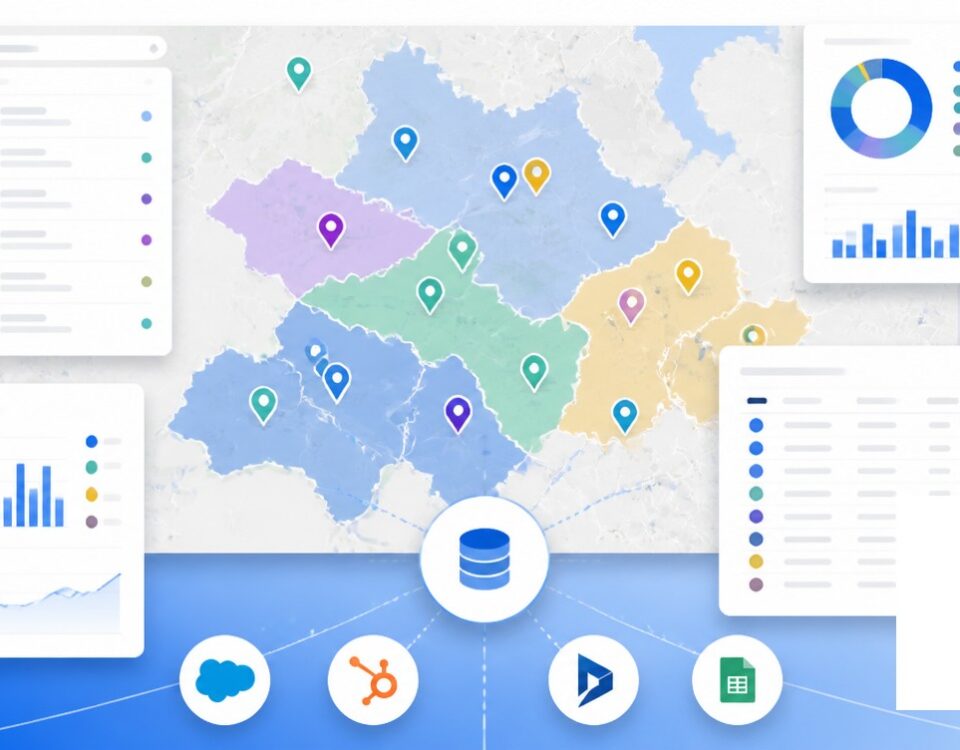
Other Maptive Features Not Found in Excel
When it comes to visualizing a dataset, Excel simply doesn’t compare to Maptive. Here are a few other options you’ll have with Maptive that aren’t available with Excel:
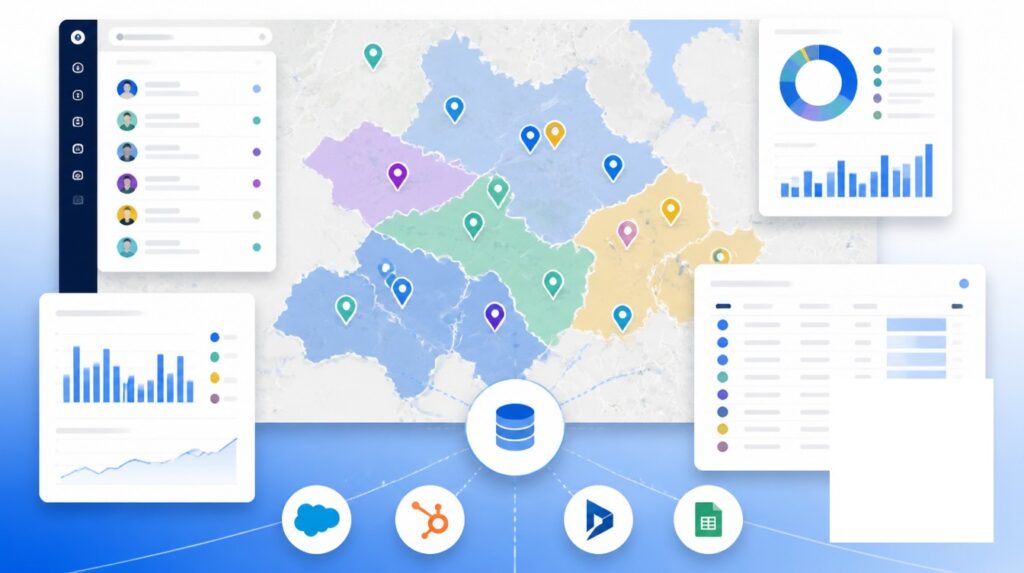
Sales Territory Mapping
Use Maptive’s boundary tool to create territories based on zip codes, counties, and states. Or build custom sales territories with the territory drawing tool. Upload your sales data to Maptive to compare sales between territories, identify territories that are meeting their targets, and discover regions where you need to improve.
Route Planning
Find the quickest route between two or more locations with the route planning tool. Simply enter your starting location and destinations, and Maptive will instantly generate the fastest route between all of them.
Filter Your Data
Create multiple map filters that allow you to toggle between different data points. Display only the information you need to cut out the noise and focus on what’s important.
Visualize Your Data with Maptive
Create heat maps, build sales territories, and plan your routes, all in just a few clicks. Sign up for a free trial account with Maptive and start mapping today.


