Maptive v5: The Future of Mapping Is Here
Take Your Data to the Next Level
Maptive v5 introduces a wide range of updates designed to improve how you work with maps. We’ve focused on enhancing usability, giving you more customization options, and delivering greater precision across every tool. These updates make it easier to streamline your workflows, unlock new functionality, and get the most out of Maptive.
Smarter Drive Time Insights
Drive time polygons now cover up to four hours, with eight-hour support coming soon for even better route planning and logistics.
Effortless Territory Management
Convert boundaries into polygons, adjust sales regions instantly, and customize territories without hassle.
Precision Data Exports
Export only the closest rows, remove duplicates, or extract data outside of a radius for cleaner reports.
Instant Territory Setup
Auto-generate balanced territories using zip codes, demographics, and sales data—no spreadsheets needed.
Deeper Demographic Insights
Analyze population, income levels, and other key demographics directly inside your maps for instant insights.
Boundary Tool Matching
Color-code zip codes and regions based on marker data or text matches to highlight key insights visually.
Full Base Map Customization
Adjust water, land, streets, and points of interest to create custom-branded maps that fit your needs.
Bulk Editing in Territories
Make changes to all markers in a territory in one click—update owners, modify details, and streamline updates effortlessly.
One-Click Spreadsheet Updates
New columns and modified data sources now seamlessly integrate without breaking existing map settings.
Track & Restore Spreadsheet Data
Never lose important data—easily restore previous versions of your spreadsheet with full version tracking.
A Faster, Cleaner Maptive
The redesigned interface makes tools easier to find, navigate, and use, so you can work faster than ever.
Real-Time Map Overview
See all active tools, filters, and settings in one place—stay in control of your maps with full visibility.
Stronger Data Protection
Two-factor authentication & advanced security enhancements keep your maps safe and secure.
Analyze Data While Mapping
View your map and spreadsheet side by side for real-time updates—eliminating constant switching.
WebGL Rendering for Large Datasets
Faster, smoother maps that handle more markers & complex datasets, with 3D visualizations coming soon.
Search & Add Locations (Soon!)
SFind businesses, restaurants, and key locations instantly with Google Places Search—and add them directly to your map.
Sync with Your CRM (Soon!)
Connect Maptive to Salesforce, Zoho, and HubSpot to pull in customer and sales data seamlessly.
Multi-Currency & Language Support (Soon!)
Manage subscriptions in 140+ currencies and work in multiple languages—making Maptive more accessible worldwide.
Advanced WebGL Performance
More markers, smoother performance, and future support for 3D visualizations—built for large-scale data.
Boundary & Territory Isolation Tool
Share focused maps with only selected boundaries or territories, hiding the rest—ideal for presentations & reports.
Explore What’s Under the Hood
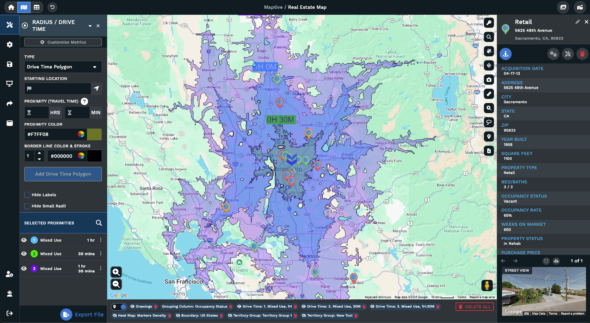
Improved Drive Time Polygons for More Accurate Results
Drive time polygons have been enhanced to provide a clearer, more precise representation of travel distances within specific timeframes. By increasing the number of calculation points, these polygons now generate more accurate results for planning and logistics.
Currently, calculations are precise for up to four hours, with plans to extend to eight hours in the near future. This improvement ensures reliable data for your travel and operational needs.
- Increased Calculation Points: More data points result in significantly higher accuracy.
- Current Time Range: Accurate results for drive times up to four hours.
- Future Expansion: Support for eight-hour drive times is coming soon.
- Use Cases: Ideal for delivery planning, sales routing, and service area optimization.
Combined Boundary and Territory Tools
We’ve unified the Boundary and Territory tools, giving you more flexibility to manage and customize your maps. Now, you can convert territories created from boundaries into polygons, allowing for seamless adjustments and reconfigurations.
Adding or removing boundaries is straightforward, making it easy to create regions based on states, counties, or previously saved data. These updates streamline territory management for faster and more intuitive workflows.
- Convert Boundaries to Polygons: Create and refine territories in polygon format.
- Flexible Adjustments: Add or remove boundaries as needed to perfect your regions.
- Multi-Level Support: Build territories using states, counties, or existing boundary sets.
- Use Cases: Simplifies sales area management, service coverage planning, and geographic analysis.
New Radius Tool Export Options
Exporting data from radius tools is now more customizable, giving you precise control over how your data is extracted. These new options make it easier to analyze, share, and use radius-based information in meaningful ways.
- Export Closest Rows: Focus on the closest data points to the radius center.
- Export Outside Data: Retrieve data that falls outside of a defined radius.
- Avoid Duplicates: Ensure markers appear only once, even when working with overlapping radii.
- Use Cases: Perfect for proximity analysis, targeting customers, and managing data within multiple radii.
Automated Territory Creation and Balancing
Our Automated Territory Creation feature lets you generate balanced territories with minimal effort. Build territories automatically from boundaries such as zip codes and balance them using data from spreadsheets, demographic information, or a combination of both.
The tool factors in salesperson locations, existing territories, and multiple data fields to create optimized regions. This premium feature is available for trial, letting you test its capabilities before upgrading.
- Automated Creation: Automatically generate territories from boundaries like zip codes.
- Balanced Regions: Use data inputs to ensure territories are balanced and practical.
- Customizable Factors: Incorporate salesperson locations, existing territories, and other data points.
- Trial Availability: Available for trial on any account.
- Use Cases: Useful for sales planning, resource allocation, and demographic analysis.
Expanded Demographic Data Options
We’ve expanded the range of demographic data you can include in your maps to give you more actionable insights. Alongside population and median income, you can now add additional demographic metrics to radius popups, drive time polygons, boundaries, and territories. These updates make it easier to analyze data directly on the map without extra steps.
- Expanded Metrics: Add additional demographic data beyond population and median income.
- Customizable Popups: Include relevant demographic details directly in radius, polygon, and territory popups.
- Instant Insights: Access more information in real-time without needing separate tools.
- Use Cases: Ideal for market research, audience targeting, and regional analysis.
Google Places Search Integration (Soon!)
We’ve integrated Google Places into Maptive, letting you search for locations and display them on your map. Whether you’re looking for specific businesses or nearby points of interest, this tool expands how you can interact with and visualize data.
Here’s what you can do:
- Search for Locations: Access Google Places data directly to find businesses or points of interest.
- Flexible Display Options: Add locations temporarily as styled markers or save them permanently to your dataset.
- Analyze Nearby Points of Interest: Visualize data like nearby grocery stores, restaurants, or specific businesses (e.g., “Starbucks”) alongside your existing data.
So, you can expect:
- Seamless Integration: Search and display data from Google Places directly within Maptive.
- Enhanced Map Analysis: Compare Google Places data with your own datasets.
- Flexible Marker Management: Save or temporarily display found locations on your map.
- Use Cases: Perfect for proximity analysis, retail site selection, and competitive mapping.
Boundary Tool Matching with Marker Data
With Maptive, you can now use markers to color boundaries like zip codes. This allows you to visually represent data across boundaries in new, effective ways. You can match colors based on marker positions or text rules, creating a clear connection between data points and mapped areas.
- Color Boundaries: Automatically color zip codes or other boundaries based on your marker data.
- Flexible Matching Rules: Match colors by text fields or marker positions.
- Improved Map Clarity: Visualize relationships between markers and boundaries for easy analysis.
- Use Cases: Ideal for territory mapping, data segmentation, and visualizing regional data.
Redesigned User Interface
Our updated interface makes Maptive even easier to use while incorporating more features in the same space. Tools are now more accessible, and navigating between settings is faster and more intuitive. The design maintains the functionality you rely on but makes everything easier to find and use.
- Streamlined Navigation: Tools and settings are easier to locate, reducing the time spent searching.
- Expanded Functionality: Access additional features without cluttering the workspace.
- Familiar Feel: We’ve improved usability without disrupting how you already work.
- Use Cases: Supports faster workflows, especially for users managing large datasets or complex maps.
Map Status Menu
The status bar is a new addition designed to keep you fully informed about all the tools, filters, and settings currently applied to your map. This feature gives you complete visibility, ensuring you never lose track of what’s active. By providing a centralized view, it helps you stay organized and confident in managing your maps, no matter how complex they get.
- Real-Time Overview: Displays all active tools, filters, and settings in one place, so you can quickly understand what’s in use.
- Improved Visibility: Makes it easier to track changes and ensure everything is working as intended.
- Streamlined Management: Reduces guesswork by giving you direct access to applied tools and settings.
- Use Cases: Perfect for managing complex maps with multiple layers, filters, and visual customizations.
Spreadsheet Data Versioning
To protect your data and simplify version management, spreadsheet data versioning now allows you to track and revert changes with ease. Every update to your spreadsheet is automatically saved, so you can roll back to a previous version when necessary. This feature is especially useful for collaborative teams or when handling large, complex datasets.
- Automatic Change Tracking: Keeps a record of all spreadsheet edits, allowing you to access a history of changes.
- Revert with Confidence: Restore data to a specific date and time in case of errors or accidental edits.
- Added Security: Protects against unexpected changes, especially in shared environments.
- Use Cases: Great for collaborative teams, ensuring data accuracy, and restoring previous datasets quickly.
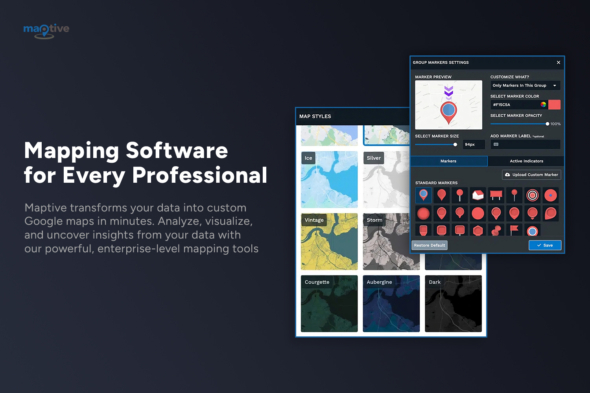
Full Base Map Customization
Customization options have been expanded to give you more control over how your base maps look and function. Along with new preset styles, you can now modify individual map elements, such as water and land colors, visibility of streets, points of interest, and more. These updates make it possible to create maps tailored to your brand, audience, or project goals.
- Preset Styles: Access a wider variety of base map styles to quickly find a look that suits your needs.
- Adjustable Elements: Customize specific map details like water, land, streets, and points of interest.
- Tailored Presentations: Ensure maps align with your brand or emphasize important features for your audience.
- Use Cases: Ideal for creating polished, branded maps, designing maps for presentations, or improving visual clarity for analysis.
Bulk Editing in Territories
Our bulk editing functionality makes it easy to update all markers within a territory in a single step. Whether you’re reassigning a salesperson, updating data values, or making administrative changes, this tool streamlines the process and eliminates repetitive tasks.
- One-Click Updates: Edit all markers within a territory in one action.
- Streamlined Workflows: Reduce manual updates and save time when managing territories.
- Flexible Use Cases: Assign new team members, update contact details, or modify data fields quickly.
- Use Cases: Perfect for sales team management, territory updates, and administrative tasks.
Seamless Spreadsheet Updates
We’ve made updating your data sources smoother than ever. When adding new columns or modifying existing spreadsheets, a popup will guide you through matching old and new columns. This ensures that your map settings and data relationships remain intact, even when your dataset changes.
- Smooth Transitions: Add or update columns without disrupting existing map configurations.
- Column Matching: A popup helps you align new and old columns for consistency.
- Preserved Settings: Keep your map’s filters, markers, and other settings intact during updates.
- Use Cases: Useful for updating datasets, adding new data fields, or integrating refreshed sources.
Split-Screen View for Maps and Data
The new split-screen view lets you see your map and its corresponding spreadsheet side by side. This feature allows you to analyze and edit data in real-time while viewing how changes impact the map.
- Real-Time Insights: View your map and spreadsheet simultaneously for instant analysis.
- Direct Interaction: Make changes to your data and see immediate updates reflected on the map.
- Streamlined Workflows: Reduce the need to switch between tabs or windows when working with your data.
- Use Cases: Ideal for analyzing marker performance, managing data adjustments, and understanding map relationships.
Security Enhancements
We’ve introduced two-factor authentication (2FA) to provide an additional layer of security for all accounts. This ensures that only authorized users can access sensitive data. Along with 2FA, other platform-wide security improvements have been implemented to give you greater confidence when managing your maps and data.
- Two-Factor Authentication: Add an extra layer of protection to your account.
- Platform-Wide Security Updates: Improved safeguards to protect sensitive information.
- Reliability: Designed to maintain data integrity and user privacy.
- Use Cases: Perfect for teams handling confidential data or users requiring enhanced account security.
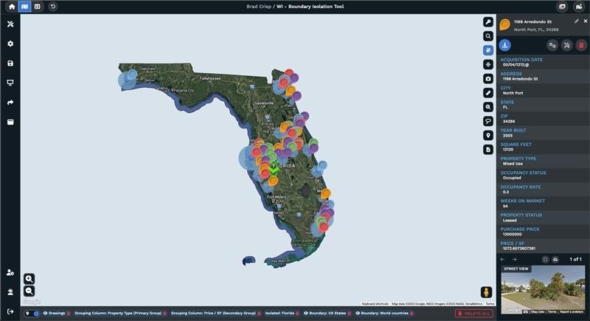
Boundary and Territory Isolation Tool
Our Boundary and Territory Isolation Tool allows you to share focused versions of your maps by displaying only specific boundaries or territories while hiding the rest. This feature is perfect for presentations, reports, or sharing targeted data with stakeholders.
- Focused Sharing: Display only selected boundaries or territories on shared maps.
- Hidden Data: Hide all other areas to keep the focus on what matters most.
- Targeted Communication: Share specific insights without overwhelming viewers with unnecessary details.
- Use Cases: Ideal for stakeholder presentations, client reports, and sharing localized data.
WebGL Map Rendering
The introduction of WebGL map rendering brings huge performance improvements to Maptive. This new system allows for more markers and boundaries to be displayed simultaneously, making it easier to work with complex datasets. In the future, WebGL rendering will also support 3D visualizations, opening up new possibilities for map customization and analysis.
- Increased Marker Capacity: Display more markers and boundaries without performance issues.
- Enhanced Rendering Performance: Faster and smoother map interactions.
- Future Expansion: Planned support for 3D visualizations to expand use cases.
- Use Cases: Great for large datasets, detailed mapping projects, and visualizing complex geographic data.
Expanded API Options
Maptive v5 is built on a robust API infrastructure, opening up new possibilities for automation and customization. Soon, we’ll release public API documentation, empowering you to integrate Maptive into your workflows and tailor it to meet your specific needs.
- Automation Ready: Utilize APIs to streamline repetitive tasks and processes.
- Customization Options: Adjust map settings, manage data, and more using API calls.
- Public Documentation Coming Soon: Comprehensive documentation will guide you in implementing APIs for your projects.
- Use Cases: Ideal for automating workflows, integrating mapping functionality into applications, or syncing data with external systems.
CRM Integrations
We’re expanding Maptive’s integrations with leading CRM platforms to help you sync your data seamlessly. Integration with Salesforce is currently undergoing review and will be available soon. We’re also developing connections with Zoho, Hubspot, Pipedrive, and others, ensuring Maptive fits seamlessly into your existing tools.
- Salesforce Integration: Currently under review and will be available after completion.
- In-Progress Integrations: Zoho, Hubspot, Pipedrive, and additional CRM platforms are being added.
- Data Syncing: Automatically integrate and update mapping data with your CRM for improved workflows.
- Use Cases: Perfect for sales teams, customer relationship management, and territory planning.
International Payment and Language Options
To better serve our global users, we’re expanding payment and language options in Maptive. Soon, you’ll be able to manage subscriptions in over 140 currencies, covering 240+ countries. Additionally, we’re working on offering the app and website in multiple languages to improve accessibility worldwide.
- 140+ Currencies Supported: Pay in your local currency for greater convenience.
- 240+ Countries Covered: Expands accessibility for international customers.
- Language Localization: Plans to add multiple language options for the app and website.
- Use Cases: Designed for global businesses, multinational teams, and users in diverse regions.
Join Maptive v5 Beta
Want early access to powerful new features? Be part of Maptive v5 Beta and explore the tools designed to transform how you work with maps. From enhanced customization to new integrations, you’ll get a firsthand look at the future of mapping.
- Exclusive Access: Try out the newest features before anyone else.
- Provide Feedback: Shape the future of Maptive with your input.
- Stay Ahead: Gain a competitive edge by leveraging cutting-edge mapping tools early.
Don’t miss this opportunity to explore what’s next with Maptive v5. Sign up today and take your mapping to the next level!