Free Demographics Maps
Demographic maps are a valuable resource for any business. Use them to gain important insights about your customers and gain an edge over your competitors. Maptive offers free US demographic map data when you sign up for a membership. Maptive provides a wide array of tools to make visually engaging data visualizations out of location data.
How to Create a Free Demographic Map
When you sign up for Maptive’s 10-day risk-free trial (no credit card required), you will be able to create demographic maps based on US Census data. Create demographics maps by state, city, county, zip code, census tract, or block group. Here are the most popular cities users create demographics maps for:
- US Demographics maps – Create a demographics map of the entire US broken down by zip code, city, state, county, census tract, or block group.
- City demographics maps – Census data for all cities in the US, including Houston, Minneapolis, NYC, Atlanta, Washington, Los Angeles, Detroit, and more!
- State demographics maps – Census data for all US States, including New York, Texas, California, New Jersey, Florida, North Carolina, and more!
- County demographics maps – Break down census demographic data by county.
- Zip code demographics maps – Break down census data by zip code.
- Census tract demographics maps – Break down census data by census tract.
- Block groups – Break down data by block group, the smallest breakdown available.
Demographics Data Overlay
What are Demographic Maps?
Demographic maps display various types of census data on a map. They allow you to visualize what the demographics are in a given area. Some of the information that might be displayed on a demographic map includes:
- Population density
- Age
- Gender
- Race
- Eduction
- Transportation
- Labour
- Income
- Unemployment
- Housing
By plotting this information on a map you gain a better understanding of the people that live there. You can see where the majority of people reside, what the average age is in a given area if there are patterns in regards to income and other important insights.
Types of Demographic Maps
Demographic maps come in many different forms. Some examples of demographic maps include:
- Population Map: Get population estimates and learn the number of people that live in different regions.
- Population Growth Rate Map: See the population change in different cities and neighborhoods.
- Demographic Map by Zip Code or Census block: Divide your map into zip codes or census blocks and see the differences in demographics from one area to another.
- Racial Demographics Map: See what the racial breakdown is in a certain area.
- Age Demographics Map: Learn the average age of people in a given area and see where certain age groups are most likely to live.
- Income Demographics Maps: See the breakdown of average income ranges in different areas.
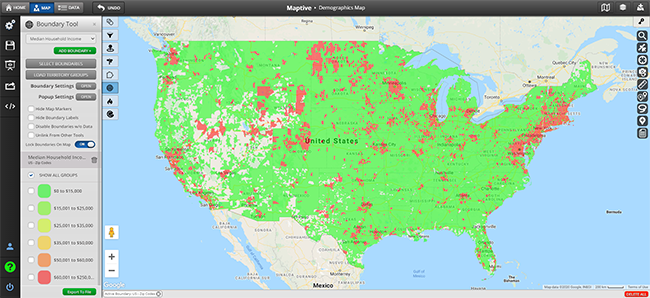
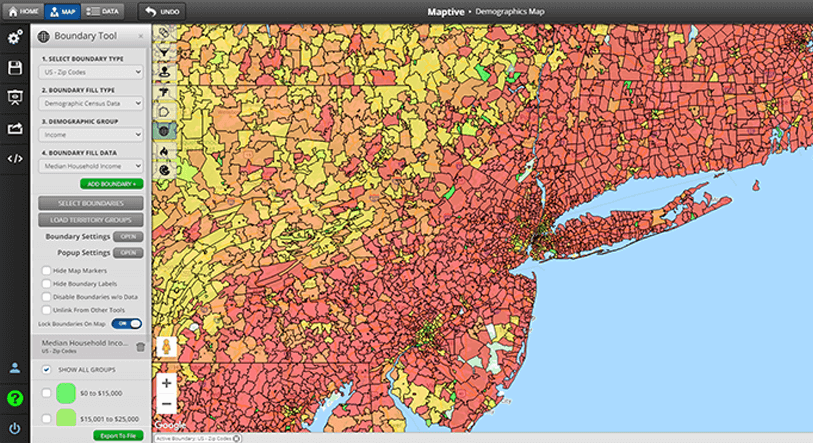
Median Income Mapping by Zip Code
What Can You Use Demographic Maps For?
There are many different uses for demographic maps. Some of the most common ways businesses utilize demographic maps are:
- Learning About Your Local Market: Analyze the demographics of the area around your business to learn more about your customer base.
- Target Your Ideal Customer: Discover where your ideal customers live and target those areas with advertising.
- Site Selection: Use demographics to determine whether a location has the right population and demographic makeup to support your business.
Create Your Own Custom Demographic Maps
Maptive makes creating demographic maps simple. Upload your location data from a spreadsheet to automatically plot the locations of your stores, offices, sales reps, and more. Then overlay a wide range of demographic data on an interactive map to learn new insights.
Sign up for a free trial of Maptive and create your demographic maps today.
Start Your Free, No Risk, 10 Day Trial
No credit card required. No surprises. Just Results.

