

Sales territory optimization is the data-driven process of designing, monitoring, and rebalancing the geographic patches or account groups assigned to a sales team so that workload, opportunity, and capacity are matched. The cost of getting it wrong is measured in turnover and stalled revenue, and at an average all-in replacement expense of $114,957 per outside sales hire, that cost compounds quickly across a year.
Done well, territory optimization adds 10% to 20% to sales productivity, increases revenue 2% to 7% with no other change in headcount or strategy, and pulls 1.5x to 3x more selling hours out of the same team. Done poorly, it produces a familiar pattern. About one in five reps clears 150% of quota while close to half miss 50%. The talent assumption blamed for that spread is almost always wrong.
This article works through the three operating layers that hold a territory plan together. The first is balance, meaning the methods that distribute workload and opportunity fairly across reps. The second is monitoring, meaning the KPIs that show the design is performing as intended. The third is improvement, meaning the cadence and change management that keep the plan aligned to a moving market.
The Anatomy of an Imbalanced Territory
A balanced sales territory is one where potential, workload, and resources are proportionately distributed across reps. The definition sounds simple. The practical work of measuring against it is where most organizations stumble. 58% of firms surveyed by the Sales Management Association report that their territory design efforts are ineffective, and only one-third describe their territory design discipline as functional. The gap between aspiration and execution is not small.
Signals of Imbalance
Imbalance has a shape that experienced sales leaders learn to read at a glance. The most reliable indicator is a bimodal distribution of quota attainment. When roughly 20% of the team is sitting at 150% or more and another 40% to 50% is sitting below 50%, the variance is rarely a coaching problem. The reps in the high band have stumbled into denser patches or richer account books. The reps in the low band are working harder per dollar of pipeline and quitting sooner. Organizations with effective territory design achieve sales objectives at a rate 14% higher than average. Organizations with ineffective design come in 15% below average. The gap is structural.
A second indicator is win-rate dispersion across territories. A Northeast patch closing at 52% while a Southeast patch closes at 38% can be explained by competitive intensity and market maturity rather than rep skill, but the spread itself signals that quotas, comp, and account counts probably need to be modeled against territory potential rather than the company average. Win-rate variance is a directional flag, not a verdict. The flag still has to be investigated.
The signals worth tracking quarterly:
- A 140-point spread between the highest and lowest performer on the team. When the top rep sits at 200% on a metro patch and the bottom sits at 60% on a rural stretch, the design is the variable, not the people.
- Rep turnover concentrated in two or three territories. Voluntary turnover that clusters geographically is a structural diagnosis. Reps who believe their territory denies them a fair shot at quota begin interviewing within the first two quarters and exit within four.
- Customer churn that tracks rep handoffs. When account-manager turnover correlates with account churn, the cost of the territory mistake is not absorbed by the rep alone. It walks out the door with the customer and lands on the next quarter’s gross revenue retention number.
- A Gini coefficient on quota attainment that exceeds 0.22, or a top-quartile-to-bottom-quartile ratio above 1.6x. Quantitative thresholds remove the argument about how much dispersion is normal.
- A territory white-space ratio that is rising faster than penetration. Accessible accounts inside the ICP being ignored is a coverage failure even when the rep’s quota is being hit.
Diagnostic Pulls and Field Observations
Three diagnostic pulls expose nearly every structural issue. Quota attainment by territory across the last four quarters. Account count and TAM by territory. Rep turnover by territory. If those three reports cannot be produced cleanly from current systems, that itself is a finding. 64% of organizations cite data quality as their top territory planning challenge, and the gap between what reps know about their patches and what the CRM reports is usually the first thing a serious redesign has to repair.
What reps observe that leaders miss is also worth recording. Drive time absorbed silently by certain patches. Pockets of accounts that have not been called in 18 months. New entrants the CRM has not ingested. Accounts that show up on the territory map but no longer exist as buying entities because of M&A in the customer base. The signals collected from the bottom of the field are the early-warning system for the metrics that eventually appear in the dashboard. Sales operations teams that build a feedback channel from reps to RevOps catch design problems one to two quarters earlier than teams that depend only on top-down reporting.
The Cost of Inaction
The cost of leaving imbalance in place is more measurable than most leaders assume. A 5% increase in sales-rep attrition raises selling costs by 4% to 6%. Some organizations lose 25% or more of their sellers every quarter. The cost of replacing those reps, on the DePaul model, runs $29,159 to hire, $36,290 to train, and $49,508 in lost productivity, for a total of $114,957 per departure. Inflation-adjusted, that exceeds $150,000 today. A territory that drives even two unnecessary departures per year carries a six-figure variance against plan that has nothing to do with the cost of the product.
Replacement time compounds the dollar cost. The average time to replace an inside sales role is 3.69 months. The average time to replace an outside sales role is 5.42 months. A B2B-specific measurement averaged 6.2 months, with a range of 5.8 to 7.8 months for full replacement, meaning the productivity baseline of a fully ramped seller. During the gap, the accounts the departing rep covered move to a queue, a temporary backfill, or another rep already at capacity. Pipeline that was warm goes cold. Renewal conversations that should have been opened in the previous quarter slip past their natural cadence. The accounting view of a rep departure is a single replacement-cost number. The operating view is a quarter or two of partially covered accounts producing reduced revenue against the same baseline quota.
Workload, Opportunity, and the Math of Balance
Balancing a sales territory is a quantitative exercise even though sales leaders frequently treat it as a judgment call. Equal account counts across reps look fair on a spreadsheet and almost never are. A patch of 100 mid-market accounts in metro Chicago and a patch of 100 mid-market accounts spread across rural Montana share a count and nothing else. The work, the opportunity, and the cost-to-serve are different by an order of magnitude. Account count alone is the most common balancing mistake because it ignores opportunity and travel.
The second most common balancing mistake is designing on historical sales precedent. Last year’s revenue tells you where the company sold. It does not tell you where the company should be selling. A territory plan anchored to historical performance locks the organization into the buyer mix it had three years ago, not the buyer mix it has now. Forward-looking TAM analysis is the corrective input, and the absence of forward-looking analysis is one of the most diagnosed failure modes in territory design audits.
The four-input workload index
Mature shops weight four inputs into a single workload index for each territory before any redistribution decision. Each input answers a different question about what the rep is being asked to do, and combining the four produces a comparable number across patches that look nothing alike on the map.
- Account count, tier-weighted. The raw number of accounts assigned to the rep, segmented by tier (strategic, mid-market, SMB). The work per account is not equivalent across tiers, so a flat count understates the burden of a strategic-heavy book.
- Revenue potential at the territory level. The total addressable revenue the territory could produce if fully penetrated. Calculated as average revenue per customer multiplied by the count of potential customers within the territory’s ICP segment. SAM and SOM refine the figure downward to what is realistically reachable in the planning horizon.
- Required visit frequency. How often each account needs a touch given the sales motion and the renewal cycle. Enterprise accounts may require monthly executive presence. SMB transactional accounts may require a quarterly check-in. Visit frequency varies by segment, product complexity, contract value, and competitive pressure.
- Drive time. The cumulative travel time the rep absorbs to service the territory at the required visit frequency. Field reps make roughly 31 customer visits per week and absorb 3.9 days of in-the-field time on average. Drive time differences between a metro patch and a rural patch can amount to a full selling day per week.
A representative capacity model anchors the index. Working hours per rep per year are roughly 2,000, of which usable selling hours are approximately 1,500, or 75% of total. If a rep spends three hours per month per account on calls, prep, internal coordination, and travel, the carrying capacity is approximately 42 active accounts. The number is a planning anchor, not a benchmark. Capacity is highly individual. On the same team, some reps perform at 150 accounts and others perform better at 75. The right capacity number for a given territory is the smallest number that supports the required visit frequency without forcing the rep to under-serve the book.
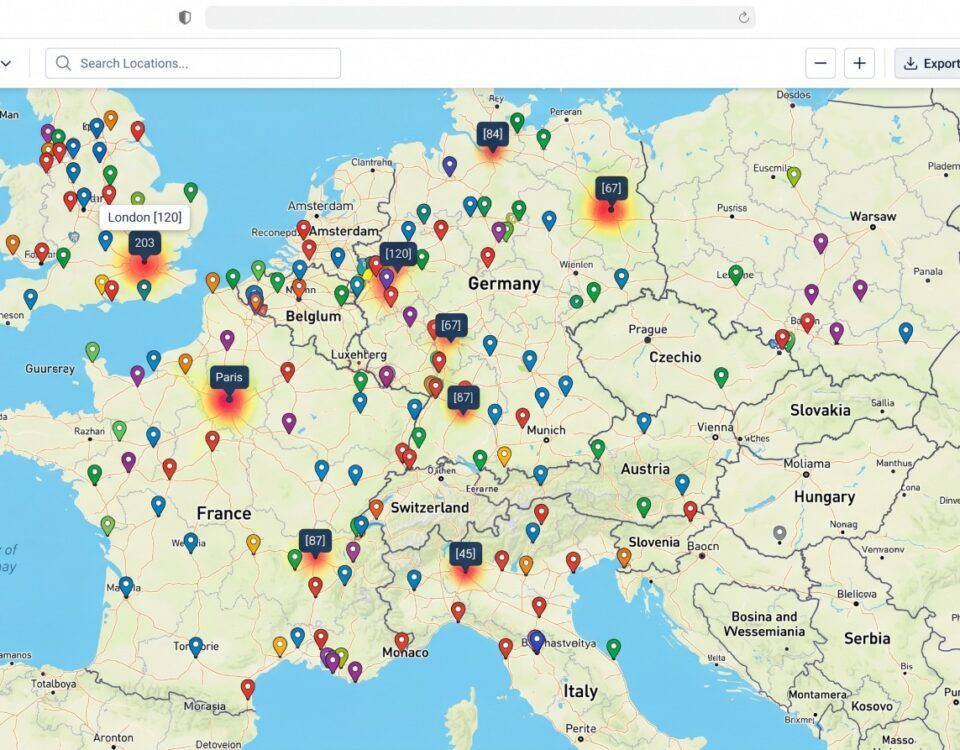
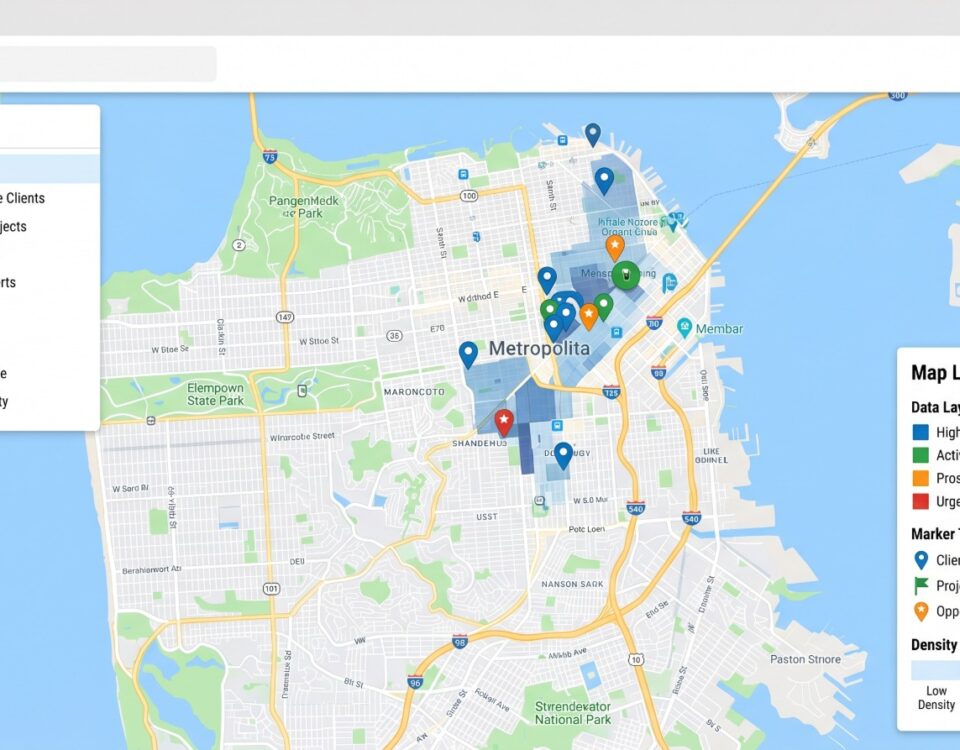
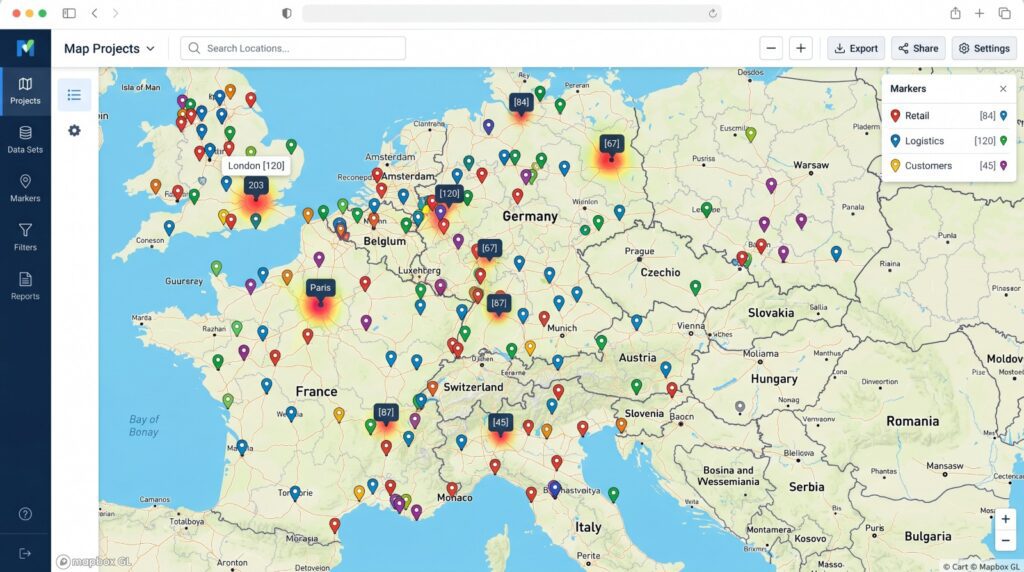
The workload index produces a comparable figure across territories. If one territory scores 1.4x the team average and another scores 0.7x, the rebalancing question is no longer about feelings. It is about the index. Maptive and similar geospatial platforms are used at this layer to visualize workload, drive time, and account density against actual territory boundaries, because the spatial relationships are difficult to read in a flat table.
The four inputs can be combined with different weights depending on the sales motion. Field sales motions weight drive time more heavily. Inside sales motions weight account count and required call cadence. Strategic enterprise motions weight revenue potential and required visit frequency above the other two inputs. The weights are not universal and the team that mechanically applies one set of weights to every territory misses the point of the index. Index design is a deliberate choice that should match the way the sales team actually operates. Re-examining the weights every annual planning cycle is sufficient for most teams. High-growth teams reconsider the weights at the semi-annual review because their sales motions change faster than once a year.
Quota allocation methods
Once workload is balanced, quotas have to be allocated against it. Three methods recur in practice and each has a known failure mode.
- Top-down. Annual revenue targets are broken down to teams and reps from the corporate plan. The advantage is alignment to the company’s financial commitments. The risk is that quotas appear arbitrary at the rep level because they are not validated against actual territory potential. Reps interpret the number as a directive disconnected from their book.
- Bottom-up. Sales leaders propose quotas based on territory-level TAM and prior performance, then aggregate to the company target. The advantage is that each quota maps to a defensible opportunity assessment. The risk is that the aggregate undershoots the corporate target, requiring a second-pass reconciliation that erodes trust if handled poorly.
- Hybrid. Top-down targets are validated by bottom-up modeling and the two are reconciled before the plan is communicated. The hybrid method is the modern enterprise standard. It balances financial commitments with territory equity and surfaces the disconnects early, while there is still time to redesign rather than to negotiate.
Equal-share quota distribution, where every rep receives the same number regardless of patch, is the simplest variant. It is fair only when territories are themselves equal, which they rarely are. Weighted-by-potential is more equitable when territory TAM differs, which it usually does once two or three carve-up factors are layered. A common implementation assigns 60% of the quota by territory potential, 30% by historical performance, and 10% by rep tenure to soften the transition for newer hires. The exact weights vary by organization and by the maturity of the underlying data.
Quotas set without consideration of territory revenue opportunity are one of the most diagnosed failure modes in sales performance reviews. The fix is mechanical. The territory model and the quota model have to share the same TAM input. When they do not, the quota plan and the territory plan tell different stories about the same book, and the rep is left to reconcile the difference at their own expense.
Quota timing is the second mechanical decision. A quota that lands at the start of the fiscal year against a territory that is being redesigned mid-year is a guaranteed source of attainment chaos. Quotas should be set after the territory plan has been finalized for the year, not before. When trigger events force a mid-year redesign, the quota plan needs a corresponding adjustment, typically a proration of the annual target against the territory change. Failure to prorate is one of the more common ways an otherwise sound redesign produces resentment that lingers into the next year.
Account scoring and the 80/20 reality
The customer mix inside a territory determines if the workload index produces revenue or only activity. The Pareto distribution, first observed by an Italian economist studying land ownership in 1896, recurs across sales books with surprising consistency. About 80% of revenue commonly comes from 20% of customers, and 80% of a sales force’s revenue commonly comes from 20% of its reps. Profitability analysis is harsher. Roughly 20% of customers deliver 250% or more of profit. Around 60% break even. The remaining 20% are profit-leaking accounts that consume more in cost-to-serve than they return.
Account scoring is the discipline that prevents a rep’s calendar from being dominated by the profit-leaking 20%. Three input types feed a serviceable account score. Account fit, meaning firmographic match to the ideal customer profile (industry, company size, revenue, headcount, location, corporate structure). Intent data, meaning active research and buying signals collected from third-party sources. Engagement signals, meaning the account’s interaction history with marketing, sales, and product. Modern scoring models update continuously rather than annually, and the better implementations consider hundreds of variables before assigning a score.
Firmographic data sources commonly used as scoring inputs include D&B (whose D-U-N-S identifiers track corporate family relationships across parent and subsidiary entities), ZoomInfo (which aggregates firmographic, technographic, and contact data), and Apollo (which combines firmographic data with outbound sales workflow). These are not mapping tools. They are inputs to the scoring layer that sits underneath the territory map. The territory plan defines who covers what. The scoring layer defines what gets called first within that coverage. Most enterprise sales organizations now use at least one third-party firmographic feed in addition to their CRM data, because internal data alone usually misses entity-level changes (M&A, location moves, executive turnover) that determine account potential.
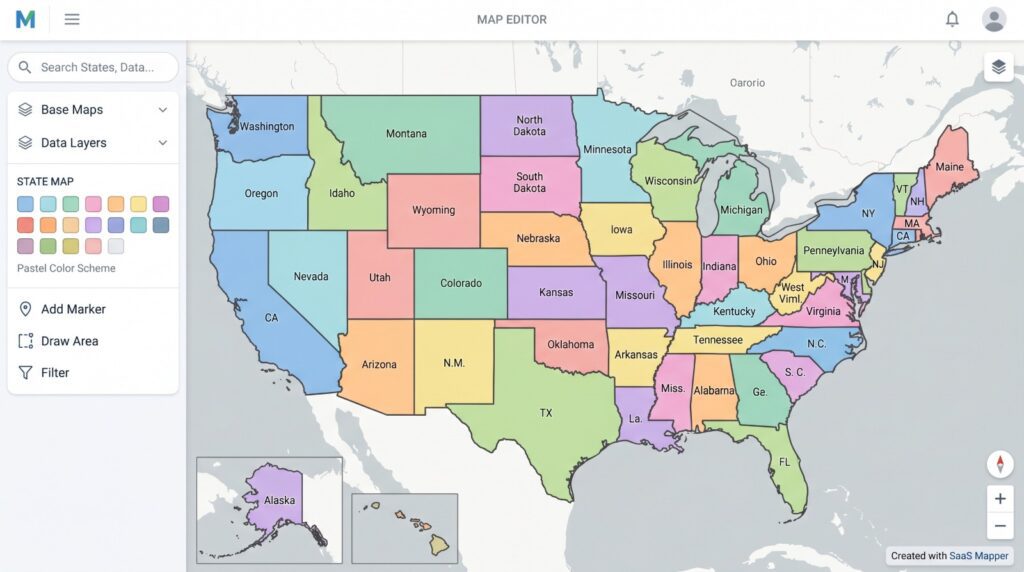
The carve-up methods themselves are well documented, and six recur in practice. Geographic, account-size (enterprise, mid-market, SMB), industry vertical, product line, revenue potential, and population density. Most mature organizations layer two or three. A pure geographic split rarely survives contact with an industry-specialized sales motion. A hybrid such as “healthcare accounts in metro Atlanta” matches how senior sales leadership actually thinks about coverage in 2026. The hunter-farmer split, where new-business hunters take greenfield prospects and farmers (account managers) take renewals and expansion, is efficient in mid-market and SMB segments where prospect volume is high enough to support specialization. Named-account models assign strategic customers to a specific rep regardless of geography and suit enterprise sales where lifetime value justifies dedicated ownership.
KPIs for Monitoring Territory Performance
A territory plan that is not monitored is a static asset depreciating in the background. The monitoring layer is what converts the plan into an operating discipline. Eight to twelve KPIs is the practical range. More than that creates reporting burden without analytical clarity, and the marginal metric usually adds confusion rather than insight.
The KPIs worth tracking sort into three groups. Revenue and activity metrics measure outputs. Coverage and penetration metrics measure inputs. Health and dispersion metrics measure the integrity of the plan itself. Mature monitoring rotates through all three groups every quarter rather than focusing on the revenue line alone.
Core KPI Definitions
Within each group, the definitions that matter most:
- Quota attainment by territory. The percentage of quota achieved by the rep covering the territory. The distribution across the team is more informative than the average. A tight distribution clustered near 100% indicates a balanced design. A bimodal distribution indicates a structural problem the average will hide.
- Revenue per account. Total revenue from the territory divided by the number of active accounts. Exposes territory health more accurately than aggregate revenue because it normalizes for territory size. A high revenue per account on a small book is a different finding from the same revenue spread thin.
- Average deal size by territory. Helps isolate the source of revenue differences across territories, separating deal mix from win rate. Two territories at the same revenue with different average deal sizes are running different motions and probably need different coaching, comp, and quota assumptions.
- Win rate by territory. Closed deals divided by qualified opportunities. Territory-level variance is normal and is not always a rep problem. The average B2B win rate across all opportunities is 21%. On qualified opportunities only, it rises to roughly 29%. Win rate varies by deal size. Under $50,000 deals run 25% to 35%. Deals of $50,000 to $250,000 run 18% to 28%. Deals over $250,000 run 12% to 22%, and deals over $1 million run 10% to 18%. Industry adds another layer of variance. Established service businesses run 60% to 80%. Manufacturing runs around 30%. SaaS runs 20% to 30%, dropping to 15% to 20% in highly competitive sub-segments.
- Territory coverage ratio. Customers and prospects contacted in the territory divided by the total available. Measures reach. A low coverage ratio means the rep has not reached most of the territory’s accounts, which is sometimes a capacity problem and sometimes a prioritization problem.
- Territory penetration rate. Customers in the territory divided by total potential customers in the territory, multiplied by 100. Penetration measures conversion of the addressable market into active customers. A penetration rate climbing year over year on a stable account count means the rep is winning share. A flat penetration rate on a growing account count usually means TAM is expanding faster than the rep can absorb.
- White-space ratio. The unsold portion of accessible accounts within a territory’s ICP. White-space analysis exposes accounts that are reachable, qualified, and not being worked. The supporting KPIs include segment penetration rate, account expansion revenue, competitive win rates, pipeline creation, and renewal uplift. White space is where the revenue lift from optimization usually lives, because covering accounts already inside the territory but unworked is faster than discovering new ones.
- Rep utilization. The percentage of available rep time spent on selling activities. The Salesforce State of Sales survey puts the average at 28% to 30% of the week. The remainder is absorbed by admin, internal meetings, prospecting research, and approvals. Forrester’s Activity Study, which tracked 3,031 reps, found the average rep loses roughly two full days per week to administrative work. Other studies put the selling-time figure between 35% and 40% for top performers. The gap between the average rep and the top performer translates to 5 to 8 additional selling weeks per year on the same headcount.
- Drive time as a percentage of selling time. The cost of physical coverage. Reducing it by 10 percentage points produces several additional accounts per rep per week in field-sales motions. AI-optimized routing has produced face-to-face customer time gains of up to 29% in field studies.
- Pipeline coverage ratio. Open pipeline divided by remaining quota. Coverage ratios below 3x for the current quarter usually predict an attainment miss. Coverage ratios above 5x indicate stalled pipeline that has not been adequately qualified.
Compound Metrics and Cadence
Two compound metrics earn their place alongside the primary list. A Gini coefficient on quota attainment captures dispersion in a single number that is easy to track across quarters. A territory-level white-space-to-revenue ratio captures how much addressable market is being ignored relative to what is being captured. Both surface structural problems faster than reading the raw distribution and both produce single numbers a sales leader can compare quarter over quarter without re-reading a dashboard.
The monitoring rhythm is usually quarterly for the full dashboard and monthly for the dispersion metrics. Reviews longer than a month allow problems to compound. Reviews shorter than a month do not allow enough data to accumulate for the dispersion measures to be meaningful. Geospatial platforms are used at this layer to visualize coverage, penetration, and rep utilization against actual territory boundaries, because the spatial relationships are difficult to read in a flat table. The map and the dashboard answer different questions about the same data, and serious monitoring uses both.
Disciplines of Mature Monitoring
One additional discipline distinguishes mature monitoring from immature monitoring. Mature monitoring tracks the KPIs at the rep level, the territory level, and the segment level simultaneously, because the same revenue number can look balanced at one level and unbalanced at another. A region that hits its number while masking three failing territories inside it is the most common form of hidden imbalance. The aggregate hides the variance, and the variance is the entire signal.
A second mature-monitoring discipline is benchmarking against the right comparison set. Comparing a SaaS territory’s win rate against an established service business’s win rate produces a false alarm in one direction or the other. Benchmarks have to be sourced from the same industry, the same deal-size band, and the same sales motion. Internal benchmarks (the same team, the same quarter last year, the same territory under the prior plan) are usually more actionable than external benchmarks because they hold most of the variables constant. External benchmarks are useful for sanity-checking the absolute level. Internal benchmarks are useful for measuring change.
A third discipline is treating the dispersion metrics as leading indicators rather than lagging indicators. Quota attainment is reported after the quarter closes, which means a leadership team waiting for the quarter-close report is reacting one quarter late. Pipeline coverage by territory, activity metrics by territory, and the white-space-to-revenue ratio are visible mid-quarter and predict the attainment dispersion that will appear at quarter close. Building a mid-quarter version of the dispersion view, even with partial data, gives leadership a one-quarter head start on the corrective conversation.
The Rebalancing Decision
The third operating layer is the rebalancing decision, meaning the moment when monitoring data triggers a redesign rather than a coaching conversation. The most common mistake at this layer is treating the territory plan as set-and-forget between annual reviews. By the time issues are identified, redesigned, communicated, and implemented under a once-a-year cadence, months of revenue have been lost. The consensus pattern in modern field sales is quarterly review combined with annual realignment. High-growth teams or teams with substantial turnover compress that to bi-annual realignment.
Legacy guidance that recommended realigning every three to four years is now considered too slow for SaaS, technology, medical devices, and real estate. The market does not move on a three-year clock. Sales teams that operate on one are absorbing the cost of misalignment for the full duration between resets, and the absorbed cost is rarely accounted for in the original plan.
Annual realignment locks in larger structural changes. Quarterly review catches the early signs of drift before they require structural change. A typical quarterly review pulls the three diagnostic reports (quota attainment dispersion, account count and TAM by territory, rep turnover by territory), compares them against the prior quarter, and identifies one or two patches that warrant a corrective adjustment short of a full redesign. The adjustment can be as narrow as moving a single underworked account or as broad as swapping coverage of an entire ZIP-code cluster. Mid-quarter swaps are sometimes necessary but should be the exception. Account continuity costs accumulate when boundaries move too often.
Trigger events that override the cadence
Five events force an immediate review regardless of the calendar.
- M&A activity. Acquisitions and divestitures change the account base, the ICP, and the rep headcount simultaneously. Waiting for the next scheduled review means selling against a plan that no longer represents the company.
- A major product launch. New products usually map to a different buyer or segment than the existing book. Territory definitions designed around the old product mix misallocate the new opportunity from the first day of launch.
- Substantial headcount change. A departure, promotion, or new hire creates a vacancy or a redistribution requirement that cannot wait. New sellers assigned to greenfield territories produce alarming failure rates because building a pipeline from scratch is harder than planners predict. Pairing new hires with existing books for the first one to two quarters is a documented mitigation.
- Loss or acquisition of a major customer. A single anchor account exiting or arriving changes the territory’s TAM and the rep’s workload at once. The rep with a vacated anchor account usually needs accounts moved in. The rep who lands a new anchor usually needs accounts moved out.
- Market expansion into a new region. Adding a new geography requires either redrawing existing patches or creating new ones, and either path needs a structured assignment rather than an ad hoc allocation. Ad hoc allocation in a new region is the most reliable way to produce a coverage gap that costs the first six months of pipeline.
Each trigger event should be paired with a documented playbook for the redesign. Improvisation at the trigger moment produces unforced errors. Documentation built in advance reduces the time from trigger to redesign decision and removes the negotiation over who gets which orphaned account.
Communicating the redesign
The mechanics of a rebalance are the easier half of the problem. The harder half is the human one. Frequent territory changes destabilize account relationships, and account-manager churn correlates with customer churn. The transfer of responsibility has to be paired with a transfer of trust, or the redesign produces a revenue gap before it produces a revenue gain.
Four practices reduce that gap. First, explain the criteria. Reps need to understand what drove the redesign (market potential, historical performance, strategic priority) and how the new design supports company goals. Transparency about the inputs is the most-cited driver of rep buy-in. Second, communicate early. People are bad at keeping secrets, and a drip of partial information fuels the rumor mill. Leadership and finance should be prepared first so they can advocate the change rather than react to it.
Third, involve reps in the design itself. Front-line reps understand nuances about their accounts that planners cannot see from a dashboard, and soliciting their input produces both better designs and better adoption. The reps who help build the plan are more likely to defend it when the inevitable complaints surface in the first month. Fourth, plan the rollout against the calendar. Realignments should land at the start of a new quarter or fiscal year when possible, and comp plans need a transition mechanism so reps moving accounts are not financially penalized for cooperating with the change. A two-quarter ramp on credit for transferred accounts is a common adjustment.
A formal change-management framework is now standard practice for any redesign that touches more than two reps. The Alexander Group three-stage model (Assessment, Design, Implementation and Change Management) is one structured approach, and the sales-operations literature describes similar phases under different names. The underlying point is the same. A redesign is a project, not a memo. Project structure produces sequencing, owners, deadlines, and accountability. Memos produce confusion and resentment.
A specific risk to flag at this stage is concurrent transformation. A Gartner December 2024 survey found that only 11% of sales organizations are able to drive commercial success while simultaneously executing a transformation. A territory redesign that lands during a separate company-wide transformation (a new CRM rollout, a re-segmentation of products, a leadership change at the CRO level) compounds risk. Either sequence the changes or accept the elevated probability of an attainment miss in the transition quarter and plan financial guidance accordingly.
The account-continuity dimension warrants its own discipline. Each transferred account represents an institutional relationship the receiving rep has not built. The receiving rep needs a structured handoff that includes the buying-committee map, the contract history, the open-issue list, and the renewal calendar. A handoff document that fits on a single page is insufficient for any account above the SMB tier. The departing rep should record a 20- to 30-minute briefing for each transferred account that the receiving rep can listen to before the first call. Skipping this step is the most reliable way to produce a customer-experienced drop in service quality immediately after a redesign, and a drop in service quality at the moment of handoff is a leading indicator of churn at renewal.
A final practical note. Territory redesign produces winners and losers among the rep population, and the losers will exit. Anticipating which two or three reps are most likely to leave after a redesign allows leadership to plan replacement coverage in advance rather than scramble for backfill. The expected-departure list is not a comfortable artifact, but its absence produces the worst version of the same outcome. The argument for absorbing this short-term cost is the longer-term revenue lift documented in the research on sales teams reexamining territory design, where the gains accrue over multiple quarters as the new design beds in.
Algorithmic Optimization and Its Limits
Machine-learning models for territory design have moved from research papers into routine practice. The AI-in-sales market was estimated at $8.8 billion in 2025 and is projected to compound at 32.6% annually through 2032 to reach $63.5 billion. Machine learning holds about 35% of that share in 2025. The territory-design use case is one of the more measurable applications because the inputs are quantifiable and the outputs map to revenue metrics that pre-date the technology.
Documented Gains from ML Models
ML-driven territory design constructs territories using customer density, firmographics, purchase behavior, and travel time as inputs. The models update continuously as market conditions move, replacing the once-a-year static exercise with a rolling recalibration. Three documented results illustrate the upper bound of what algorithmic redesign produces. A 2022 McKinsey field-sales study measured a face-to-face customer time increase of up to 29% from AI-optimized routing and territory shrinkage. A B2B technology vendor realigned territories with machine-learning models and reported a 19% attainment increase across previously underperforming segments. A payroll and HR vendor adopted an ML-driven platform in 2023, simulated three years of territory performance against the new design, and reported $42 million in incremental pipeline in the following fiscal year. Vendor-reported results carry the usual caveats. The directional finding holds. Algorithmic optimization consistently outperforms manual reassignment on workload distribution and travel efficiency.
Boundaries of Algorithmic Judgment
The limits are also documented. AI models cannot represent the rep-customer relationship history that determines if a transferred account renews. They cannot model tenure equity, meaning the fairness questions that arise when long-tenured reps are asked to give up books they have built. They cannot read the internal political dynamics that determine if a redesign is implemented or resisted in practice. Geography and TAM are quantifiable. Trust is not. Companies that have implemented ML-based territory tools well treat them as a recommendation engine and reserve the final decision for sales leadership, which has the context the model cannot access.
Two additional findings inform how algorithmic tools should be deployed. Companies using third-party automated territory-design tools complete the design phase 15 days faster and the planning phase 35 days faster than spreadsheet-only peers. Up to 75% reduction in territory planning time has been reported for technology adopters. The time savings are real even when the headline accuracy gains are smaller than vendors claim. The second finding is that companies using technology for territory planning achieve 10% higher sales attainment than the average. Organizations describing themselves as ineffective with technology see 10% lower attainment than average. The tooling itself is not the variable. The skill of the team using the tooling is.
The practical posture for sales leaders evaluating algorithmic optimization in 2026 is measured. The technology produces real productivity gains when applied to the quantitative layer (workload balancing, travel optimization, account scoring, white-space identification). It produces unforced errors when allowed to override the qualitative layer (relationship continuity, tenure considerations, change management). The territories that perform best are designed against the algorithm’s recommendations and softened by the human judgment the algorithm cannot replicate. The role of the sales leader in an ML-enabled territory program is not less important than it was. It is different. The decision points move from manual carve-up to evaluating and editing model output, and the leader who cannot interrogate the model is at a structural disadvantage to one who can.
Implementation Sequencing and Data Quality
Implementation sequencing matters as much as model selection. The teams that have produced documented results from ML-based territory tools share a common pattern. They begin with a single use case (usually drive-time optimization or white-space identification), validate the model output against the manual baseline on one quarter of data, and expand the scope of the model only after the first use case has produced measurable lift. Teams that attempt to deploy a full ML-driven redesign in a single quarter without prior validation usually produce a backlash from reps who reject the model’s output as opaque, and a backlash from leadership when the headline numbers do not arrive on schedule.
Data quality is the other persistent constraint. ML models trained on inaccurate CRM data produce confident-looking recommendations built on bad inputs. The 64% of organizations citing data quality as their top territory planning challenge are the same organizations that struggle to extract value from algorithmic optimization tools. A data-quality remediation pass typically precedes a serious ML deployment by at least one quarter, and the remediation work itself often surfaces opportunity (duplicate accounts, mis-segmented accounts, missing firmographics) that produces gains independent of the model.
Industry Cases and Account-Based Cautions
The post-COVID pharmaceutical industry offers a useful reference case for the limits of pure algorithmic optimization. In Europe, in-person physician interactions fell 75% during the pandemic, and roughly 85% of pharmaceutical sales respondents agreed virtual content and online meetings would remain core to engagement post-pandemic. The field force had already been declining for two decades before COVID accelerated the move to a hybrid representative model. The territory redesigns that followed could not be solved by algorithms alone because the underlying engagement model had changed. The shape of a visit was different. Pharma sales teams that rebuilt territories around a mixed remote and in-person engagement model produced better outcomes than teams that asked the algorithm to optimize the prior pattern with new constraints. The lesson generalizes. When the underlying sales motion is changing, the algorithm has to be re-anchored on the new motion before its recommendations are useful.
One more practical caution applies to algorithmic optimization in mature, account-based sales organizations. Models trained primarily on geographic and firmographic inputs underweight relationship density, which is the variable that most determines win rate in long-cycle enterprise deals. A territory recommendation that looks balanced on TAM and drive time may concentrate four or five strategic accounts away from the rep who has the existing executive relationships. The cost of breaking those relationships is invisible to the model and visible to the customer. Adding an explicit relationship-density input (number of named contacts the rep has at the account, recency of executive meetings, contract length) to the optimization can produce materially better recommendations in segments where the existing book is the primary value the rep is paid to maintain.
Frequently Asked Questions
What is the difference between sales territory design and sales territory optimization?
Territory design builds the structure from the ground up by defining how regions, accounts, or industries are divided and assigned. Optimization is the ongoing process of refining and improving those territories using performance data, customer potential, and rep capacity. Design creates the blueprint. Optimization keeps it effective as the market and team change.
What is sales territory alignment?
Sales territory alignment is the corrective process of reviewing and redistributing existing territories so each rep has a fair, manageable, and productive coverage area. Alignment sits between planning and management and is performed when an earlier design no longer fits the current team or market. The mechanics overlap with optimization, but alignment is typically scoped to a one-time corrective pass rather than a continuous operating discipline.
How many accounts should a sales rep have?
No universal benchmark exists. A reasonable planning anchor uses 1,500 selling hours per year. If a rep spends three hours per month per account, the carrying capacity is approximately 42 active accounts. Practical ranges across teams run from 75 to 150 accounts. The right number depends on product, sales motion, and required activity per account.
What is white space in sales?
White space refers to revenue opportunities that remain unexplored or lightly penetrated within existing markets, customer segments, and target accounts. White-space analysis surfaces accessible accounts within the ICP that no rep is actively covering. The supporting KPIs include segment penetration rate, account expansion revenue, competitive win rates, pipeline creation, and renewal uplift.
What is the hunter-farmer sales model?
The hunter-farmer model splits the sales role into two functions. Hunters chase new business and greenfield prospects. Farmers, also called account managers, own expansion, renewals, and upsell on existing customers. The split is efficient in mid-market and SMB segments where prospect volume is high and the activity profile of new acquisition differs sharply from the activity profile of account growth.
What is a named-account territory?
A named-account territory assigns specific high-value or strategic customers to a rep regardless of where those customers sit geographically. The model suits enterprise sales where account complexity, lifetime value, and multi-stakeholder relationships justify a dedicated owner. Named-account models often coexist with geographic territories for smaller accounts inside the same sales organization.
How do you calculate TAM for a sales territory?
Territory-level TAM equals average revenue per customer multiplied by the number of potential customers within the territory’s ICP segment. A bottom-up approach using firmographic counts and pricing assumptions is more accurate than top-down market-size estimates because it forces the planner to enumerate actual reachable accounts. SAM refines TAM downward to the portion realistically served. SOM refines further to the share realistically captured in the planning horizon.
What is the average B2B sales win rate?
The average B2B win rate across all opportunities is 21%. On qualified opportunities only, it rises to roughly 29%. Win rates vary widely by industry and deal size. Under $50,000 deals run 25% to 35%, while deals over $1 million run 10% to 18%. Established service businesses run 60% to 80%, SaaS runs 20% to 30%, and manufacturing runs around 30%.
What is the average sales rep turnover rate?
Voluntary salesperson turnover averages 15.9% annually in one widely cited survey. Larger samples put rep turnover at approximately 35%, against 13% for all industries combined. Territory imbalance is one of the most-cited drivers of voluntary sales turnover, because reps who believe their territory denies them a fair shot at quota begin interviewing rather than stay.
What is RevOps and how does it relate to territory design?
Revenue Operations is the function that unifies sales, marketing, and customer success operations under a shared data and process layer. In modern practice, RevOps owns territory design and segmentation, replacing intuition-based assignment by individual sales leaders. By 2026, 75% of high-growth B2B companies are expected to operate with a formal RevOps function, and companies with RevOps report 36% higher revenue growth than those without.
What is the difference between territory management and account-based selling?
Territory management organizes coverage around a geographic patch or account list and emphasizes travel efficiency plus defined ownership. Account-based selling concentrates on a defined set of high-value accounts with multi-stakeholder, multi-function teams assigned per account. Geographic territory scales early because it spreads coverage broadly. Named-account and ABM models scale better once a portfolio of high-value relationships exists to justify dedicated teams.
What is territory penetration rate?
Territory penetration rate equals customers in the territory divided by total potential customers in the territory, multiplied by 100. The metric measures how much of a territory’s addressable market has been converted into active customers. It is one of the cleanest indicators of how mature, underserved, or saturated a given territory has become at its current point in the lifecycle.


