


Sales territory success depends on seeing patterns spreadsheets hide. CRM data becomes actionable intelligence only when it exists in geographic space.
Mapping CRM data for territory analysis reveals inefficiencies in customer distribution, rep workload, and market penetration. This process transforms account records into visual intelligence that informs territory design and balancing. Organizations with clearly defined territories report 20-25% higher sales productivity.
Why Spreadsheets Fail to Show Territory Reality
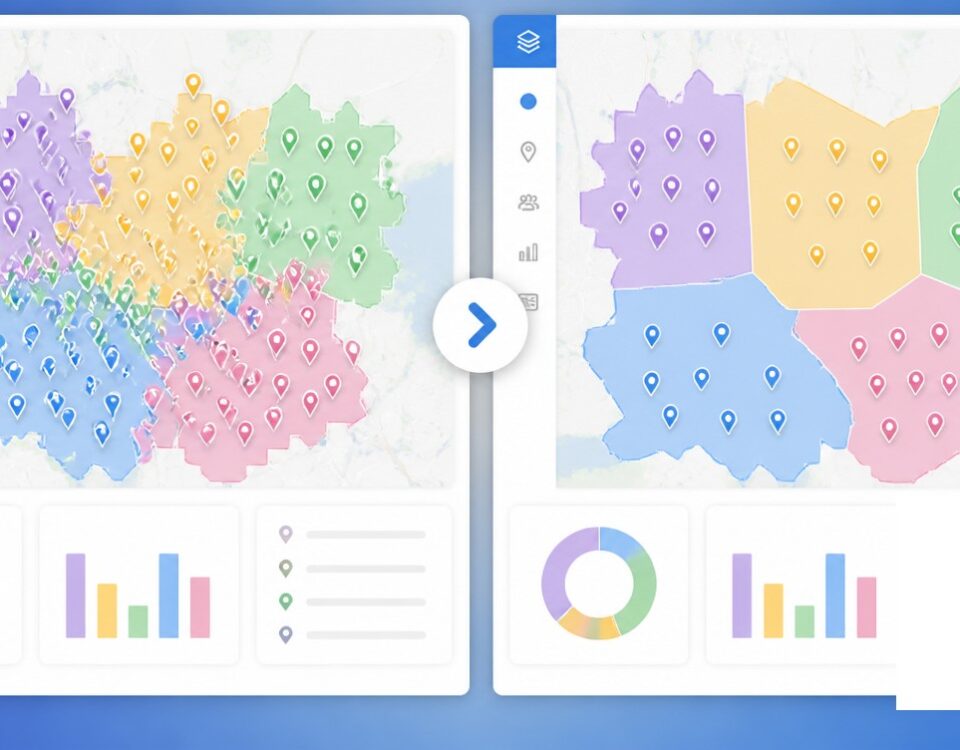
The moment your customer list exceeds a few dozen rows, patterns become invisible. A sales manager looking at 500 accounts in an Excel sheet cannot see clustering, cannot assess rep travel burden, and cannot identify neighborhoods with high customer concentration but no assigned coverage.
Spreadsheets flatten geography into text fields. An address stored as a text string has no location value. Territory decisions made from spreadsheets miss the spatial relationships that drive efficiency and sales outcomes.
Mapped data reveals what numbers alone cannot show:
- Coverage gaps: Areas with account density but no sales representative assigned
- Clustering patterns: Neighborhoods or regions where customers concentrate in unexpected ways
- Travel inefficiency: Representatives managing accounts scattered across wide geographies when nearby alternatives exist
- Revenue concentration: Revenue clustered in specific areas while territory assignments follow administrative divisions instead
Spreadsheets force territory decisions into binary categories: by zip code, by state, by rep count. Maps allow territory boundaries to follow the actual distribution of customers and potential, not administrative convenience.
Essential CRM Fields for Territory Mapping
Territory mapping requires specific data fields. CRM systems contain hundreds of possible fields, but mapping workflows depend on a smaller set of critical ones.
| Field | Data Type | Purpose in Mapping | Notes |
|---|---|---|---|
| Account Address | Text (Street, City, State, ZIP) | Geocoding to coordinate system | Must be clean. Formatting errors prevent accurate mapping |
| Account Revenue | Currency | Territory value assessment | Bucket into ranges. Used for balancing and scoring |
| Company Size | Number (Employee Count) | Account classification and territory fit | Signals ideal customer profile match |
| Account Type | Picklist (Enterprise, Mid-market, SMB) | Segmentation and rep assignment | Determines expected account value and rep capacity |
| Industry | Picklist | Segmentation and messaging | Enables targeting analysis by sector |
| Account Owner | Lookup (Sales Rep) | Current assignment visibility | Shows imbalance and overlap |
| Last Activity Date | Date | Account engagement status | Reveals stale accounts vs. active relationships |
| Deal Stage | Picklist | Pipeline visibility | Shows momentum and sales cycle position |
| Annual Contract Value (ACV) | Currency | Territory revenue potential | Combined with account count for workload balancing |
| Lead Source | Picklist | Relationship origin | Identifies which channels feed which territories |
The strongest territory mapping integrates account fundamentals (address, ownership) with business metrics (revenue, ACV, company size) and engagement signals (last activity, deal stage).
Data Preparation: The Critical Foundation
Territory mapping fails when data quality is poor. Preparation takes time but determines mapping success. Data that seems acceptable in a spreadsheet often proves unusable for geographic visualization.
Cleaning and Standardization
Address formats vary wildly across CRM systems. A record might read “123 Main Street, Denver CO 80202.” Another reads “123 Main Denver CO.” A 3rd shows “123 Main St Denver, Colorado 80202.” These represent the same location but inconsistent formatting prevents accurate geocoding.
Standardization rules ensure consistency:
- Abbreviate street types uniformly (Street becomes St, Avenue becomes Ave)
- Use consistent state abbreviations (Colorado = CO, not Col or Colo)
- Apply ZIP code validation to catch incomplete codes
- Remove special characters and extra spacing
Most CRM platforms include tools for bulk standardization. Maptive’s geocoding engine automatically corrects minor formatting issues during upload, including missing zip codes and abbreviated street names, accelerating preparation.
Deduplication
Duplicate records plague CRM systems. A single prospect appears 3 times under slightly different names. A company account exists in 2 variations. Duplicates distort territory analysis because the same location appears multiple times, inflating local account density and skewing territory balancing calculations.
Deduplication requires 2 passes:
- Exact matching: Identify records with identical names, addresses, and phone numbers
- Fuzzy matching: Catch near-duplicates where names vary by typo (Sara K. vs. Sarah Khan) or address formatting differs slightly
Research shows integrations and web forms produce 80% duplicate rates compared to 19% for imported CSVs. The duplication risk depends on data source.
Geocoding
Geocoding converts addresses into geographic coordinates (latitude and longitude) that mapping systems understand. Without geocoding, an address remains a string of text. With it, the address anchors to a precise location on the map.
Most mapping tools handle geocoding automatically. Upload a spreadsheet with addresses and the system returns coordinates for each row. The accuracy depends on address quality. Complete, standardized addresses geocode with high precision. Incomplete addresses (missing ZIP codes, abbreviated street names) may fail or geocode to the wrong location.
Common Data Quality Issues That Break Mapping
Data problems that pass CRM validation rules still damage mapping outputs. Territory analysis requires stricter validation than sales operations alone.
Missing address components: Accounts without street address, city, or ZIP code cannot be geocoded. These records appear as blank spaces on the map, creating misleading territory gaps and skewing workload calculations. A 2% missing address rate across 5,000 accounts means 100 invisible accounts.
Incorrect formatting: Phone number inconsistencies (1-800-555-1234 vs. (800) 555-1234) do not break mapping but inconsistent address formatting damages geocoding accuracy. Abbreviated street names (Blvd vs. Boulevard) may cause the geocoder to return wrong locations.
Stale accounts: Accounts with no activity in 2+ years should often be excluded from active territory calculations. Including them inflates territory size and territory balancing algorithms assign reps to non-existent opportunity.
Duplicate billing vs. shipping addresses: Some CRM systems store both. Mapping both creates confusion. Territory models should map a single canonical address per account.
Invalid ZIP codes or state mismatches: An account listed in Denver but with a Seattle ZIP code will geocode to the wrong location. These mismatches require manual review and correction before mapping.
The 1-10-100 principle applies to CRM data: fixing a record at entry costs $1, cleaning it later costs $10, and ignoring it can lead to $100 in lost revenue. Prevention through data validation rules and real-time error detection during entry is more effective than cleanup after the fact.
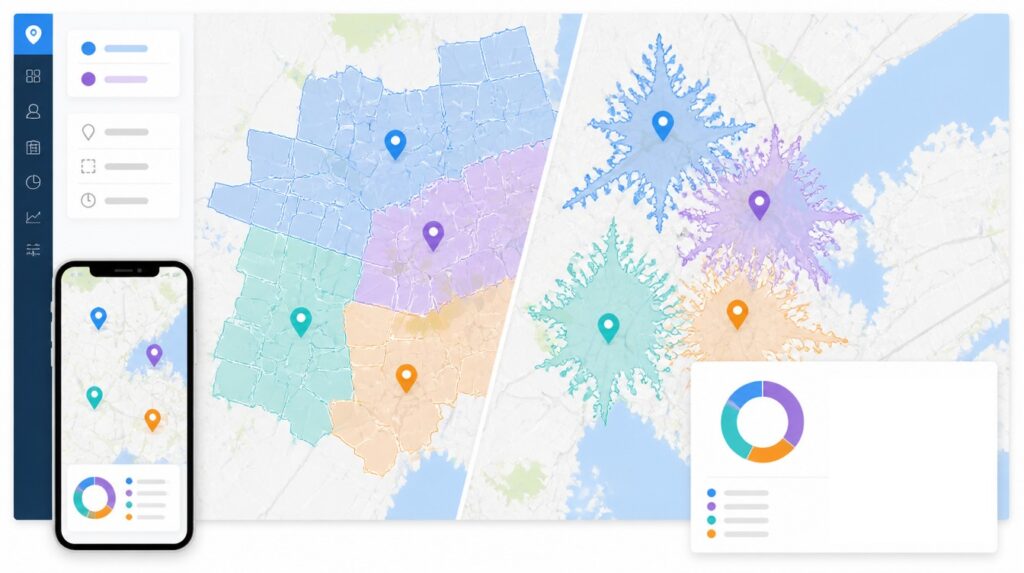
What Mapped CRM Data Reveals
Once clean CRM data maps to a geographic display, patterns emerge. Territory managers see not only the data but the space it occupies.
- Uneven account distribution becomes visible. 2 territories of equal rep count may contain vastly different account density. 1 region has 80 accounts in 200 square miles. Another has 150 accounts in the same space. The 2nd territory rep manages higher workload despite equal account count.
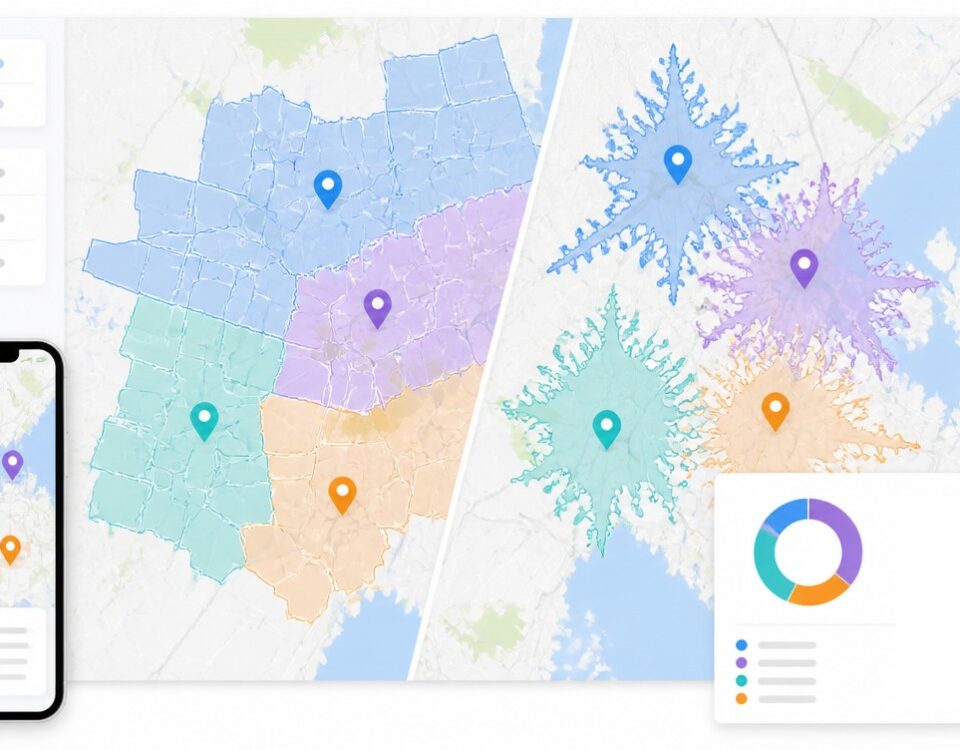
- Revenue concentration shows how revenue spreads across the territory or clusters in specific neighborhoods. If 40% of territory revenue comes from a 5-mile radius while 20% comes from the outer 25 miles, reps should focus differently. Travel time to low-revenue outer areas drains efficiency.
- Market penetration gaps appear when mapped demographic overlays are added. A territory contains 2,000 addressable businesses but the rep manages only 100 customers. The 1,900 gap represents opportunity. Mapped gaps guide expansion strategy.
- Rep workload imbalance becomes quantifiable. A visual map shows immediately which reps have customer clusters they can visit in short timeframes and which reps manage scattered accounts requiring extensive travel. Cutting travel time by 20% through better territory design frees hours for customer meetings and faster deal closures.
- Competing account assignments surface. Multiple sales reps managing accounts in the same small area indicates territory overlap and account confusion.
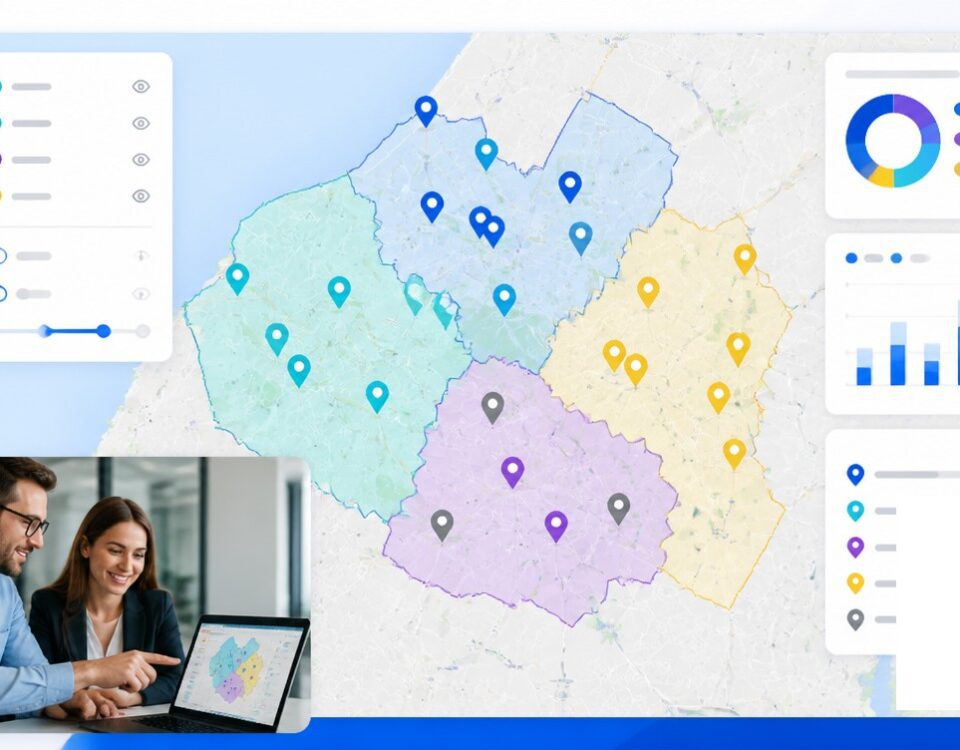
Layering Demographic Data for Territory Scoring
CRM data alone does not drive territory balancing. Demographic overlays enable smarter territory design.
Demographic data includes population density, median household income, age distribution, employment by industry, and household composition. These metrics describe the addressable market within a territory’s geographic boundaries.
Combining CRM account data with demographic data enables territory scoring. A territory with 100 accounts in a high-income region has different potential than 100 accounts in a declining area. Territory models without demographic context assign reps inefficiently.
Heat mapping shows account density through color. Overlaid demographic maps reveal where opportunity concentrates. A gap between customer density and demographic potential signals underpenetrated markets. Layering projected revenue, customer count, or pipeline potential shows how many prospects fall within each area.
Territory scoring formulas combine multiple dimensions:
- Account balance (40% weight): Count and revenue balance across territories ensures reps have similar workload
- Geographic balance (25% weight): Territory square mileage and travel time prevent a single rep from managing geographically unwieldy areas
- Market potential (20% weight): Demographic overlays identify which territories sit in high-opportunity markets regardless of current account count
- Engagement potential (15% weight): Territories with more active deal pipeline and shorter sales cycles score higher than those with stalled opportunities
This multi-dimensional approach beats simple account count balancing.
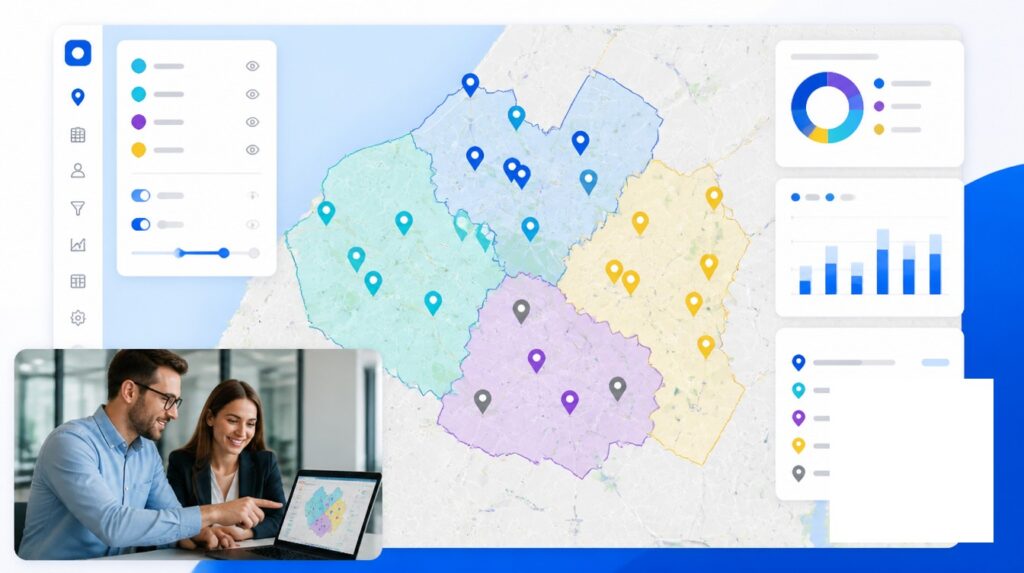
How Maptive Imports and Maps CRM Data
Maptive serves as the geographic intelligence layer for territory management. The platform integrates directly with major CRM systems including Salesforce, Zoho, Pipedrive, HubSpot, and Keap, pulling live customer data into mapped visualizations.
The workflow is straightforward:
- Connect your CRM or upload data: Maptive accepts direct integrations with common CRM platforms or accepts Excel, CSV, and Google Sheets uploads. Connection takes minutes. No complex configuration required.
- Maptive geocodes automatically: The platform’s geocoding engine processes hundreds of thousands of location data points. Upload a spreadsheet and locations plot on an interactive map within minutes. Geocoding happens in the background during upload, with automatic correction of minor formatting issues.
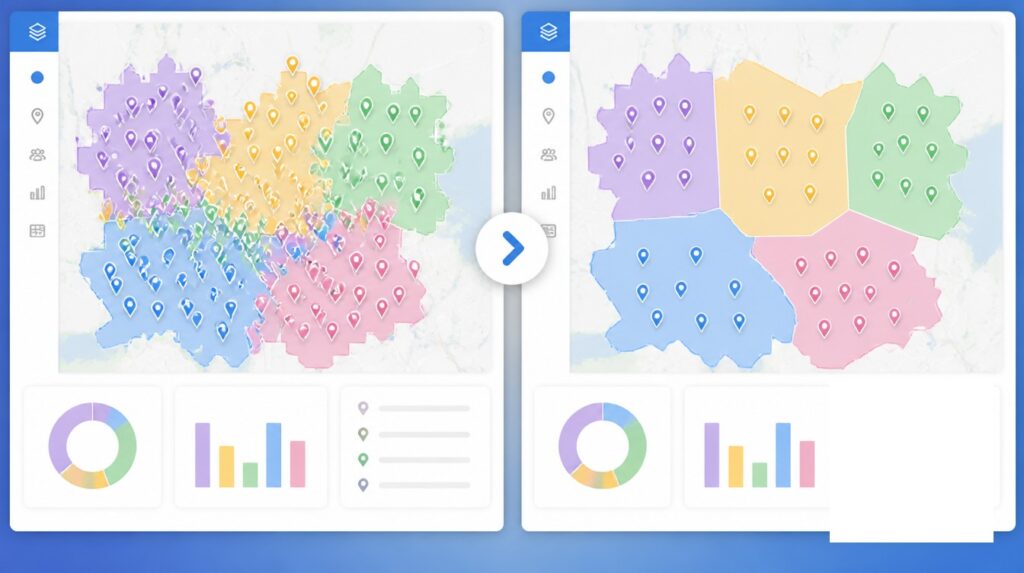
- Create territory boundaries: Use Maptive’s drawing tools to build custom territories or rely on the platform’s automated territory optimization. The Automated Territory Optimization (ATO) feature uses your CRM data combined with constraints of your choosing (sales rep location, customer locations, leads, sales numbers, population, market potential, and drive time) to automatically generate balanced sales territory maps.
- Layer demographic and market data: Maptive overlays population density, income distribution, industry concentration, and other demographic data to score territories beyond account count. Boundaries can be based on zip codes, counties, states, or custom-drawn areas.
- Analyze and adjust: Territory managers visualize coverage, identify gaps, compare rep workloads, and iterate on territory assignments before finalizing. Changes update in real time.
Maptive’s browser-based interface requires no software installation. Territory maps render on Google Maps, providing familiar navigation and zoom controls. The platform’s cloud infrastructure handles enterprise-scale geocoding without slowdowns.
Territory Balancing Based on Mapped Data
Once data maps, balancing becomes a technical exercise rather than a guessing game.
Territory balance addresses 3 dimensions:
Workload balance: All reps should have similar account counts adjusted for account type and revenue. A rep with 50 enterprise accounts has more work than a rep with 100 SMB accounts. Workload calculations should show account complexity, not only count.
Geographic balance: Travel time matters. A territory that sprawls across 500 square miles with accounts scattered at the edges imposes travel burden disproportionate to account count. Clustering accounts reduces travel, freeing time for selling. Geographic analysis identifies when reps spend more time driving than meeting customers.
Opportunity balance: Pipeline balance ensures no rep manages territories with weak opportunity. A territory with stalled deals and few prospects discourages high performers. Territory design should distribute pipeline and opportunity evenly.
Maptive’s ATO feature optimizes across all 3 dimensions simultaneously. Rather than a manager manually redrawing territories based on intuition, the algorithm generates balanced options based on explicit constraints and metrics.
The platform shows the impact of different balancing approaches:
| Territory Model | Avg. Account Count | Avg. Account Revenue | Avg. Drive Time (hrs/week) | Workload Score |
|---|---|---|---|---|
| By State | 125 | $450K | 8.2 | 68% |
| By County | 95 | $380K | 5.1 | 81% |
| By Drive Time (ATO) | 98 | $412K | 4.8 | 89% |
The automated approach consistently outperforms simple geographic division by reducing travel time while maintaining balanced workload and opportunity.
Moving Forward with Mapped Territory Analysis
Territory mapping transforms CRM data from an operational record into geographic intelligence. The process requires clean, standardized data but delivers proportional value.
The sequence is deterministic: clean the data, validate addresses, geocode to coordinates, visualize on maps, layer demographic context, balance across dimensions, assign territories, and monitor performance.
Each step removes assumptions and replaces them with evidence. Assumptions have no place in territory design when mapped data shows actual customer distribution, travel burden, and market potential.
Maptive’s geocoding and mapping capabilities eliminate the technical barriers to territory mapping. The platform accelerates data preparation, automates territory optimization, and provides the visibility sales leaders need to design territories that scale with business growth.
Territory mapping is not an optional exercise in sales operations. It is the difference between reactive territory assignments and data-driven territory design. Organizations that invest in mapping their CRM data for territory analysis optimize for rep productivity, customer coverage, and sustainable growth.


