TL;DR
- What is location intelligence? Analyzing geographic data like addresses, boundaries, and demographics to find spatial patterns that inform where and how a business operates
- Why don’t spreadsheets and dashboards cover this? They show what happened and when, but not where revenue concentrates, where coverage gaps exist, or why one territory outperforms another
- How is it different from GIS? GIS is the underlying technology, but it requires trained analysts and steep learning curves. Location intelligence applies GIS-grade spatial analysis through interfaces built for business users
- What data do you need to get started? Customer addresses from your CRM are the most common starting point. Boundary data like ZIP codes and counties, Census demographics, and time-stamped activity records add depth
- What spatial analysis techniques matter most? Heat mapping for concentration patterns, territory optimization for balanced sales regions, demographic overlay for market context, drive-time polygons for realistic service areas, and route optimization for field efficiency
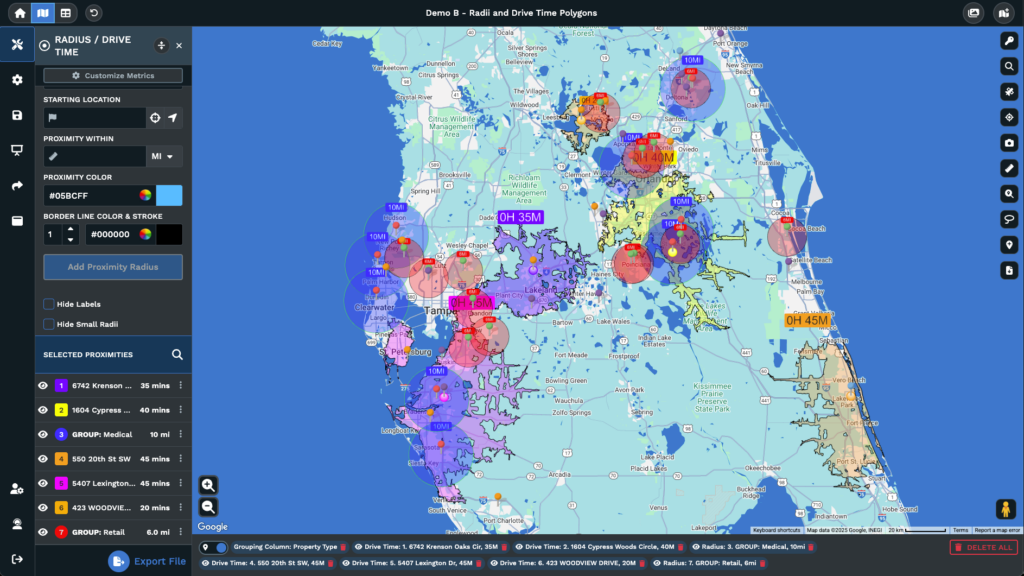
- How do drive-time polygons differ from radius circles? A 10-mile radius assumes equal accessibility in every direction, which ignores rivers, highways, and traffic. Drive-time polygons calculate along actual road networks and produce irregular boundaries that reflect real travel conditions
- What does the ROI look like? Maptive users have reported 18% fuel cost reductions, 15% revenue growth from territory optimization, 75% faster planning cycles, and quarterly savings exceeding $100,000
- How big is the location intelligence market? Grand View Research valued it at over $21 billion in 2024 and projects it will exceed $50 billion by 2030
- Where should a business start? Pick one high-stakes decision currently made without spatial analysis, run the geographic data through a mapping platform, compare the result to current practice, and quantify the difference
What Location Intelligence Means for Business Decision-Making
What Is Location Intelligence?
Location intelligence is the analysis of geographic data to identify spatial patterns that inform where and how a business operates. The data includes addresses, ZIP codes, coordinates, boundaries, and routes. Analysis distinguishes location intelligence from basic pin-mapping.
Thank you for reading this post, don't forget to subscribe!Plotting 10,000 customer records on a map creates a visualization. Reviewing the same data to identify underserved clusters, overlapping territories, and coverage gaps demonstrates the use of location intelligence.
This distinction is important because many businesses stop at the visualization step and assume they have gained all possible value. However, spatial relationships among data points, surrounding demographics, and market coverage only become apparent through analysis.
Grand View Research valued the location intelligence market at over $21 billion in 2024 and projects it will exceed $50 billion by 2030. This growth suggests that organizations recognize the usefulness of spatial analysis.
Why Spreadsheets and Dashboards Miss What Maps Reveal
A quarterly sales report sorted by region tells you which regions performed well. A bar chart makes it easier to compare them. Neither tells you anything about where within those regions the revenue concentrates, which high-median-income ZIP codes lack sales coverage, or why the top-performing territory is half the physical size of the lowest-performing territory.
Tabular and chart-based analysis answers what happened and when. It does not answer where it occurred or why it occurred. Spreadsheets lack a spatial dimension by design. For example, a sorted column does not show that 60% of revenue comes from 15% of a region, or that two high-performing sales representatives have overlapping territories, while a metropolitan area receives no coverage.
Industry research estimates that about 80% of business data contains a location component. When data remains in rows and columns, this aspect is often overlooked. Market Growth Reports states that 72% or more of Fortune 1000 companies use location-based insights for operational decisions, showing how many large organizations have addressed this issue.
The gap becomes concrete when you consider a specific scenario. A national sales team with 10,000 accounts tracks revenue, close rate, and customer lifetime value by region in a spreadsheet.
The spreadsheet shows the Midwest region outperforms the Southeast by 22%. This information is helpful, but it does not explain whether the Midwest outperformance is driven by a few ZIP codes or many, whether the Southeast underperformance is due to a coverage gap or demographic mismatch, or if the Midwest market is saturated while the Southeast has potential for expansion.
These questions rely on spatial analysis. Addressing them requires a map and tools for analyzing relationships among data points. Sorting, filtering, or using pivot tables in a spreadsheet will not reveal this information because the data format lacks a spatial component.
Location Intelligence vs. GIS vs. Business Intelligence: Key Differences
GIS, or geographic information systems, is the underlying technology for storing, managing, and analyzing spatial data. It is a powerful set of tools with a long history in government, utilities, and environmental science. It has also historically required trained analysts to operate. The software is dense, the learning curve is steep, and most business teams lack the staff or the budget to stand up a GIS operation.
Business intelligence tools like Tableau and Power BI analyze business performance and sometimes display results on a map widget. That map widget is useful for seeing where things are, but it does not perform spatial queries. It cannot optimize territory boundaries, calculate drive-time polygons along real road networks, or overlay Census demographic data at the block group level. A BI dashboard with a map layer is not the same thing as a spatial analysis platform, even though the screenshots might look similar.
Location intelligence combines elements from both approaches. It applies spatial analysis capabilities developed in GIS technology and presents them in a way that is accessible to business users. Business intelligence focuses on where things are and what has happened, while location intelligence examines the reasons behind events and explores possible outcomes under varying circumstances.
GIS is the core technology that powers location intelligence applications. Maptive is built on this model. It delivers GIS-grade spatial analysis through a browser interface on the Google Maps Platform, using WebGL rendering. Teams at Amazon, Coca-Cola, and Capital One use it without dedicated GIS staff. The spatial analysis runs in the background; the user focuses on the decision.
Types of Geographic Data Your Business Already Has
Address and Coordinate Data: Your Most Accessible Starting Point
Customer addresses, prospect lists, store locations, office and warehouse addresses, supplier records, and event locations are examples of commonly available geographic data. Many businesses maintain large numbers of these records in CRMs and spreadsheets.
Maptive’s geocoding engine converts street addresses into latitude and longitude coordinates automatically and processes large datasets per map. The system does not require perfectly formatted addresses. It accepts missing ZIP codes, abbreviated street names, and common formatting inconsistencies during upload. This type of data is widely available and serves as a practical starting point for spatial analysis.
Boundary and Territory Data: ZIP Codes, Counties, and Sales Regions
Geographic boundaries represent another key data category. ZIP code tabulation areas, county lines, census tracts, state borders, and custom sales territories fall under this type. Many businesses organize their operations by territory but may not have visualized those territories spatially or evaluated if their boundaries remain effective as the organization grows.
Maptive includes more than 43,000 US ZIP codes, all county and state boundaries, Canadian provinces, and UK postcode areas preloaded into the platform. No additional data import is required. Overlaying performance data on these boundaries enables identification of territories with imbalanced account distribution and highlights areas where boundary adjustments would be beneficial.
Demographic and Census Data: The Context Layer Most Businesses Ignore
Demographic data adds context to internal business metrics. Population density, median household income, age distribution, education, ethnic composition, and consumer spending patterns influence business performance by location.
Many organizations maintain internal performance data but do not combine it with external demographic information. Maptive integrates more than 50 US Census variables at multiple geographic scales, from the state to the block group. It also provides access to over 100,000 additional data layers covering consumer spending, healthcare utilization, and real estate values via data partnerships.
Layering internal performance data with these external variables enables users to identify locations with high customer concentration and assess potential areas for future growth.
Temporal and Behavioral Data: Movement, Routes, and Activity Patterns
The third data type incorporates a time component. Delivery logs, service call histories, sales visit records, and fleet GPS tracks all record when activity occurred at specific locations. This information highlights inefficiencies and uncovers new opportunities. It shows:
- The routes that waste the most hours every week.
- When certain locations hit peak demand.
- How coverage patterns change by day of the week.
Maptive’s route optimization and drive-time polygon tools analyze this type of data, converting time-stamped location records into actionable operational improvements.
How to Prepare Your Geographic Data for Location Intelligence Analysis
Step 1: Audit Your Existing Data Sources for Geographic Fields
Start by taking inventory. Check CRM records, ERP systems, sales databases, customer support logs, and accounting systems for any field that contains a location component. You are looking for address columns, ZIP codes, city and state fields, latitude and longitude pairs, territory assignments, and region codes.
Geographic data appears in a variety of business records. Invoice records include billing addresses. Warranty registrations record customer locations. Event RSVPs list attendee cities. Support tickets note the callers’ ZIP codes. Shipping logs document delivery addresses and timestamps.
The audit’s purpose is to compile an inventory of all organizational data sources that contain geographic information. This enables the selection of the most analytically valuable and complete records.
In many organizations, the CRM contains the most comprehensive set of customer location, revenue, product, and activity data. Supplementary sources contribute additional details beyond the CRM.
Step 2: Format and Clean Location Records for Import
Standard formatting enables efficient processing by the geocoding engine. Address data should be organized into columns: street address, city, state, and ZIP code. Country codes must remain consistent. Remove special characters that disrupt parsing.
Absolute accuracy is not required. Maptive’s geocoding engine corrects common issues during upload, such as abbreviated street names, missing ZIP codes, or inconsistent formatting. Prepare the data in CSV, Excel, or Google Sheets format with clearly labeled columns for platform recognition. Maptive supports direct Google Sheets integration and copy-paste import for smaller datasets.
Step 3: Geocode Addresses into Map-Ready Coordinates Using Maptive
Geocoding is the conversion of text addresses into latitude and longitude coordinates for plotting on a map. In Maptive, you upload your file, and the platform auto-detects address columns.
Cloud-based geocoding processes records and generates an interactive map. Datasets containing over 200,000 markers are supported without browser performance issues, using WebGL rendering and on-demand tile streaming. The result is an interactive map that users can manipulate, filter, and analyze upon completion.
Step 4: Validate and Enrich Your Map with Contextual Layers
After geocoding, review the results by checking for pins plotted in incorrect locations, which may indicate address quality issues in the source data. Examine familiar areas to confirm accurate placement.
Enhance the map by enabling demographic overlays, adding boundary layers, or importing additional datasets in Maptive. The split-screen view displays the spreadsheet and map simultaneously, allowing users to click a row to see its plotted location or a pin to view the underlying record. This transforms the display into an analytical workspace suitable for spatial analysis.
6 Spatial Analysis Techniques That Drive Business Decisions
Heat Mapping: How to Identify Concentration Patterns and Hotspots
Heat mapping is a density visualization technique. This approach displays where activity is highest across a geographic area by applying a color gradient. Cooler colors indicate less activity, while warmer colors indicate higher activity.
In Maptive, heat maps can be weighted by any numeric field in your data, which adds analytical value beyond visual appeal. For example, using customer count as the weight highlights locations with higher customer density. Weighting by revenue displays areas with higher sales, while weighting by support tickets highlights locations with more reported issues. These approaches use the same underlying data to address different analytical questions.
To create a weighted heat map in Maptive, select the Heat Mapping tool, choose the numeric column to weight by, and adjust the radius, opacity, and intensity settings. Radius controls how far each data point’s influence spreads. Opacity determines how transparent the overlay is against the base map. Intensity controls the sensitivity of the color gradient.
Adjusting these parameters alters the map’s focus. Running the same data at multiple settings can help determine which configuration provides the most actionable pattern.
A hotspot does not inherently indicate a positive or negative outcome. It represents a concentration that may require further analysis. For example, a revenue hotspot indicates strong earnings in that area, but could also suggest an overemphasis on that location at the expense of others. The heat map displays the pattern, while interpretation depends on the specific context.
Territory Management: How to Build and Optimize Balanced Sales Regions
Territory management involves dividing geography into regions and assigning each to a team member, representative, or operational unit. Well-balanced territories provide each representative with an equitable workload, reasonable travel times, and similar revenue opportunities. Poorly balanced territories can lead to burnout, turnover, lost potential, and inconsistent performance.
Maptive offers two approaches to territory creation. The first is manual. The Polygon Territory Tool lets you draw custom territory shapes freehand, while the Geographic Boundary Tool lets you build territories from existing boundaries like states, counties, ZIP codes, or census tracts.
Regions may be assigned one boundary at a time or grouped as needed. This approach suits organizations with internal knowledge of the territory structure, and that wish to implement it accurately.
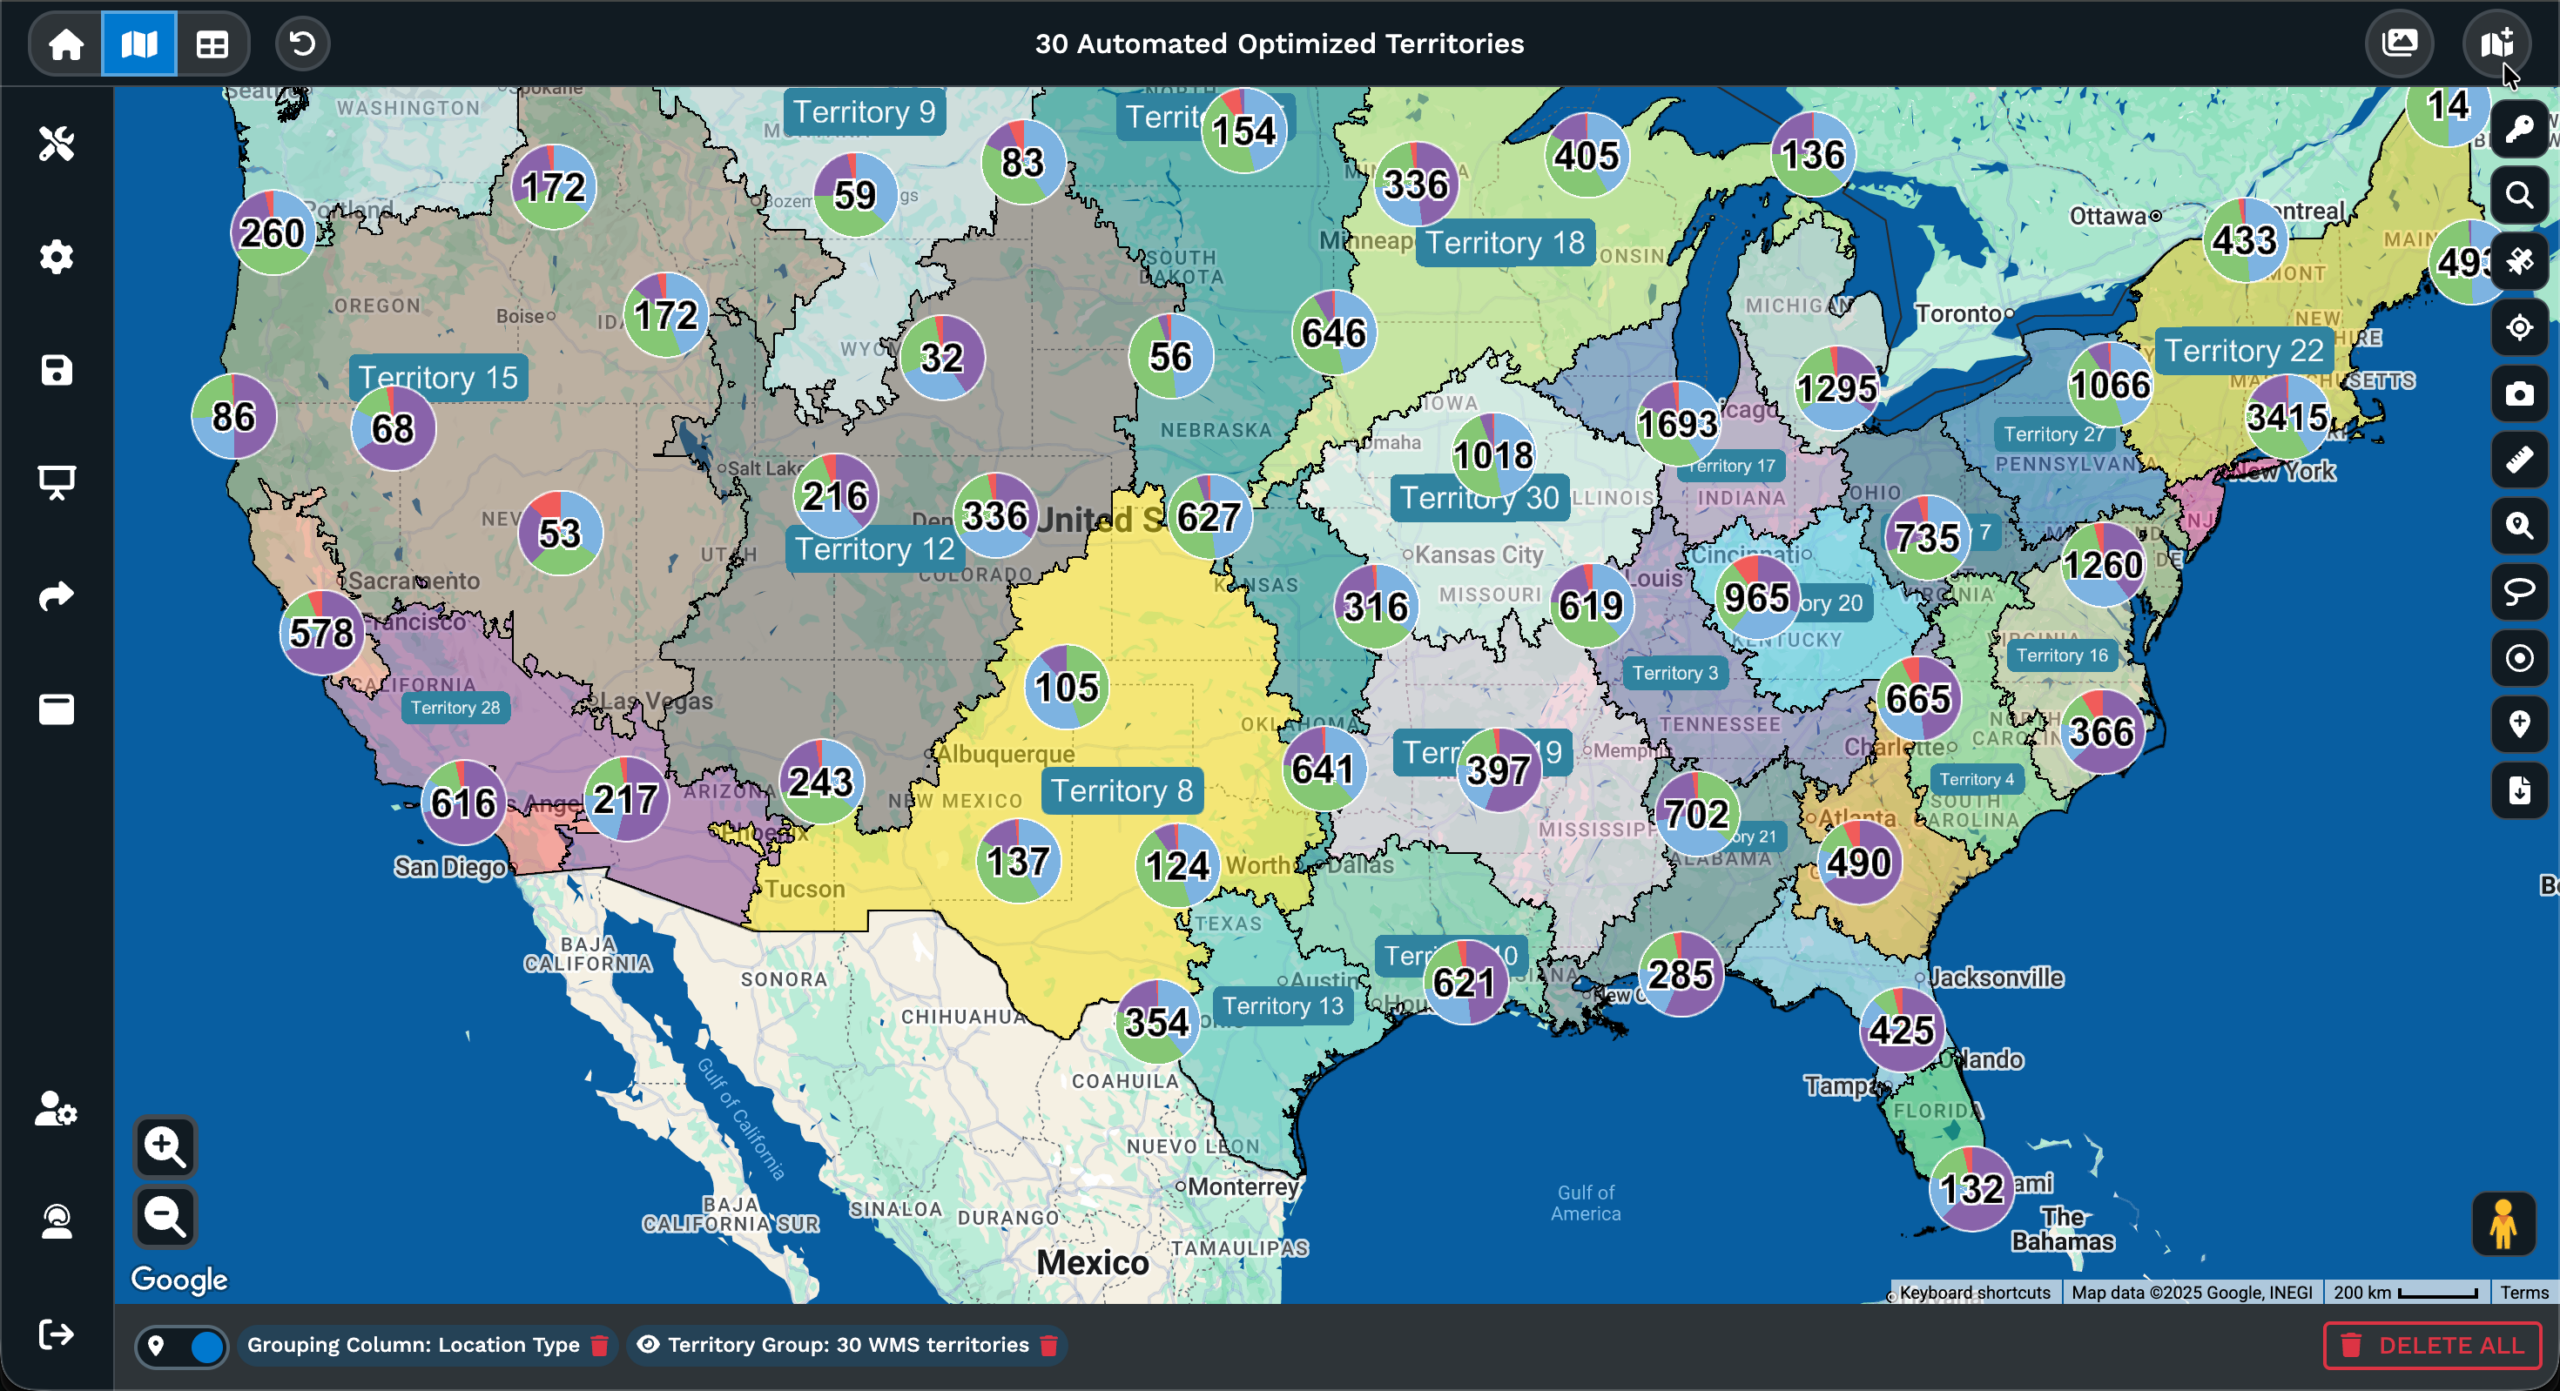
The second approach is automated. Maptive’s Automated Territory Optimization uses an algorithm to generate balanced territories based on constraints you define. You set the parameters:
- Maximum accounts per rep
- Drive time limits
- Rep home locations
- Existing structures you want to preserve
- Revenue targets
The algorithm uses customer locations, salesperson addresses, demographic data, and multiple data fields to produce territory assignments that simultaneously meet all constraints.
Balancing territories manually can be complex when satisfying multiple constraints across many regions. The automated approach addresses this optimization computationally, often yielding results more efficient than manual methods.
In practice, balanced territories offer similar revenue potential, manageable account loads, and reasonable drive times for each representative.
Maptive users have reported 75% faster planning cycles, 15% revenue growth, and 29% fewer overloaded territories after using automated optimization. Bulk editing enables managers to reassign many accounts at once when boundaries change, and one-click updates apply changes across multiple maps.
Demographic Overlay: How to Layer Census and Market Data onto Your Map
Demographic overlay combines your internal data with external population statistics to put your numbers in a market context. You might see a cluster of high-value customers in one area, but you cannot determine from internal data alone if there are more people with similar characteristics nearby or if you have already captured most of the addressable market in that location.
In Maptive, the Demographics Tool integrates more than 50 US Census variables at the state, county, ZIP code, census tract, and block group levels. Enable the median household income overlay at the ZIP code level, and underserved high-income areas become visible as gaps in your coverage.
The same logic applies to other variables: population density reveals areas with high demand potential but low presence, and age distribution shows where demographic profiles match your best-performing customer segments.
The choropleth mapping function aggregates any numeric field in your data across geographic regions using graduated color scales. You can display the sum, average, count, minimum, or maximum of any variable across boundaries, which turns raw numbers into a visual distribution you can act on.
A sales manager can see average deal size by county in a single view, rather than running pivot tables and trying to match county names to memory.
In addition to Census data, Maptive provides access to more than 100,000 data layers through partnerships, including consumer spending, healthcare utilization, and mobile signal data with 90% precision. These additional layers allow for more comprehensive overlay analysis than standard government demographics.
Internal performance data can be combined with consumer spending patterns at the ZIP code level, providing market intelligence that typically requires a separate data subscription and analysis tool.
Drive-Time and Radius Analysis: How to Define Realistic Service Areas
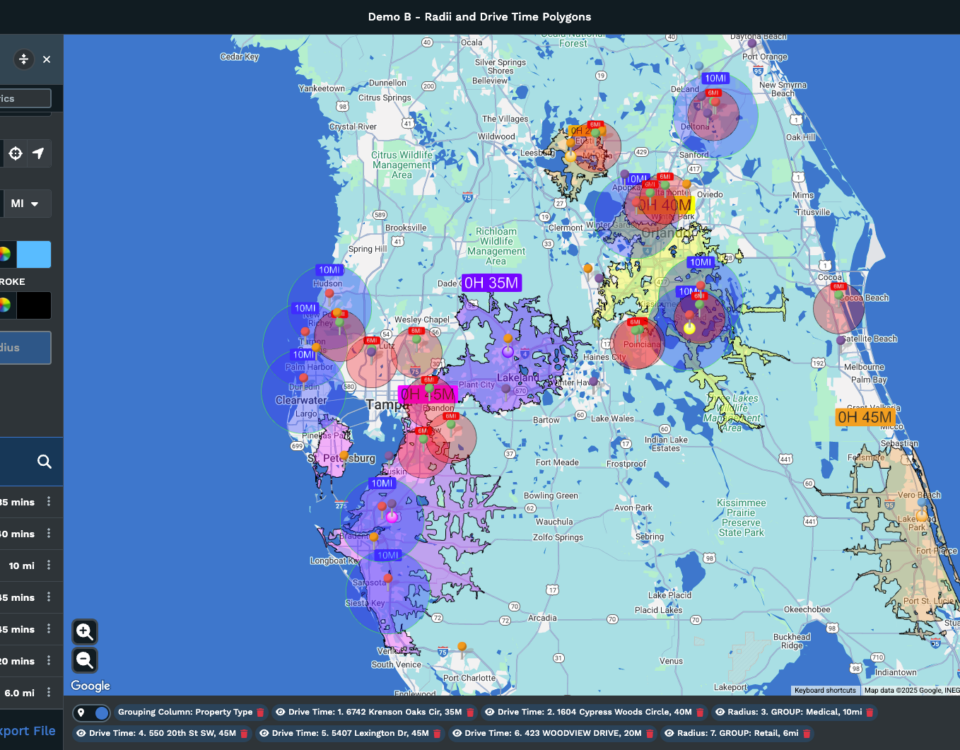
A radius circle drawn around a location measures distance as a straight line in every direction. That calculation assumes the world is flat and featureless, which it is not. A 10-mile radius might include areas that take 45 minutes to reach by car due to highway configurations, bodies of water, or congestion, while excluding areas 12 miles away that are reachable in 8 minutes via the freeway.
Drive-time polygons solve this problem by calculating along actual road networks. In Maptive, drive-time polygons use real road geometry with 300% more calculation points than previous versions and cover up to 8 hours of drive time. The resulting polygon is an irregular boundary that shows how far someone can actually travel from a given point, not how far a circle extends.
Use radius mapping for quick proximity checks and for exporting lists of records within a given distance. Use drive-time polygons for anything that depends on accessibility: site selection, coverage gap analysis, service area definition, and field operations planning.
Maptive’s Location Finder generates distance lists from any address to all mapped locations, which is useful for identifying the nearest store, office, or resource to any given point.
Route Optimization: How to Plan Efficient Multi-Stop Travel Paths
Route optimization determines the most efficient sequence of stops for a given set of locations. It is a computationally hard problem because the number of possible sequences grows factorially with each added stop.
A 20-stop route has over 2 quintillion possible orderings. No human is going to evaluate all of those and pick the best one, which is why most field reps plan routes based on habit and proximity rather than optimization, leaving substantial efficiency on the table.
Maptive’s route optimizer handles all-day stops per trip and is powered by Google’s Vehicle Routing Problem solver. The process: select your stops manually or use the lasso tool to draw around a cluster of data points, run the optimization, and Maptive sequences them for minimum travel time.
If certain stops need to be scheduled in a specific order due to time windows or priority, drag-and-drop customization lets you manually override the order without discarding the optimization of the remaining stops. The final route is exported as turn-by-turn navigation for mobile devices, so the rep does not need to manually transfer the plan.
Maptive users have reported an 18% reduction in fuel costs and a 22% increase in completed service calls following the implementation of route optimization. Those numbers compound.
Saving 30 minutes per driver per day across a team of 20 drivers equals over 50 hours per week, which translates into thousands of hours annually at loaded labor costs.
Multi-Variable Visualization: How to See Two Data Dimensions at Once
Single-variable maps show one thing at a time. Multivariate visualization shows two, revealing relationships between data fields that separate maps would miss.
In Maptive, the multi-variable grouping function colors markers by one field (product category, customer segment, lead source) while sizing them by another (revenue, order volume, account age).
A map that colors markers by product line and sizes them by annual revenue immediately shows which products dominate in which regions and where high-value accounts concentrate.
Bubble maps aggregate dense marker clusters into proportional circles sized by a numeric value, which is helpful at zoom levels where individual markers overlap. Pie chart clusters display the categorical composition within each cluster, answering questions such as “What is the product mix in this metro area?”
The filter tool allows users to refine the displayed data in real time using categories, numeric ranges, dates, and custom criteria to isolate the subset of data needed for analysis.
Location Intelligence for Site Selection: How to Choose Where to Expand
What Makes Site Selection a Spatial Problem, Not a Financial One
Most businesses evaluate potential locations by considering lease costs, square footage, and a general sense of the neighborhood. These are financial and qualitative inputs. However, they do not address the variables that more directly influence whether a location will succeed:
- Proximity to the right demographics.
- Drive-time accessibility for the target customer.
- Competitor presence or absence.
- The location’s relationship to the existing network.
A lower lease cost in a location with poor accessibility or mismatched demographics may ultimately be less beneficial than a higher lease cost in an area that aligns with business needs. McDonald’s Germany developed a systematic spatial analysis methodology to evaluate each new restaurant site, assessing drive-time accessibility, population density, and proximity to competitors before committing to a lease.
Warby Parker used data-driven expansion analysis to select retail locations based on online customer concentration, which indicated latent demand for physical stores. Both cases show that site selection outcomes improve when spatial data informs the decision rather than relying solely on financial inputs.
Reframing the site-selection approach offers practical benefits. Financial analysis focuses on cost, while spatial analysis focuses on value. Factors such as accessibility, travel time, surrounding population, and proximity to other locations contribute to a location’s value. These are geographic considerations addressed with geographic tools.
How to Score Potential Sites Using Maptive’s Demographic and Drive-Time Tools
A practical site-scoring process in Maptive follows five steps.
- First, plot your existing locations and enable demographic overlays to identify geographic areas where your target demographics are present but you have no current sites. These areas are likely to provide new opportunities.
- Second, generate drive-time polygons around each candidate site to define realistic trade areas based on actual driving conditions. A 15-minute drive-time polygon shows you the true catchment area for a given location, which is more useful than a radius circle that ignores roads and traffic patterns.
- Third, use the Demographics Tool to assess population, income, and consumer profiles within each candidate’s trade area. The question you are answering at this step: Does the population within this trade area match the profile of your best-performing locations?
- Fourth, check for cannibalization using radius mapping and drive-time overlap analysis to ensure a new location will not reduce revenue at existing stores. Spatial analysis can help prevent this type of expansion mistake.
- Fifth, use the filter tool to compare metrics across all candidate sites side-by-side. This produces a ranked list of sites based on spatial and demographic criteria.
Maptive’s 50-plus Census variables and over 100,000 data layers supply the inputs for this scoring process without requiring separate data purchases or third-party subscriptions. Maptive users have reported 34% faster site-selection timelines with this approach compared to their prior methods.
How to Identify Coverage Gaps and Underserved Markets Before Competitors Do
Coverage gap analysis is a technique that reveals where your business does not reach. Plot your locations, draw drive-time polygons around each one, and look at the geographic areas that fall outside every polygon. Those are the places your business does not effectively serve.
In Maptive, use choropleth mapping to visualize population density or income levels by ZIP code across the entire area, then overlay your drive-time polygons on top. Gaps between polygons in high-value areas can indicate expansion opportunities, viewable in a single display.
You can also filter the underlying data to focus on specific customer types or products. This refines the gap analysis to show not where you have no presence at all, but where you have no presence for a particular product line or customer segment.
Tasks that previously required a consulting engagement and weeks of analysis can now be completed in an afternoon with Maptive’s built-in boundary and demographic data. Organizations that regularly use this analysis can identify opportunities others may overlook.
Sales Territory Design and Optimization with Geographic Data
Why Most Sales Territories Are Unbalanced (and What It Costs)
Sales territories are usually drawn by a manager using a map and a list of accounts. These assignments often remain unchanged for years, even as the business expands, staff changes, and customer locations change.
Over time, some territories gain more accounts than a single rep can manage, while others have fewer. Drive times vary, with some reps spending much of their day traveling and others reaching accounts quickly. Revenue potential may be concentrated in certain territories, while others underperform due to fewer accounts, not rep performance.
These imbalances can affect the organization. Reps assigned too many accounts may leave, resulting in a loss of their knowledge and relationships. Those with too few accounts may become less engaged due to limited commission opportunities. Management faces challenges in evaluating performance fairly when territory design sets different starting points.
The Sales Management Association reports that companies with optimized territories see 14% higher attainment of sales objectives. Maptive data indicates 29% fewer overloaded territories following automated optimization. Not rebalancing territories can lead to rep burnout, increased turnover, wasted potential, and higher revenue concentration risk.
How Maptive’s Automated Territory Optimization Balances Workloads
Maptive’s Automated Territory Optimization begins with user-defined constraints. Users set the maximum number of accounts per rep, acceptable drive time ranges, each rep’s home location, any territory structures to preserve, and targets for revenue or workload.
The algorithm processes these constraints, using customer locations, salesperson addresses, and demographic data to generate territory assignments that meet all requirements. Results appear in a split-screen view, with territories shown on a map next to a spreadsheet of account assignments.
If adjustments are required, drag-and-drop editing allows movement of individual accounts or manual reassignment of entire regions. Bulk editing is available for relocating large numbers of accounts, and one-click updates apply boundary changes across linked maps.
A nationwide parts distributor cited in Maptive’s documentation completed a territory redesign in one afternoon using automated optimization, a process that previously required two weeks. The result was a more balanced distribution of revenue potential, account load, and drive time across the sales team compared to previous manual efforts.
When to Redraw Territories: Triggers That Signal Rebalancing Is Overdue
Several events may prompt a territory review, such as a new product launch that alters account values, entering a new market, staff changes, quarterly revenue differences between territories above 20%, changes in customer locations, or data showing that reps spend more than 30% of their working day in transit.
These conditions can reduce territory balance over time. A territory that loses 10 accounts to churn in a quarter and does not gain new ones begins the next quarter at a disadvantage. The assigned rep may earn less, experience lower morale, and become more likely to leave voluntarily.
A neighboring territory may gain 15 new accounts, and the rep assigned there may be unable to serve them all, resulting in lower satisfaction scores and longer response times. These issues may not be apparent in a revenue-by-territory spreadsheet until after negative effects occur.
Maptive’s automated optimization operates quickly enough to support quarterly territory reviews without causing disruption. Organizations that approach territory design as an ongoing process, instead of a single project, maintain more balanced workloads and achieve better revenue results.
Customer and Market Analysis Through Geographic Lenses
How Geographic Customer Segmentation Reveals What Patterns and Demographics Miss
Traditional customer segmentation organizes people by age, income, purchase history, or behavior. Geographic segmentation incorporates location as an additional variable, enabling detection of patterns that standard segmentation models may miss.
In Maptive, the grouping tool can color-code customers by value tier, product category, or acquisition channel. Spatial patterns can become apparent, such as high-value customers clustering near particular types of commercial areas.
Churn can sometimes be higher in specific ZIP codes that share a characteristic. One product line may have higher adoption in areas with older populations, while another performs better in areas with younger demographics.
Using the grouping tool alongside Maptive’s demographic overlay makes it possible to compare patterns with Census variables such as median income, education level, or household size. This approach helps determine if a spatial pattern points to a market dynamic or a coincidence. The next steps depend on the nature of each finding.
For example, if high-value customers cluster near affluent suburbs, this suggests a potential targeting strategy. If clustering occurs near older office locations, it may indicate tenure and familiarity rather than a demographic preference, suggesting that expanding presence in newer markets rather than focusing solely on demographic targeting may be more appropriate.
Market Penetration Mapping: How to Measure Where You Win and Lose
Market penetration analysis measures the portion of a market captured, defined geographically. In Maptive, the process starts by uploading and geocoding customer addresses. Enabling demographic overlays with population data at the ZIP code or census tract level, followed by choropleth mapping, visualizes customer count as a percentage of the total population in each geographic area.
This produces a map in which dark-colored areas indicate high penetration and light-colored areas indicate low penetration. Areas with low penetration and strong target demographics can indicate potential growth. Areas with high penetration represent established customer bases.
The filter tool allows for analysis by product, customer segment, or time period to observe penetration differences across the business. For example, penetration for one product line may be high across a region, while another product line has limited reach in the same market, highlighting a cross-sell opportunity that may not be apparent from aggregate data.
This analysis supports decisions on allocating sales efforts and marketing budgets by identifying areas with higher growth potential and those with already substantial market share. It also helps set realistic expectations; for instance, a 20% growth target is more challenging in a geography with 60% market share than in one with only 5%.
Geographic Marketing Spend Allocation: Targeting Budget Where It Matters
Marketing budgets are often allocated by region, headcount, or prior-year revenue. These methods do not account for spatial efficiency. A region can receive a large budget because it has a large sales team, even if the area has limited potential. Another region may be underfunded, despite including high-income ZIP codes with little or no marketing activity.
Maptive’s heat map, weighted by customer acquisition cost or marketing-attributed revenue, highlights where spend drives results and where it does not. Overlaying this data with demographic variables helps identify high-potential areas that receive limited or no marketing investment. This analysis often reveals a notable difference between resource allocation and opportunity.
Maptive users have reported a 27% reduction in regional marketing spend after reallocating budgets based on geographic efficiency analysis. These savings result from redirecting spending from areas with diminishing returns to those with greater potential demand. The goal is to use the same budget more effectively, not to reduce overall marketing spending.
Route Optimization and Field Operations: Reducing Cost Per Mile
The Compounding Cost of Inefficient Routing Across Field Teams
Routing inefficiency results in measurable losses. For example, if a field team of 20 representatives spends 30 extra minutes per day due to suboptimal route sequencing, this leads to more than 50 hours lost each week, or over 2,600 hours annually. When labor costs are factored in, this can create a six-figure expense for many organizations.
Fuel costs are also affected. Maptive users have reported 18% reductions in fuel expenses after implementing route optimization. More miles traveled also increase vehicle maintenance needs, and unfinished service calls may occur if time runs out.
Maptive users have also reported a 22% increase in completed service calls per day following the implementation of route optimization. Unoptimized routes can lead to missed revenue opportunities. Each additional mile driven increases vehicle wear, reduces the time available for customer visits, and increases the risk of scheduling conflicts.
For a field operation running five days a week and 50 weeks a year, small daily inefficiencies can add up to substantial, controllable costs for the business.
How to Plan Multi-Stop Routes in Maptive for Maximum Efficiency
In Maptive, route planning starts with selecting stops. Use the lasso tool to draw around a cluster of data points on the map, or pick them from the spreadsheet view. Run the route optimization, and Maptive’s algorithm, powered by Google’s Vehicle Routing Problem solver, sequences up to 73 stops for minimum travel time.
If certain stops must occur in a specific order, drag-and-drop customization lets you override the algorithm’s sequence for individual stops. The split-screen view shows the optimized route on the map and the stop details in the spreadsheet simultaneously, so you can verify the plan before committing. The final route exports as turn-by-turn navigation directly to mobile devices.
Running optimization daily or weekly instead of monthly accounts for changing conditions and can increase savings. Planning Monday’s route based on that day’s specific stops is more effective than using a weekly average. More frequent re-optimization reduces drive time and allows the team to focus on productive activities.
Drive-Time Polygons for Service Area Planning and Dispatcher Support
Route optimization applies to planning single trips. Service area planning defines which customers or requests are assigned to each field location.
Use Maptive’s drive-time polygons to define realistic service areas around each field office, warehouse, or technician home base. Where polygons overlap, you have redundant coverage that might indicate an opportunity to reassign accounts or consolidate resources. Where gaps appear, customers fall outside any reasonable response window. Dispatchers can use the Location Finder tool to identify the nearest available resource to a new service request in real time.
Drive-time polygons use actual road network data, with 300% more calculation points than prior versions, resulting in service area boundaries that reflect real driving conditions rather than theoretical circles. When operational decisions depend on travel times, this level of accuracy helps ensure planning is based on practical considerations.
Location Intelligence Applications Across 7 Industries
Location Intelligence for Retail and Franchise Operations
Retail and franchise businesses regularly address three spatial questions: site selection for new stores, territory definition for franchises, and minimizing overlap between locations. According to Mordor Intelligence, the retail sector accounted for 24.54% of the location intelligence market in 2024, representing the industry’s largest application area.
Maptive’s demographic overlays and drive-time polygons assist with site evaluation by identifying locations that match specific population characteristics and customer accessibility criteria. The Geographic Boundary Tool allows franchise operators to define territories by ZIP code or county, establishing a defined area for each franchisee with measurable market potential.
Radius mapping and drive-time overlap analysis identify cases in which a proposed location could divert customers from an existing store. Maptive’s preloaded 43,000 US ZIP codes and Census variables enable these analyses without the need to purchase additional data.
Location Intelligence for Real Estate and Commercial Development
Real estate developers and portfolio managers use location intelligence to assess property markets, evaluate development sites, and visualize holdings across locations. Choropleth mapping in Maptive displays property values, rent levels, or vacancy rates by geographic unit when users import their own data. Combining this with Census income, population density, and education data provides context to inform investment decisions.
Drive-time analysis measures a development site’s accessibility to nearby residents, influencing projections for foot traffic, lease value, and tenant demand. Owners of multiple properties can plot assets on a single map to evaluate geographic relationships, which supports decisions about acquisition, disposition, and capital allocation.
Location Intelligence for Healthcare and Public Health Planning
Healthcare organizations apply location intelligence to facility siting, patient accessibility analysis, and service area definition. A central question is whether people in need of care can reach a facility within a reasonable travel time. Maptive’s drive-time polygons provide a visual representation of the geographic area each facility serves, using current road conditions.
Demographic overlays of population density and age distribution data help planners align facility capacity with the local population’s characteristics. An older population in a specific area can increase demand for certain types of care; overlaying age distribution data on facility maps can highlight where demand may outpace capacity.
Maptive’s 100,000 data layers include healthcare utilization metrics that contribute clinical detail to geographic analysis. Public health agencies use similar methods to identify health disparities and plan mobile clinic routes for areas with limited access to care.
Location Intelligence for Financial Services and Insurance
Banks and insurers use location intelligence to evaluate branch networks, assess geographic risk concentrations, and detect fraud patterns. Branch network optimization applies the same spatial principles as retail site selection:
- Determining which branches serve target populations.
- Which are redundant.
- Where unmet demand may justify a new location.
As consumer banking behavior and branch traffic patterns change, the geographic rationale behind earlier branch networks may need to be revised. Maptive’s boundary tools and demographic overlays support this analysis without requiring separate data licenses.
Capital One, a Maptive customer, uses the platform for geographic analysis across its operations. Insurers use comparable techniques to assess risk concentration in policy portfolios, identifying areas where exposure is clustered and where natural events could generate related claims.
Location Intelligence for Field Services and Home Services
Field service companies manage technicians assigned to specific areas. Territory assignment with Maptive’s tools helps maintain manageable workloads and practical drive times between jobs.
Route optimization schedules daily service runs to improve efficiency, reducing time spent in vehicles and increasing the number of completed service calls.
Coverage gap analysis highlights areas where service demand exceeds technician capacity, helping managers decide where to hire or adjust assignments.
The lasso selection tool enables dispatchers to outline a group of incoming service requests and plan an optimized route for the nearest available technician. This approach replaces reliance on memory and familiarity with assignments informed by proximity and route efficiency.
Location Intelligence for Logistics, Distribution, and Supply Chain
Warehouse and distribution center placement depends on drive-time analysis. The objective is to position facilities so that as many customers or delivery points as possible fall within an acceptable travel window. Maptive’s drive-time polygons provide a visual, interactive way for logistics planners to test different facility locations and observe how each affects the coverage map.
Delivery route optimization lowers per-trip costs for each vehicle in the fleet. Supply chain risk mapping displays geographic supplier concentrations and identifies single points of failure when too many suppliers are located in the same region.
A natural disaster, port disruption, or regional labor issue in a concentrated supplier area can halt production, and this concentration may not be apparent without mapping. Maptive users in logistics and distribution have reported quarterly savings exceeding $100,000 from combined route and territory optimization.
Location Intelligence for Nonprofit, Government, and Education
Nonprofits and government agencies allocate resources based on geographic need, making their decisions spatial in nature, even if not explicitly recognized as such.
Maptive’s Demographics Tool provides the Census variables these organizations require for equity-focused planning:
- Poverty rates
- Educational attainment
- Population density
- Ethnic composition at the block group level
Outreach territory planning helps field teams prioritize areas with the highest need and avoid duplicating efforts where services are already established.
Constituent mapping assists elected officials and advocacy organizations in locating areas with concentrations of supporters, informing outreach strategies and resource allocation. Grant applications benefit from including data-supported maps that demonstrate the geographic distribution of need.
The American Red Cross and Stanford University are both among Maptive’s named customers, using the platform for geographic planning and analysis across their programs.
How to Measure the ROI of Location Intelligence
4 Categories of Location Intelligence ROI: Cost, Revenue, Speed, and Risk
Location intelligence provides measurable benefits in four categories: cost, revenue, speed, and risk. Tracking each area individually strengthens the business case.
Cost reduction includes fuel savings from route optimization, lower lease expenses from improved site selection, and reduced marketing spend from geographic targeting. Maptive clients have reported quarterly savings exceeding $100,000 and a 27% decrease in regional marketing spend through geographic reallocation.
Revenue gain includes increased sales from balanced territories, new revenue identified by covering coverage gaps, and improved conversion rates driven by demographic-informed targeting. Maptive clients have reported 15% increases in revenue associated with territory optimization.
Speed improvement consists of shorter territory planning cycles (75% reduction reported), quicker site selection (34% reduction), and reduced time to stakeholder approval when decisions use visual map-based analysis (36% faster, according to Maptive data).
Risk reduction includes avoiding poor site investments, identifying geographic supply chain concentration risks, and reducing sales team turnover driven by overloaded territories.
How to Build a Location Intelligence Business Case for Leadership
A practical business case follows four steps. First, identify two or three specific decisions the organization currently makes without spatial analysis. Territory assignments, site evaluations, and route planning are the most common starting points because they have measurable inputs and outputs.
Second, estimate the current cost of those decisions. How many hours does territory planning take each cycle? How much fuel does the field team burn per month? What did the last bad site selection cost in terms of lease obligations, buildout expenses, and lost revenue? These numbers are usually knowable but rarely calculated, which is why the business case often surprises people when they see the total.
Third, estimate the improvement based on published benchmarks. Territory optimization has been associated with sales increases of 7 to 15%. Route optimization has achieved fuel savings of 15 to 22%. Site selection has been completed 34% faster with reduced error rates. Apply conservative versions of these percentages to your organization’s numbers, and the projected return becomes concrete.
Fourth, calculate the annual value against the platform cost. Maptive’s Pro plan runs $1,250 per year and includes all 60-plus tools. The Team plan covers five users at $2,500 per year.
A territory rebalance that increases sales performance, or one avoided poor location decision, can offset the annual software cost within the first quarter. The financial impact is substantial because the decisions informed by location intelligence typically involve significant amounts relative to the software cost.
5 Location Intelligence Mistakes That Undermine Your Analysis
Mistake: Treating Pin Placement as the End Goal Instead of the Starting Point
This error occurs frequently. A team uploads data, views pins on a map, takes a screenshot, adds it to a slide deck, and treats the process as complete. A pin map is a starting point. It displays locations, which is helpful, but further analysis is needed.
Analysis should continue after the pins are displayed. Use a weighted heat map to identify concentration patterns. Enable demographic overlays to examine market data. Draw drive-time polygons for realistic service areas. Optimize territories for balanced coverage. In Maptive, the pin map serves as the workspace for analysis, not the final product.
This mistake often continues because the pin map appears impressive. The visual density and unfamiliar geographic context can give the impression of insight.
Viewing data on a map and analyzing data on a map are separate activities. Viewing provides an impression, while analysis leads to actionable results. Each pin map should prompt a follow-up question: What spatial analysis would support a decision?
Mistake: Using Radius Circles When Drive-Time Polygons Are More Accurate
A 10-mile radius around a location assumes uniform accessibility in all directions. That assumption is false in nearly every real-world geography. Rivers, mountains, highway configurations, and traffic patterns all mean that the same distance takes vastly different amounts of time depending on which direction you travel.
This radius might include areas across a river that take 45 minutes to reach because the nearest bridge is 8 miles out of the way, while excluding a suburb 12 miles away that can be reached in 8 minutes via a straight highway.
Drive-time polygons in Maptive are generated using real road networks, resulting in irregular boundaries that indicate where people can travel from a starting location. A 15-minute drive-time polygon typically does not resemble a circle, making it a more accurate representation of a service area than a simple radius.
For decisions involving accessibility, such as site selection, service area planning, and coverage analysis, drive-time polygons provide more precise data than radius circles. Use drive-time polygons when analysis requires information about who can access a location and the time required to get there.
Mistake: Analyzing Location Data Without Demographic Context
A cluster of customers looks like a strong market. Until you overlay income data and discover the area is in a rapid demographic transition. Or until you see that the population is declining. Or until you realize that the median household income has dropped 15% over the past decade, which means your current customer base may be aging out of your price point.
Internal data provides insight into business operations. Demographic data provide information about the surrounding market, and these datasets may not align. A territory with strong revenue can exist in an area with a declining population base. Conversely, a territory with weaker performance may be located in an area experiencing growth, but lacking an established presence.
In Maptive, Census overlays are enabled with one click. Skipping this step results in decisions based on incomplete information. Spatial analysis is improved with demographic context, and including it is straightforward.
Mistake: Drawing Territories Once and Never Rebalancing Them
Territories balanced 18 months ago may no longer be balanced. Customer churn, acquisitions, market changes, and personnel shifts alter workloads. Without rebalancing, small differences can become larger over time: some representatives receive more assignments while others receive fewer, which can affect revenue distribution.
Maptive’s Automated Territory Optimization runs fast enough to make quarterly rebalancing practical. The cost of not rebalancing is measurable in overloaded reps, underperforming territories, and revenue left uncaptured.
Mistake: Keeping Location Intelligence Siloed in One Department
When the sales team uses mapping, but the marketing team does not, the marketing team makes targeting decisions without seeing where customers cluster. When operations plan logistics without a territory context, routes and service areas conflict with sales coverage.
When leadership approves an expansion without spatial analysis, site decisions may rely on intuition rather than data. Each department can make decisions that appear reasonable for its own needs, but these may not align with the overall geographic requirements.
Maptive’s password-protected sharing, embeddable interactive maps, and presentation-quality exports at 5,120 x 3,200 pixel resolution are designed to spread geographic insights across teams without requiring every user to learn the platform.
A sales manager can build the analysis, and a marketing director can use the shared map to view the same data from their own perspective. Role-based access controls let each department view the data relevant to their decisions without exposing sensitive fields belonging to other teams.
Organizations benefit most from location intelligence when they treat it as a corporate resource rather than a departmental tool. This approach does not mean every employee must be a mapping expert. Instead, those who create geographic analyses should share them with decision-makers.
How to Build a Location Intelligence Practice Across Your Organization
Phase 1: Start With One High-Impact Decision and Prove the Value
Select a specific business decision currently made without spatial analysis and with measurable stakes. Examples include a territory rebalance, a site evaluation for an upcoming expansion, or a routing improvement for the field team. The selection criteria are straightforward: focus on the decision with the highest financial impact and the data most readily available.
Upload the relevant data to Maptive, perform the analysis, compare the result to current practices, and quantify the difference. If territory optimization results in a more balanced distribution than the current one, calculate the projected revenue impact. If route optimization reduces driving time by 20%, estimate the annual reductions in labor and fuel costs.
This approach provides a concrete example. Rather than relying on a theoretical argument for location intelligence, it demonstrates a specific decision improved by geographic data analysis. The resulting evidence supports subsequent efforts. Maptive’s free trial and 45-Day Pass at $250 allow teams to carry out this pilot without a long-term commitment or procurement process.
Phase 2: Expand Access with Shared Maps and Team Collaboration
After the pilot yields a measurable result, the next step is to make the maps and analyses accessible to other team members who did not participate in the initial project. The pilot provides evidence of value. This phase tests the ability to scale.
Maptive’s Team plan at $2,500 per year for five users supports multi-user collaboration with shared maps, password-protected links, and embeddable interactive maps. High-resolution exports in PNG and PDF formats are suitable for boardroom presentations when interactive maps are impractical.
At this stage, geographic analysis moves from being limited to a single person’s screen to becoming a shared organizational resource referenced by multiple teams. For example, a territory map shared with the marketing team helps guide targeting, while the same map provided to operations assists with service area planning. Different stakeholders gain coordinated outcomes when they use the same data from their respective perspectives.
Maptive user data indicate that decisions supported by visual map-based analysis receive stakeholder approval 36% faster, supporting the practical benefits of shared access.
Phase 3: Embed Location Intelligence into Recurring Business Processes
The final stage incorporates spatial analysis into the organization’s regular decision-making cycle. Territory reviews are scheduled quarterly and use Maptive’s automated optimization. Site evaluations apply a standard scoring method based on demographic overlays and drive-time analysis.
The marketing budget allocation includes a geographic efficiency review. At this point, location intelligence is integrated into the organization’s operations rather than remaining a separate project.
CRM integrations with Salesforce, HubSpot, and Zoho keep Maptive’s maps synchronized with live customer data, so the geographic view stays current without manual re-uploads. When a new customer closes in Salesforce, it appears on the map. When an account churns, the coverage picture updates accordingly. For organizations with specific workflow needs,
Maptive’s REST API enables custom integrations that automatically import data and export analyses. This level of connectivity enables a mapping tool to function as an operational system that supports decision-making at the required business pace.
Data Privacy and Governance in Location Intelligence
What Businesses Need to Know About Location Data Privacy Regulations
Two regulatory frameworks are relevant for businesses using location intelligence: the General Data Protection Regulation in the European Union and the California Consumer Privacy Act, along with its successor, the California Privacy Rights Act, in the United States. Several US states have enacted or are developing additional privacy laws that impact the use of geographic data.
Location intelligence for business typically operates on aggregated or anonymized geographic data:
- Addresses stored in a CRM.
- Census demographic statistics.
- Administrative boundary data.
This differs from real-time individual location tracking, which entails substantially higher regulatory requirements. The distinction reduces but does not eliminate privacy obligations. Customer addresses are personally identifiable information, and their use in any analytical context should comply with the terms under which they were collected.
Businesses need to align their data-handling practices with applicable regulations, particularly when combining customer address data with external demographic or behavioral data. Practical steps include documenting the data sources used in location analysis, restricting access to address-level data to authorized personnel, and preferring aggregated views over individual-level data when sharing analyses with wider audiences.
Businesses can extract analytical value from geographic data by adhering to the governance standards required by regulators and customers.
How Maptive Protects Geographic Data with Enterprise-Grade Security
Maptive’s security infrastructure protects data in transit and at rest. The platform uses 256-bit SSL encryption, supports two-factor authentication and single sign-on, and provides role-based access controls allowing administrators to specify which users can access particular maps, tools, and data columns.
Password-protected sharing enables organizations to control who can view and interact with map data. The platform operates on enterprise cloud infrastructure with geographic redundancy. For organizations with compliance requirements in regulated industries, Maptive’s security approach supports standard enterprise security policies and audit processes.
Getting Started with Maptive: Your First Week of Location Intelligence
Day 1 to 2: Upload Your Data and Create Your First Map
Begin by starting the free trial at Maptive.com. A credit card is not needed. Prepare a CSV or Excel file containing your most complete dataset. Customer addresses often serve as an effective starting point, as these records are the most numerous and contain the most geographic details. If your CRM enables a full export with address fields, select that option.
Upload the file. Maptive will automatically detect columns and geocode addresses. After processing, an interactive map of your data is available. Use the split-screen view to compare the plotted locations to your spreadsheet and verify accuracy. If a pin appears out of place, select it to review the original address record.
Some geocoding mismatches may occur, often due to formatting issues in the source data. These can be corrected before the next upload. Adjust the map position and zoom to display your entire area of interest. At this stage, the map is ready for spatial analysis.
Day 3 to 4: Run Your First Spatial Analysis
Select a technique that addresses your primary business question. To view customer concentration, use a weighted heat map. To evaluate territory balance, apply the Geographic Boundary Tool and display account distribution by ZIP code or county. To assess a new location, create drive-time polygons around the site and enable demographic overlays.
Focus on applying a single tool at a time. Run one analysis and review the results. Share the findings with the colleague who will benefit most from viewing the data in a geographic format.
Day 5 to 7: Share Results, Gather Feedback, and Plan the Next Analysis
Export the map as a high-resolution PNG or PDF for presentations, or create a password-protected link for interactive sharing. Present the analysis to the stakeholder whose work is most influenced by the data. Ask two questions: What new information does this map provide, and what further data could improve its usefulness?
Use stakeholder feedback to plan the next analysis. Repeating this process helps integrate location intelligence into regular business practices instead of treating it as a single exercise.
With each analysis, users become more comfortable with the tools, identify new questions, and increase organizational knowledge of geographic data.
Location Intelligence FAQ: Answers to the Most Common Questions
What Is Location Intelligence and How Does It Work?
Location intelligence involves analyzing geographic data such as addresses, boundaries, coordinates, and demographics to identify spatial patterns that support business decisions. By geocoding location data, visualizing it on interactive maps, and applying spatial analysis techniques such as heat mapping, territory optimization, and drive-time modeling, users can uncover spatial relationships that are not apparent in spreadsheets and charts.
Can You Use Location Intelligence Without GIS Expertise?
Yes. Platforms like Maptive are browser-based and designed for business users. The spatial analysis operates in the background while users interact with a familiar map interface. Teams at Amazon, Coca-Cola, and Capital One use Maptive without dedicated GIS staff. Anyone comfortable with spreadsheets can use the platform.
What Types of Businesses Benefit Most from Location Intelligence?
Any organization with customers, assets, or operations tied to physical locations. Strong use cases include:
- Retail and franchise operations for site selection and territory design.
- Field services for route optimization.
- Sales organizations for territory management.
- Real estate for market analysis.
- Healthcare for facility planning.
- Logistics for distribution optimization.
Industry research estimates that 80% of business data includes a location component, which means many organizations could benefit from geographic analysis.
How Much Does Location Intelligence Software Cost?
Costs vary across the market. Maptive includes 60+ mapping and analysis tools across all plans, with no feature gating by tier. The 45-Day Pass costs $250. Pro costs $1,250 per year. The Team plan covers five users at $2,500 per year. Enterprise pricing is custom. All plans include phone, chat, and email support from mapping specialists. A free trial is available with no credit card required.
How Is Location Intelligence Different from Business Intelligence?
Business intelligence focuses on what happened and when it happened. Location intelligence includes geographic context to provide additional insight. BI tools generate charts and dashboards. Location intelligence tools generate interactive maps with spatial analysis features such as territory optimization, drive-time modeling, and demographic overlay.
A BI dashboard might show that sales declined in a region. Location intelligence can identify geographic factors contributing to the decline, such as a competitor opening nearby, population shifts, or a coverage gap after a representative’s departure.
How Often Should Location Data Analysis Be Updated?
The appropriate frequency depends on the use case. Route optimization should run daily or weekly to address changing schedules and stop lists. Territory rebalancing should occur quarterly or in response to specific events, such as a rep change, a product launch, or customer churn. Site selection analyses are project-based and conducted as needed. Demographic overlays should be updated when new Census data are available.
Maptive’s CRM integrations with Salesforce, HubSpot, and Zoho keep map data in sync with live customer records, reducing the manual effort required to keep the geographic view up to date.


